
 Login Sign Up


| |||||
 |  | ||||

| 12Stocks.com Market Intelligence |
Best Emerging Markets Stocks
| In a hurry? Emerging Markets Stocks Lists: Trends Table, Stock Charts
Sort Emerging Markets stocks: Daily, Weekly, Year-to-Date, Market Cap & Trends. Filter Emerging Markets stocks list by sector: Show all, Tech, Finance, Energy, Staples, Retail, Industrial, Materials, Utilities and HealthCare Filter Emerging Markets stocks list by size:All Large Medium Small |
| 12Stocks.com Emerging Markets Stocks Performances & Trends Daily | |||||||||
|
|  The overall Smart Investing & Trading Score is 49 (0-bearish to 100-bullish) which puts Emerging Markets index in short term neutral trend. The Smart Investing & Trading Score from previous trading session is 48 and hence an improvement of trend.
| ||||||||
Here are the Smart Investing & Trading Scores of the most requested Emerging Markets stocks at 12Stocks.com (click stock name for detailed review):
|


| 12Stocks.com: Top Performing Emerging Markets Index Stocks | ||||||||||||||||||||||||||||||||||||||||||||||||
 The top performing Emerging Markets Index stocks year to date are
Now, more recently, over last week, the top performing Emerging Markets Index stocks on the move are


|
||||||||||||||||||||||||||||||||||||||||||||||||
| 12Stocks.com: Investing in Emerging Markets Index with Stocks | |
|
The following table helps investors and traders sort through current performance and trends (as measured by Smart Investing & Trading Score ) of various
stocks in the Emerging Markets Index. Quick View: Move mouse or cursor over stock symbol (ticker) to view short-term technical chart and over stock name to view long term chart. Click on  to add stock symbol to your watchlist and to add stock symbol to your watchlist and  to view watchlist. Click on any ticker or stock name for detailed market intelligence report for that stock. to view watchlist. Click on any ticker or stock name for detailed market intelligence report for that stock. |
12Stocks.com Performance of Stocks in Emerging Markets Index
| Ticker | Stock Name | Watchlist | Category | Recent Price | Smart Investing & Trading Score | Change % | YTD Change% |
| GGB | Gerdau S.A |   | Materials | 3.66 | 7 | 2.52 | -24.54% |
| ICG | Intchains | | Technology | 8.30 | 49 | 2.47 | -32.52% |
| DADA | Dada Nexus | | Services & Goods | 1.89 | 27 | 2.17 | -43.22% |
| OCFT | OneConnect Financial | | Technology | 1.89 | 10 | 2.16 | -40.00% |
| LXEH | Lixiang Education | | Consumer Staples | 0.41 | 35 | 2.00 | -62.30% |
| YI | 111 | | Services & Goods | 1.02 | 32 | 2.00 | -34.19% |
| YMM | Full Truck | | Technology | 7.77 | 93 | 1.97 | 11.08% |
| STG | Sunlands | | Services & Goods | 8.16 | 10 | 1.94 | -19.71% |
| QH | Quhuo | | Technology | 0.63 | 57 | 1.89 | -57.12% |
| MSC | Studio City | | Services & Goods | 7.49 | 73 | 1.89 | 15.59% |
| LU | Lufax Holding | | Financials | 4.35 | 83 | 1.87 | 41.69% |
| HMY | Harmony Gold | | Materials | 9.29 | 88 | 1.86 | 51.06% |
| INFY | Infosys | | Technology | 16.81 | 17 | 1.82 | -8.54% |
| UXIN | Uxin | | Technology | 1.69 | 32 | 1.81 | 141.08% |
| RC | Ready Capital | | Financials | 8.62 | 52 | 1.77 | -15.90% |
| WIT | Wipro | | Technology | 5.25 | 17 | 1.74 | -5.75% |
| SUZ | Suzano S.A | | Consumer Staples | 11.79 | 58 | 1.73 | 3.79% |
| CIG | Companhia Energetica | | Utilities | 2.48 | 68 | 1.64 | 6.90% |
| CSAN | Cosan S.A | | Energy | 11.08 | 32 | 1.60 | -29.67% |
| JFIN | Jiayin | | Technology | 6.45 | 58 | 1.49 | 24.52% |
| CANG | Cango | | Technology | 1.40 | 56 | 1.45 | 37.25% |
| YQ | 17 Education | | Consumer Staples | 2.46 | 58 | 1.44 | 20.83% |
| UGP | Ultrapar Participacoes | | Energy | 5.15 | 17 | 1.38 | -4.98% |
| VNET | 21Vianet | | Technology | 1.49 | 22 | 1.36 | -48.08% |
| QD | Qudian | | Technology | 2.28 | 43 | 1.33 | 11.76% |
| For chart view version of above stock list: Chart View ➞ 0 - 25 , 25 - 50 , 50 - 75 , 75 - 100 , 100 - 125 , 125 - 150 , 150 - 175 , 175 - 200 | ||
 | Click To Change The Sort Order: By Market Cap or Company Size Performance: Year-to-date, Week and Day |  |
|
Get the most comprehensive stock market coverage daily at 12Stocks.com ➞ Best Stocks Today ➞ Best Stocks Weekly ➞ Best Stocks Year-to-Date ➞ Best Stocks Trends ➞  Best Stocks Today 12Stocks.com Best Nasdaq Stocks ➞ Best S&P 500 Stocks ➞ Best Tech Stocks ➞ Best Biotech Stocks ➞ |
| Detailed Overview of Emerging Markets Stocks |
| Emerging Markets Technical Overview, Leaders & Laggards, Top Emerging Markets ETF Funds & Detailed Emerging Markets Stocks List, Charts, Trends & More |
| Emerging Markets: Technical Analysis, Trends & YTD Performance | |
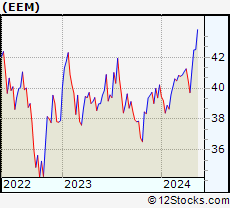
 EEM Weekly Chart |
|
| Long Term Trend: Good | |
| Medium Term Trend: Not Good | |
 EEM Daily Chart |
|
| Short Term Trend: Not Good | |
| Overall Trend Score: 49 | |
| YTD Performance: -1.24% | |
| **Trend Scores & Views Are Only For Educational Purposes And Not For Investing | |
| 12Stocks.com: Investing in Emerging Markets Index using Exchange Traded Funds | |
|
The following table shows list of key exchange traded funds (ETF) that
help investors play Emerging Markets stock market. For detailed view, check out our ETF Funds section of our website. Quick View: Move mouse or cursor over ETF symbol (ticker) to view short-term technical chart and over ETF name to view long term chart. Click on ticker or stock name for detailed view. Click on to add stock symbol to your watchlist and to view watchlist. |
12Stocks.com List of ETFs that track Emerging Markets Index
| Ticker | ETF Name | Watchlist | Recent Price | Smart Investing & Trading Score | Change % | Week % | Year-to-date % |
| EEM | Emerging Markets | | 39.71 | 49 | -0.40 | -2.02 | -1.24% |
| VWO | Emerging Markets | | 40.89 | 49 | -0.29 | -1.71 | -0.51% |
| SCHE | Emerging Markets Equity | | 24.69 | 41 | -0.36 | -1.75 | -0.4% |
| EWX | Emerging Markets Small | | 55.17 | 41 | -0.79 | -1.59 | -2.28% |
| EET | Emerging Markets | | 47.72 | 49 | -0.65 | -4.18 | -6.18% |
| EDC | Emrg Mkts Bull | | 27.07 | 49 | -1.42 | -6.27 | -11.04% |
| EEV | Short Emerging | | 20.52 | 62 | 0.73 | 3.94 | 4.03% |
| EUM | Short Emerging | | 14.49 | 62 | 0.50 | 2.16 | 2.42% |
| EDIV | Emerging Markets Dividend | | 33.01 | 51 | 0.33 | 0.21 | 1.51% |
| EMIF | Emerging Markets Infrastructure | | 21.38 | 51 | 0.14 | -1.85 | -0.09% |
| CEW | Emerging Currency Strat | | 17.61 | 38 | 0.10 | -0.45 | -2.22% |
| EBND | Em Mkts Lcl | | 19.93 | 32 | 0.35 | -0.7 | -6.17% |
| EMCB | Emerging Markets Corp | | 63.59 | 0 | -0.41 | -0.79 | -0.49% |
| VWOB | Emerging Mkts Govt | | 62.33 | 32 | 0.27 | -0.53 | -2.23% |
| EEMA | Emerging Markets Asia | | 66.09 | 49 | -0.40 | -1.85 | -0.03% |
| EELV | Em Mkts Low | | 23.16 | 18 | -0.22 | -1.51 | -3.66% |
| DVYE | Emerging Markets Dividend | | 26.48 | 88 | 0.76 | 0.08 | -0.04% |
| SDEM | SuperDividend Em Mkts | | 25.86 | 83 | 0.58 | 0.61 | 4.29% |
| DBEM | Em Mkts Hdgd | | 23.10 | 49 | -0.52 | -1.79 | 0.13% |
| PCY | Emerging Markets Sov | | 19.81 | 32 | 0.25 | -1.05 | -3.93% |
| QEMM | Emerging Mkts StratcFacts | | 56.16 | 44 | -0.04 | -1.27 | -1.74% |
| 12Stocks.com: Charts, Trends, Fundamental Data and Performances of Emerging Markets Stocks | |
|
We now take in-depth look at all Emerging Markets stocks including charts, multi-period performances and overall trends (as measured by Smart Investing & Trading Score ). One can sort Emerging Markets stocks (click link to choose) by Daily, Weekly and by Year-to-Date performances. Also, one can sort by size of the company or by market capitalization. |
| Select Your Default Chart Type: | |||||
| |||||
| Click on stock symbol or name for detailed view. Click on to add stock symbol to your watchlist and to view watchlist. Quick View: Move mouse or cursor over "Daily" to quickly view daily technical stock chart and over "Weekly" to view weekly technical stock chart. | |||||

 | GGB Gerdau S.A. |
| Sector: Materials | |
| SubSector: Steel & Iron | |
| MarketCap: 3607.48 Millions | |
| Recent Price: 3.66 Smart Investing & Trading Score : 7 | |
| Day Percent Change: 2.52% Day Change: 0.09 | |
| Week Change: -15.28% Year-to-date Change: -24.5% | |
| GGB Links: Profile News Message Board | |
| Charts:- Daily , Weekly | |
| Add GGB to Watchlist: View: Get Complete GGB Trend Analysis ➞ | |
 | ICG Intchains Group Limited |
| Sector: Technology | |
| SubSector: Semiconductors | |
| MarketCap: 450 Millions | |
| Recent Price: 8.30 Smart Investing & Trading Score : 49 | |
| Day Percent Change: 2.47% Day Change: 0.20 | |
| Week Change: 0.61% Year-to-date Change: -32.5% | |
| ICG Links: Profile News Message Board | |
| Charts:- Daily , Weekly | |
| Add ICG to Watchlist: View: Get Complete ICG Trend Analysis ➞ | |
 | DADA Dada Nexus Limited |
| Sector: Services & Goods | |
| SubSector: Internet Retail | |
| MarketCap: 98527 Millions | |
| Recent Price: 1.89 Smart Investing & Trading Score : 27 | |
| Day Percent Change: 2.17% Day Change: 0.04 | |
| Week Change: -1.31% Year-to-date Change: -43.2% | |
| DADA Links: Profile News Message Board | |
| Charts:- Daily , Weekly | |
| Add DADA to Watchlist: View: Get Complete DADA Trend Analysis ➞ | |
 | OCFT OneConnect Financial Technology Co., Ltd. |
| Sector: Technology | |
| SubSector: Software Application | |
| MarketCap: 80387 Millions | |
| Recent Price: 1.89 Smart Investing & Trading Score : 10 | |
| Day Percent Change: 2.16% Day Change: 0.04 | |
| Week Change: -3.08% Year-to-date Change: -40.0% | |
| OCFT Links: Profile News Message Board | |
| Charts:- Daily , Weekly | |
| Add OCFT to Watchlist: View: Get Complete OCFT Trend Analysis ➞ | |
 | LXEH Lixiang Education Holding Co., Ltd. |
| Sector: Consumer Staples | |
| SubSector: Education & Training Services | |
| MarketCap: 12347 Millions | |
| Recent Price: 0.41 Smart Investing & Trading Score : 35 | |
| Day Percent Change: 2.00% Day Change: 0.01 | |
| Week Change: -6.62% Year-to-date Change: -62.3% | |
| LXEH Links: Profile News Message Board | |
| Charts:- Daily , Weekly | |
| Add LXEH to Watchlist: View: Get Complete LXEH Trend Analysis ➞ | |
 | YI 111, Inc. |
| Sector: Services & Goods | |
| SubSector: Drug Stores | |
| MarketCap: 520.351 Millions | |
| Recent Price: 1.02 Smart Investing & Trading Score : 32 | |
| Day Percent Change: 2.00% Day Change: 0.02 | |
| Week Change: -7.27% Year-to-date Change: -34.2% | |
| YI Links: Profile News Message Board | |
| Charts:- Daily , Weekly | |
| Add YI to Watchlist: View: Get Complete YI Trend Analysis ➞ | |
 | YMM Full Truck Alliance Co. Ltd. |
| Sector: Technology | |
| SubSector: Software - Application | |
| MarketCap: 6960 Millions | |
| Recent Price: 7.77 Smart Investing & Trading Score : 93 | |
| Day Percent Change: 1.97% Day Change: 0.15 | |
| Week Change: 0.78% Year-to-date Change: 11.1% | |
| YMM Links: Profile News Message Board | |
| Charts:- Daily , Weekly | |
| Add YMM to Watchlist: View: Get Complete YMM Trend Analysis ➞ | |
 | STG Sunlands Technology Group |
| Sector: Services & Goods | |
| SubSector: Education & Training Services | |
| MarketCap: 295.706 Millions | |
| Recent Price: 8.16 Smart Investing & Trading Score : 10 | |
| Day Percent Change: 1.94% Day Change: 0.15 | |
| Week Change: -7.02% Year-to-date Change: -19.7% | |
| STG Links: Profile News Message Board | |
| Charts:- Daily , Weekly | |
| Add STG to Watchlist: View: Get Complete STG Trend Analysis ➞ | |
 | QH Quhuo Limited |
| Sector: Technology | |
| SubSector: Software Application | |
| MarketCap: 37787 Millions | |
| Recent Price: 0.63 Smart Investing & Trading Score : 57 | |
| Day Percent Change: 1.89% Day Change: 0.01 | |
| Week Change: 8.87% Year-to-date Change: -57.1% | |
| QH Links: Profile News Message Board | |
| Charts:- Daily , Weekly | |
| Add QH to Watchlist: View: Get Complete QH Trend Analysis ➞ | |
 | MSC Studio City International Holdings Limited |
| Sector: Services & Goods | |
| SubSector: Resorts & Casinos | |
| MarketCap: 1420.54 Millions | |
| Recent Price: 7.49 Smart Investing & Trading Score : 73 | |
| Day Percent Change: 1.89% Day Change: 0.14 | |
| Week Change: -11.88% Year-to-date Change: 15.6% | |
| MSC Links: Profile News Message Board | |
| Charts:- Daily , Weekly | |
| Add MSC to Watchlist: View: Get Complete MSC Trend Analysis ➞ | |
 | LU Lufax Holding Ltd |
| Sector: Financials | |
| SubSector: Credit Services | |
| MarketCap: 33457 Millions | |
| Recent Price: 4.35 Smart Investing & Trading Score : 83 | |
| Day Percent Change: 1.87% Day Change: 0.08 | |
| Week Change: 5.07% Year-to-date Change: 41.7% | |
| LU Links: Profile News Message Board | |
| Charts:- Daily , Weekly | |
| Add LU to Watchlist: View: Get Complete LU Trend Analysis ➞ | |
 | HMY Harmony Gold Mining Company Limited |
| Sector: Materials | |
| SubSector: Gold | |
| MarketCap: 1371.69 Millions | |
| Recent Price: 9.29 Smart Investing & Trading Score : 88 | |
| Day Percent Change: 1.86% Day Change: 0.17 | |
| Week Change: 1.98% Year-to-date Change: 51.1% | |
| HMY Links: Profile News Message Board | |
| Charts:- Daily , Weekly | |
| Add HMY to Watchlist: View: Get Complete HMY Trend Analysis ➞ | |
 | INFY Infosys Limited |
| Sector: Technology | |
| SubSector: Information Technology Services | |
| MarketCap: 33819.1 Millions | |
| Recent Price: 16.81 Smart Investing & Trading Score : 17 | |
| Day Percent Change: 1.82% Day Change: 0.30 | |
| Week Change: -5.14% Year-to-date Change: -8.5% | |
| INFY Links: Profile News Message Board | |
| Charts:- Daily , Weekly | |
| Add INFY to Watchlist: View: Get Complete INFY Trend Analysis ➞ | |
 | UXIN Uxin Limited |
| Sector: Technology | |
| SubSector: Internet Information Providers | |
| MarketCap: 414.58 Millions | |
| Recent Price: 1.69 Smart Investing & Trading Score : 32 | |
| Day Percent Change: 1.81% Day Change: 0.03 | |
| Week Change: -9.63% Year-to-date Change: 141.1% | |
| UXIN Links: Profile News Message Board | |
| Charts:- Daily , Weekly | |
| Add UXIN to Watchlist: View: Get Complete UXIN Trend Analysis ➞ | |
 | RC Ready Capital Corporation |
| Sector: Financials | |
| SubSector: Mortgage Investment | |
| MarketCap: 358.039 Millions | |
| Recent Price: 8.62 Smart Investing & Trading Score : 52 | |
| Day Percent Change: 1.77% Day Change: 0.15 | |
| Week Change: 3.61% Year-to-date Change: -15.9% | |
| RC Links: Profile News Message Board | |
| Charts:- Daily , Weekly | |
| Add RC to Watchlist: View: Get Complete RC Trend Analysis ➞ | |
 | WIT Wipro Limited |
| Sector: Technology | |
| SubSector: Information Technology Services | |
| MarketCap: 15101.3 Millions | |
| Recent Price: 5.25 Smart Investing & Trading Score : 17 | |
| Day Percent Change: 1.74% Day Change: 0.09 | |
| Week Change: -3.85% Year-to-date Change: -5.8% | |
| WIT Links: Profile News Message Board | |
| Charts:- Daily , Weekly | |
| Add WIT to Watchlist: View: Get Complete WIT Trend Analysis ➞ | |
 | SUZ Suzano S.A. |
| Sector: Consumer Staples | |
| SubSector: Paper & Paper Products | |
| MarketCap: 7042.93 Millions | |
| Recent Price: 11.79 Smart Investing & Trading Score : 58 | |
| Day Percent Change: 1.73% Day Change: 0.20 | |
| Week Change: -0.92% Year-to-date Change: 3.8% | |
| SUZ Links: Profile News Message Board | |
| Charts:- Daily , Weekly | |
| Add SUZ to Watchlist: View: Get Complete SUZ Trend Analysis ➞ | |
 | CIG Companhia Energetica de Minas Gerais |
| Sector: Utilities | |
| SubSector: Electric Utilities | |
| MarketCap: 3203.54 Millions | |
| Recent Price: 2.48 Smart Investing & Trading Score : 68 | |
| Day Percent Change: 1.64% Day Change: 0.04 | |
| Week Change: 0.4% Year-to-date Change: 6.9% | |
| CIG Links: Profile News Message Board | |
| Charts:- Daily , Weekly | |
| Add CIG to Watchlist: View: Get Complete CIG Trend Analysis ➞ | |
 | CSAN Cosan S.A. |
| Sector: Energy | |
| SubSector: Oil & Gas Refining & Marketing | |
| MarketCap: 6890 Millions | |
| Recent Price: 11.08 Smart Investing & Trading Score : 32 | |
| Day Percent Change: 1.60% Day Change: 0.18 | |
| Week Change: -4.89% Year-to-date Change: -29.7% | |
| CSAN Links: Profile News Message Board | |
| Charts:- Daily , Weekly | |
| Add CSAN to Watchlist: View: Get Complete CSAN Trend Analysis ➞ | |
 | JFIN Jiayin Group Inc. |
| Sector: Technology | |
| SubSector: Internet Information Providers | |
| MarketCap: 131.48 Millions | |
| Recent Price: 6.45 Smart Investing & Trading Score : 58 | |
| Day Percent Change: 1.49% Day Change: 0.09 | |
| Week Change: -0.15% Year-to-date Change: 24.5% | |
| JFIN Links: Profile News Message Board | |
| Charts:- Daily , Weekly | |
| Add JFIN to Watchlist: View: Get Complete JFIN Trend Analysis ➞ | |
 | CANG Cango Inc. |
| Sector: Technology | |
| SubSector: Internet Information Providers | |
| MarketCap: 947.48 Millions | |
| Recent Price: 1.40 Smart Investing & Trading Score : 56 | |
| Day Percent Change: 1.45% Day Change: 0.02 | |
| Week Change: -4.11% Year-to-date Change: 37.3% | |
| CANG Links: Profile News Message Board | |
| Charts:- Daily , Weekly | |
| Add CANG to Watchlist: View: Get Complete CANG Trend Analysis ➞ | |
 | YQ 17 Education & Technology Group Inc. |
| Sector: Consumer Staples | |
| SubSector: Education & Training Services | |
| MarketCap: 32347 Millions | |
| Recent Price: 2.46 Smart Investing & Trading Score : 58 | |
| Day Percent Change: 1.44% Day Change: 0.03 | |
| Week Change: -5.19% Year-to-date Change: 20.8% | |
| YQ Links: Profile News Message Board | |
| Charts:- Daily , Weekly | |
| Add YQ to Watchlist: View: Get Complete YQ Trend Analysis ➞ | |
 | UGP Ultrapar Participacoes S.A. |
| Sector: Energy | |
| SubSector: Oil & Gas Refining & Marketing | |
| MarketCap: 3473.54 Millions | |
| Recent Price: 5.15 Smart Investing & Trading Score : 17 | |
| Day Percent Change: 1.38% Day Change: 0.07 | |
| Week Change: -2.09% Year-to-date Change: -5.0% | |
| UGP Links: Profile News Message Board | |
| Charts:- Daily , Weekly | |
| Add UGP to Watchlist: View: Get Complete UGP Trend Analysis ➞ | |
 | VNET 21Vianet Group, Inc. |
| Sector: Technology | |
| SubSector: Information Technology Services | |
| MarketCap: 1846.98 Millions | |
| Recent Price: 1.49 Smart Investing & Trading Score : 22 | |
| Day Percent Change: 1.36% Day Change: 0.02 | |
| Week Change: -7.45% Year-to-date Change: -48.1% | |
| VNET Links: Profile News Message Board | |
| Charts:- Daily , Weekly | |
| Add VNET to Watchlist: View: Get Complete VNET Trend Analysis ➞ | |
 | QD Qudian Inc. |
| Sector: Technology | |
| SubSector: Information Technology Services | |
| MarketCap: 544.968 Millions | |
| Recent Price: 2.28 Smart Investing & Trading Score : 43 | |
| Day Percent Change: 1.33% Day Change: 0.03 | |
| Week Change: -5.79% Year-to-date Change: 11.8% | |
| QD Links: Profile News Message Board | |
| Charts:- Daily , Weekly | |
| Add QD to Watchlist: View: Get Complete QD Trend Analysis ➞ | |
| For tabular summary view of above stock list: Summary View ➞ 0 - 25 , 25 - 50 , 50 - 75 , 75 - 100 , 100 - 125 , 125 - 150 , 150 - 175 , 175 - 200 | ||
| Click To Change The Sort Order: By Market Cap or Company Size Performance: Year-to-date, Week and Day | |
| Select Chart Type: | ||
|
Best Stocks Today 12Stocks.com |
© 2024 12Stocks.com Terms & Conditions Privacy Contact Us
All Information Provided Only For Education And Not To Be Used For Investing or Trading. See Terms & Conditions


One More Thing ... Get Best Stocks Delivered Daily!
Never Ever Miss A Move With Our Top Ten Stocks Lists
Find Best Stocks In Any Market - Bull or Bear Market
Take A Peek At Our Top Ten Stocks Lists: Daily, Weekly, Year-to-Date & Top Trends
Find Best Stocks In Any Market - Bull or Bear Market
Take A Peek At Our Top Ten Stocks Lists: Daily, Weekly, Year-to-Date & Top Trends
Emerging Markets Stocks With Best Up Trends [0-bearish to 100-bullish]: HDFC Bank[93], Full Truck[93], DouYu [90], Harmony Gold[88], GDS [88], Bright Scholar[85], Gold Fields[85], MOGU [83], Lufax Holding[83], So-Young [83], DRDGOLD [81]
Best Emerging Markets Stocks Year-to-Date:
U Power[2768.3%], DouYu [747.37%], MicroCloud Hologram[702.88%], China Liberal[476.51%], Zhongchao [412.19%], Yatsen Holding[394.12%], Uxin [141.08%], QuantaSing [106.79%], GigaCloud [89.46%], Bright Scholar[60.8%], Cheetah Mobile[55.26%] Best Emerging Markets Stocks This Week:
Regencell Bioscience[45.67%], Yatsen Holding[20.1%], MingZhu Logistics[17.48%], Secoo Holding[17.14%], Zhongchao [14.02%], TH [11.82%], Controladora Vuela[10.64%], Bright Scholar[9.24%], Quhuo [8.87%], Smart Share[7.58%], DouYu [6.62%] Best Emerging Markets Stocks Daily:
Lanvin [11.19%], MingZhu Logistics[10.31%], Bright Scholar[6.91%], Regencell Bioscience[6.32%], Ambipar Emergency[6.09%], MOGU [5.85%], Petroleo Brasileiro[5.71%], Cheetah Mobile[5.04%], Secoo Holding[4.75%], BrasilAgro -[4.38%], Companhia Siderurgica[3.68%]