
 Login Sign Up


| |||||
 |  | ||||

| 12Stocks.com Market Intelligence |
Best Emerging Markets Stocks
| In a hurry? Emerging Markets Stocks Lists: Trends Table, Stock Charts
Sort Emerging Markets stocks: Daily, Weekly, Year-to-Date, Market Cap & Trends. Filter Emerging Markets stocks list by sector: Show all, Tech, Finance, Energy, Staples, Retail, Industrial, Materials, Utilities and HealthCare Filter Emerging Markets stocks list by size:All Large Medium Small |
| 12Stocks.com Emerging Markets Stocks Performances & Trends Daily | |||||||||
|
|  The overall Smart Investing & Trading Score is 100 (0-bearish to 100-bullish) which puts Emerging Markets index in short term bullish trend. The Smart Investing & Trading Score from previous trading session is 78 and an improvement of trend continues.
| ||||||||
Here are the Smart Investing & Trading Scores of the most requested Emerging Markets stocks at 12Stocks.com (click stock name for detailed review):
|


| 12Stocks.com: Top Performing Emerging Markets Index Stocks | ||||||||||||||||||||||||||||||||||||||||||||||||
 The top performing Emerging Markets Index stocks year to date are
Now, more recently, over last week, the top performing Emerging Markets Index stocks on the move are


|
||||||||||||||||||||||||||||||||||||||||||||||||
| 12Stocks.com: Investing in Emerging Markets Index with Stocks | |
|
The following table helps investors and traders sort through current performance and trends (as measured by Smart Investing & Trading Score ) of various
stocks in the Emerging Markets Index. Quick View: Move mouse or cursor over stock symbol (ticker) to view short-term technical chart and over stock name to view long term chart. Click on  to add stock symbol to your watchlist and to add stock symbol to your watchlist and  to view watchlist. Click on any ticker or stock name for detailed market intelligence report for that stock. to view watchlist. Click on any ticker or stock name for detailed market intelligence report for that stock. |
12Stocks.com Performance of Stocks in Emerging Markets Index
| Ticker | Stock Name | Watchlist | Category | Recent Price | Smart Investing & Trading Score | Change % | YTD Change% |
| ASAI | Sendas Distribuidora |   | Consumer Staples | 13.42 | 52 | 2.52% | -2.72% |
| WIMI | WiMi Hologram | | Technology | 0.96 | 52 | 1.60% | 19.27% |
| QH | Quhuo | | Technology | 0.58 | 52 | 0.84% | -60.34% |
| IMOS | ChipMOS | | Technology | 28.21 | 52 | -1.33% | 3.68% |
| CMCM | Cheetah Mobile | | Technology | 3.97 | 51 | -0.25% | 74.12% |
| AZUL | Azul S.A | | Transports | 6.42 | 49 | 8.63% | -33.75% |
| XP | XP | | Financials | 22.39 | 49 | 5.96% | -14.12% |
| GGB | Gerdau S.A | | Materials | 3.80 | 49 | 5.26% | -21.65% |
| INTR | Inter & Co | | Financials | 5.32 | 49 | 4.01% | -5.17% |
| EBON | Ebang | | Technology | 7.99 | 49 | 2.96% | -47.69% |
| BBDO | Banco Bradesco | | Financials | 2.43 | 49 | 2.10% | -23.59% |
| ITUB | Itau Unibanco | | Financials | 6.34 | 49 | 1.44% | -8.78% |
| FINV | FinVolution | | Financials | 5.01 | 49 | -0.40% | 2.24% |
| CSAN | Cosan S.A | | Energy | 11.56 | 49 | -0.26% | -26.63% |
| HMY | Harmony Gold | | Materials | 8.57 | 48 | 1.18% | 39.35% |
| CLEU | China Liberal | | Consumer Staples | 1.10 | 45 | 4.76% | 515.21% |
| SMI | Semiconductor | | Technology | 45.68 | 43 | 0.15% | -1.66% |
| ICG | Intchains | | Technology | 7.99 | 42 | 4.99% | -35.04% |
| LVRO | Lavoro | | Materials | 6.00 | 42 | 3.63% | -32.43% |
| INFY | Infosys | | Technology | 16.93 | 42 | 0.36% | -7.89% |
| FANH | Fanhua | | Financials | 3.43 | 42 | 0.29% | -48.42% |
| LI | Li Auto | | Services & Goods | 27.99 | 42 | -3.42% | -25.24% |
| ZH | Zhihu | | Services & Goods | 0.68 | 39 | 2.11% | -28.36% |
| BBD | Banco Bradesco | | Financials | 2.72 | 39 | 0.00% | -22.29% |
| PBR | Petroleo Brasileiro | | Energy | 16.43 | 38 | -5.25% | 2.88% |
| For chart view version of above stock list: Chart View ➞ 0 - 25 , 25 - 50 , 50 - 75 , 75 - 100 , 100 - 125 , 125 - 150 , 150 - 175 , 175 - 200 | ||
 | Click To Change The Sort Order: By Market Cap or Company Size Performance: Year-to-date, Week and Day |  |
|
Get the most comprehensive stock market coverage daily at 12Stocks.com ➞ Best Stocks Today ➞ Best Stocks Weekly ➞ Best Stocks Year-to-Date ➞ Best Stocks Trends ➞  Best Stocks Today 12Stocks.com Best Nasdaq Stocks ➞ Best S&P 500 Stocks ➞ Best Tech Stocks ➞ Best Biotech Stocks ➞ |
| Detailed Overview of Emerging Markets Stocks |
| Emerging Markets Technical Overview, Leaders & Laggards, Top Emerging Markets ETF Funds & Detailed Emerging Markets Stocks List, Charts, Trends & More |
| Emerging Markets: Technical Analysis, Trends & YTD Performance | |
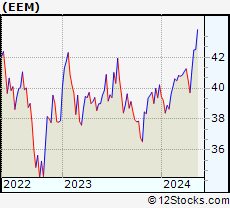
 EEM Weekly Chart |
|
| Long Term Trend: Very Good | |
| Medium Term Trend: Very Good | |
 EEM Daily Chart |
|
| Short Term Trend: Very Good | |
| Overall Trend Score: 100 | |
| YTD Performance: 5.62% | |
| **Trend Scores & Views Are Only For Educational Purposes And Not For Investing | |
| 12Stocks.com: Investing in Emerging Markets Index using Exchange Traded Funds | |
|
The following table shows list of key exchange traded funds (ETF) that
help investors play Emerging Markets stock market. For detailed view, check out our ETF Funds section of our website. Quick View: Move mouse or cursor over ETF symbol (ticker) to view short-term technical chart and over ETF name to view long term chart. Click on ticker or stock name for detailed view. Click on to add stock symbol to your watchlist and to view watchlist. |
12Stocks.com List of ETFs that track Emerging Markets Index
| Ticker | ETF Name | Watchlist | Recent Price | Smart Investing & Trading Score | Change % | Week % | Year-to-date % |
| EEM | Emerging Markets | | 42.47 | 100 | 0.90 | 3.16 | 5.62% |
| VWO | Emerging Markets | | 43.63 | 100 | 0.88 | 3.1 | 6.16% |
| SCHE | Emerging Markets Equity | | 26.35 | 100 | 0.73 | 3.05 | 6.29% |
| EWX | Emerging Markets Small | | 58.18 | 100 | 0.48 | 2.74 | 3.05% |
| EET | Emerging Markets | | 54.38 | 100 | 1.75 | 6.15 | 6.93% |
| EDC | Emrg Mkts Bull | | 32.85 | 100 | 2.82 | 9.46 | 7.95% |
| EEV | Short Emerging | | 18.10 | 0 | -0.39 | -5.85 | -8.23% |
| EUM | Short Emerging | | 13.57 | 0 | -0.84 | -3 | -4.13% |
| EDIV | Emerging Markets Dividend | | 34.42 | 95 | 0.00 | 2.41 | 5.84% |
| EMIF | Emerging Markets Infrastructure | | 22.44 | 100 | 1.77 | 1.45 | 4.86% |
| CEW | Emerging Currency Strat | | 17.88 | 90 | 0.56 | 1.13 | -0.69% |
| EBND | Em Mkts Lcl | | 20.20 | 50 | 0.75 | 1.25 | -4.9% |
| EMCB | Emerging Markets Corp | | 64.20 | 67 | 0.38 | 0.76 | 0.47% |
| VWOB | Emerging Mkts Govt | | 62.99 | 75 | 0.69 | 0.95 | -1.19% |
| EEMA | Emerging Markets Asia | | 71.10 | 100 | 1.08 | 3.42 | 7.55% |
| EELV | Em Mkts Low | | 24.10 | 100 | 0.67 | 2.95 | 0.25% |
| DVYE | Emerging Markets Dividend | | 27.95 | 100 | 1.12 | 3.63 | 5.51% |
| SDEM | SuperDividend Em Mkts | | 26.02 | 77 | 0.13 | 1.98 | 4.95% |
| DBEM | Em Mkts Hdgd | | 24.50 | 100 | 0.57 | 2.25 | 6.2% |
| PCY | Emerging Markets Sov | | 20.13 | 75 | 1.21 | 1.98 | -2.38% |
| QEMM | Emerging Mkts StratcFacts | | 58.78 | 100 | 0.62 | 2.51 | 2.84% |
| 12Stocks.com: Charts, Trends, Fundamental Data and Performances of Emerging Markets Stocks | |
|
We now take in-depth look at all Emerging Markets stocks including charts, multi-period performances and overall trends (as measured by Smart Investing & Trading Score ). One can sort Emerging Markets stocks (click link to choose) by Daily, Weekly and by Year-to-Date performances. Also, one can sort by size of the company or by market capitalization. |
| Select Your Default Chart Type: | |||||
| |||||
| Click on stock symbol or name for detailed view. Click on to add stock symbol to your watchlist and to view watchlist. Quick View: Move mouse or cursor over "Daily" to quickly view daily technical stock chart and over "Weekly" to view weekly technical stock chart. | |||||

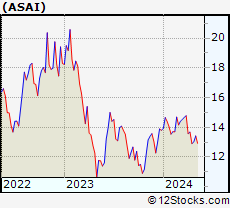 | ASAI Sendas Distribuidora S.A. |
| Sector: Consumer Staples | |
| SubSector: Grocery Stores | |
| MarketCap: 3790 Millions | |
| Recent Price: 13.42 Smart Investing & Trading Score : 52 | |
| Day Percent Change: 2.52% Day Change: 0.33 | |
| Week Change: 3.07% Year-to-date Change: -2.7% | |
| ASAI Links: Profile News Message Board | |
| Charts:- Daily , Weekly | |
| Add ASAI to Watchlist: View: Get Complete ASAI Trend Analysis ➞ | |
 | WIMI WiMi Hologram Cloud Inc. |
| Sector: Technology | |
| SubSector: Advertising Agencies | |
| MarketCap: 41837 Millions | |
| Recent Price: 0.96 Smart Investing & Trading Score : 52 | |
| Day Percent Change: 1.60% Day Change: 0.02 | |
| Week Change: -5.87% Year-to-date Change: 19.3% | |
| WIMI Links: Profile News Message Board | |
| Charts:- Daily , Weekly | |
| Add WIMI to Watchlist: View: Get Complete WIMI Trend Analysis ➞ | |
 | QH Quhuo Limited |
| Sector: Technology | |
| SubSector: Software Application | |
| MarketCap: 37787 Millions | |
| Recent Price: 0.58 Smart Investing & Trading Score : 52 | |
| Day Percent Change: 0.84% Day Change: 0.00 | |
| Week Change: 5.27% Year-to-date Change: -60.3% | |
| QH Links: Profile News Message Board | |
| Charts:- Daily , Weekly | |
| Add QH to Watchlist: View: Get Complete QH Trend Analysis ➞ | |
 | IMOS ChipMOS TECHNOLOGIES INC. |
| Sector: Technology | |
| SubSector: Semiconductor Equipment & Materials | |
| MarketCap: 658.918 Millions | |
| Recent Price: 28.21 Smart Investing & Trading Score : 52 | |
| Day Percent Change: -1.33% Day Change: -0.38 | |
| Week Change: -0.77% Year-to-date Change: 3.7% | |
| IMOS Links: Profile News Message Board | |
| Charts:- Daily , Weekly | |
| Add IMOS to Watchlist: View: Get Complete IMOS Trend Analysis ➞ | |
 | CMCM Cheetah Mobile Inc. |
| Sector: Technology | |
| SubSector: Application Software | |
| MarketCap: 343.362 Millions | |
| Recent Price: 3.97 Smart Investing & Trading Score : 51 | |
| Day Percent Change: -0.25% Day Change: -0.01 | |
| Week Change: -6.81% Year-to-date Change: 74.1% | |
| CMCM Links: Profile News Message Board | |
| Charts:- Daily , Weekly | |
| Add CMCM to Watchlist: View: Get Complete CMCM Trend Analysis ➞ | |
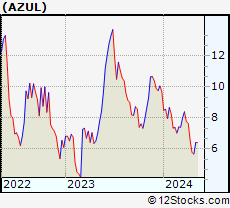 | AZUL Azul S.A. |
| Sector: Transports | |
| SubSector: Major Airlines | |
| MarketCap: 1289.85 Millions | |
| Recent Price: 6.42 Smart Investing & Trading Score : 49 | |
| Day Percent Change: 8.63% Day Change: 0.51 | |
| Week Change: 13.03% Year-to-date Change: -33.8% | |
| AZUL Links: Profile News Message Board | |
| Charts:- Daily , Weekly | |
| Add AZUL to Watchlist: View: Get Complete AZUL Trend Analysis ➞ | |
 | XP XP Inc. |
| Sector: Financials | |
| SubSector: Asset Management | |
| MarketCap: 12990.3 Millions | |
| Recent Price: 22.39 Smart Investing & Trading Score : 49 | |
| Day Percent Change: 5.96% Day Change: 1.26 | |
| Week Change: 6.32% Year-to-date Change: -14.1% | |
| XP Links: Profile News Message Board | |
| Charts:- Daily , Weekly | |
| Add XP to Watchlist: View: Get Complete XP Trend Analysis ➞ | |
 | GGB Gerdau S.A. |
| Sector: Materials | |
| SubSector: Steel & Iron | |
| MarketCap: 3607.48 Millions | |
| Recent Price: 3.80 Smart Investing & Trading Score : 49 | |
| Day Percent Change: 5.26% Day Change: 0.19 | |
| Week Change: 5.26% Year-to-date Change: -21.7% | |
| GGB Links: Profile News Message Board | |
| Charts:- Daily , Weekly | |
| Add GGB to Watchlist: View: Get Complete GGB Trend Analysis ➞ | |
 | INTR Inter & Co, Inc. |
| Sector: Financials | |
| SubSector: Banks - Regional | |
| MarketCap: 1250 Millions | |
| Recent Price: 5.32 Smart Investing & Trading Score : 49 | |
| Day Percent Change: 4.01% Day Change: 0.21 | |
| Week Change: 2.21% Year-to-date Change: -5.2% | |
| INTR Links: Profile News Message Board | |
| Charts:- Daily , Weekly | |
| Add INTR to Watchlist: View: Get Complete INTR Trend Analysis ➞ | |
 | EBON Ebang International Holdings Inc. |
| Sector: Technology | |
| SubSector: Computer Hardware | |
| MarketCap: 33787 Millions | |
| Recent Price: 7.99 Smart Investing & Trading Score : 49 | |
| Day Percent Change: 2.96% Day Change: 0.23 | |
| Week Change: 2.37% Year-to-date Change: -47.7% | |
| EBON Links: Profile News Message Board | |
| Charts:- Daily , Weekly | |
| Add EBON to Watchlist: View: Get Complete EBON Trend Analysis ➞ | |
 | BBDO Banco Bradesco S.A. |
| Sector: Financials | |
| SubSector: Foreign Regional Banks | |
| MarketCap: 27711.4 Millions | |
| Recent Price: 2.43 Smart Investing & Trading Score : 49 | |
| Day Percent Change: 2.10% Day Change: 0.05 | |
| Week Change: 2.53% Year-to-date Change: -23.6% | |
| BBDO Links: Profile News Message Board | |
| Charts:- Daily , Weekly | |
| Add BBDO to Watchlist: View: Get Complete BBDO Trend Analysis ➞ | |
 | ITUB Itau Unibanco Holding S.A. |
| Sector: Financials | |
| SubSector: Foreign Regional Banks | |
| MarketCap: 48121 Millions | |
| Recent Price: 6.34 Smart Investing & Trading Score : 49 | |
| Day Percent Change: 1.44% Day Change: 0.09 | |
| Week Change: 0.63% Year-to-date Change: -8.8% | |
| ITUB Links: Profile News Message Board | |
| Charts:- Daily , Weekly | |
| Add ITUB to Watchlist: View: Get Complete ITUB Trend Analysis ➞ | |
 | FINV FinVolution Group |
| Sector: Financials | |
| SubSector: Credit Services | |
| MarketCap: 476.208 Millions | |
| Recent Price: 5.01 Smart Investing & Trading Score : 49 | |
| Day Percent Change: -0.40% Day Change: -0.02 | |
| Week Change: 2.45% Year-to-date Change: 2.2% | |
| FINV Links: Profile News Message Board | |
| Charts:- Daily , Weekly | |
| Add FINV to Watchlist: View: Get Complete FINV Trend Analysis ➞ | |
 | CSAN Cosan S.A. |
| Sector: Energy | |
| SubSector: Oil & Gas Refining & Marketing | |
| MarketCap: 6890 Millions | |
| Recent Price: 11.56 Smart Investing & Trading Score : 49 | |
| Day Percent Change: -0.26% Day Change: -0.03 | |
| Week Change: 1.14% Year-to-date Change: -26.6% | |
| CSAN Links: Profile News Message Board | |
| Charts:- Daily , Weekly | |
| Add CSAN to Watchlist: View: Get Complete CSAN Trend Analysis ➞ | |
 | HMY Harmony Gold Mining Company Limited |
| Sector: Materials | |
| SubSector: Gold | |
| MarketCap: 1371.69 Millions | |
| Recent Price: 8.57 Smart Investing & Trading Score : 48 | |
| Day Percent Change: 1.18% Day Change: 0.10 | |
| Week Change: -4.46% Year-to-date Change: 39.4% | |
| HMY Links: Profile News Message Board | |
| Charts:- Daily , Weekly | |
| Add HMY to Watchlist: View: Get Complete HMY Trend Analysis ➞ | |
 | CLEU China Liberal Education Holdings Limited |
| Sector: Consumer Staples | |
| SubSector: Education & Training Services | |
| MarketCap: 32347 Millions | |
| Recent Price: 1.10 Smart Investing & Trading Score : 45 | |
| Day Percent Change: 4.76% Day Change: 0.05 | |
| Week Change: 1.85% Year-to-date Change: 515.2% | |
| CLEU Links: Profile News Message Board | |
| Charts:- Daily , Weekly | |
| Add CLEU to Watchlist: View: Get Complete CLEU Trend Analysis ➞ | |
 | SMI Semiconductor Manufacturing International Corporation |
| Sector: Technology | |
| SubSector: Semiconductor - Integrated Circuits | |
| MarketCap: 6287.56 Millions | |
| Recent Price: 45.68 Smart Investing & Trading Score : 43 | |
| Day Percent Change: 0.15% Day Change: 0.07 | |
| Week Change: 0.22% Year-to-date Change: -1.7% | |
| SMI Links: Profile News Message Board | |
| Charts:- Daily , Weekly | |
| Add SMI to Watchlist: View: Get Complete SMI Trend Analysis ➞ | |
 | ICG Intchains Group Limited |
| Sector: Technology | |
| SubSector: Semiconductors | |
| MarketCap: 450 Millions | |
| Recent Price: 7.99 Smart Investing & Trading Score : 42 | |
| Day Percent Change: 4.99% Day Change: 0.38 | |
| Week Change: -8.58% Year-to-date Change: -35.0% | |
| ICG Links: Profile News Message Board | |
| Charts:- Daily , Weekly | |
| Add ICG to Watchlist: View: Get Complete ICG Trend Analysis ➞ | |
 | LVRO Lavoro Limited |
| Sector: Materials | |
| SubSector: Agricultural Inputs | |
| MarketCap: 686 Millions | |
| Recent Price: 6.00 Smart Investing & Trading Score : 42 | |
| Day Percent Change: 3.63% Day Change: 0.21 | |
| Week Change: 2.48% Year-to-date Change: -32.4% | |
| LVRO Links: Profile News Message Board | |
| Charts:- Daily , Weekly | |
| Add LVRO to Watchlist: View: Get Complete LVRO Trend Analysis ➞ | |
 | INFY Infosys Limited |
| Sector: Technology | |
| SubSector: Information Technology Services | |
| MarketCap: 33819.1 Millions | |
| Recent Price: 16.93 Smart Investing & Trading Score : 42 | |
| Day Percent Change: 0.36% Day Change: 0.06 | |
| Week Change: -0.06% Year-to-date Change: -7.9% | |
| INFY Links: Profile News Message Board | |
| Charts:- Daily , Weekly | |
| Add INFY to Watchlist: View: Get Complete INFY Trend Analysis ➞ | |
 | FANH Fanhua Inc. |
| Sector: Financials | |
| SubSector: Insurance Brokers | |
| MarketCap: 1436.67 Millions | |
| Recent Price: 3.43 Smart Investing & Trading Score : 42 | |
| Day Percent Change: 0.29% Day Change: 0.01 | |
| Week Change: 0.29% Year-to-date Change: -48.4% | |
| FANH Links: Profile News Message Board | |
| Charts:- Daily , Weekly | |
| Add FANH to Watchlist: View: Get Complete FANH Trend Analysis ➞ | |
 | LI Li Auto Inc. |
| Sector: Services & Goods | |
| SubSector: Auto Manufacturers | |
| MarketCap: 29167 Millions | |
| Recent Price: 27.99 Smart Investing & Trading Score : 42 | |
| Day Percent Change: -3.42% Day Change: -0.99 | |
| Week Change: 11.78% Year-to-date Change: -25.2% | |
| LI Links: Profile News Message Board | |
| Charts:- Daily , Weekly | |
| Add LI to Watchlist: View: Get Complete LI Trend Analysis ➞ | |
 | ZH Zhihu Inc. |
| Sector: Services & Goods | |
| SubSector: Internet Content & Information | |
| MarketCap: 741 Millions | |
| Recent Price: 0.68 Smart Investing & Trading Score : 39 | |
| Day Percent Change: 2.11% Day Change: 0.01 | |
| Week Change: 2.64% Year-to-date Change: -28.4% | |
| ZH Links: Profile News Message Board | |
| Charts:- Daily , Weekly | |
| Add ZH to Watchlist: View: Get Complete ZH Trend Analysis ➞ | |
 | BBD Banco Bradesco S.A. |
| Sector: Financials | |
| SubSector: Foreign Regional Banks | |
| MarketCap: 30281.7 Millions | |
| Recent Price: 2.72 Smart Investing & Trading Score : 39 | |
| Day Percent Change: 0.00% Day Change: 0.00 | |
| Week Change: 0% Year-to-date Change: -22.3% | |
| BBD Links: Profile News Message Board | |
| Charts:- Daily , Weekly | |
| Add BBD to Watchlist: View: Get Complete BBD Trend Analysis ➞ | |
 | PBR Petroleo Brasileiro S.A. - Petrobras |
| Sector: Energy | |
| SubSector: Oil & Gas Drilling & Exploration | |
| MarketCap: 38939.2 Millions | |
| Recent Price: 16.43 Smart Investing & Trading Score : 38 | |
| Day Percent Change: -5.25% Day Change: -0.91 | |
| Week Change: -3.64% Year-to-date Change: 2.9% | |
| PBR Links: Profile News Message Board | |
| Charts:- Daily , Weekly | |
| Add PBR to Watchlist: View: Get Complete PBR Trend Analysis ➞ | |
| For tabular summary view of above stock list: Summary View ➞ 0 - 25 , 25 - 50 , 50 - 75 , 75 - 100 , 100 - 125 , 125 - 150 , 150 - 175 , 175 - 200 | ||
| Click To Change The Sort Order: By Market Cap or Company Size Performance: Year-to-date, Week and Day | |
| Select Chart Type: | ||
|
Best Stocks Today 12Stocks.com |
© 2024 12Stocks.com Terms & Conditions Privacy Contact Us
All Information Provided Only For Education And Not To Be Used For Investing or Trading. See Terms & Conditions


One More Thing ... Get Best Stocks Delivered Daily!
Never Ever Miss A Move With Our Top Ten Stocks Lists
Find Best Stocks In Any Market - Bull or Bear Market
Take A Peek At Our Top Ten Stocks Lists: Daily, Weekly, Year-to-Date & Top Trends
Find Best Stocks In Any Market - Bull or Bear Market
Take A Peek At Our Top Ten Stocks Lists: Daily, Weekly, Year-to-Date & Top Trends
Emerging Markets Stocks With Best Up Trends [0-bearish to 100-bullish]: SunCar [100], Hesai [100], Trip.com [100], Noah [100], Weibo [100], United Microelectronics[100], KE [100], Tencent Music[100], Huazhu [100], BrasilAgro -[100], America Movil[100]
Best Emerging Markets Stocks Year-to-Date:
U Power[3264.96%], DouYu [854.74%], MicroCloud Hologram[553.24%], China Liberal[515.21%], Yatsen Holding[493.22%], Zhongchao [338.24%], Uxin [188.16%], GigaCloud [97.11%], QuantaSing [95.06%], Cheetah Mobile[74.12%], Smart Share[68.93%] Best Emerging Markets Stocks This Week:
Smart Share[40.05%], Dingdong (Cayman)[24.6%], NIO [24.05%], OneConnect Financial[21%], 21Vianet [20.89%], KE [17.8%], U Power[17.77%], Hesai [17.05%], Lixiang Education[16.68%], AMTD Digital[16.36%], XPeng [15.56%] Best Emerging Markets Stocks Daily:
OneConnect Financial[12.04%], U Power[9.44%], SunCar [9.43%], Azul S.A[8.63%], AMTD Digital[8.33%], Burning Rock[6.51%], Nu [6.13%], Grupo Televisa[6.02%], XP [5.96%], Dingdong (Cayman)[5.72%], Studio City[5.54%]