
 Login Sign Up


| |||||
 |  | ||||

| 12Stocks.com Market Intelligence |
Best Emerging Markets Stocks
| In a hurry? Emerging Markets Stocks Lists: Trends Table, Stock Charts
Sort Emerging Markets stocks: Daily, Weekly, Year-to-Date, Market Cap & Trends. Filter Emerging Markets stocks list by sector: Show all, Tech, Finance, Energy, Staples, Retail, Industrial, Materials, Utilities and HealthCare Filter Emerging Markets stocks list by size:All Large Medium Small |
| 12Stocks.com Emerging Markets Stocks Performances & Trends Daily | |||||||||
|
|  The overall Smart Investing & Trading Score is 93 (0-bearish to 100-bullish) which puts Emerging Markets index in short term bullish trend. The Smart Investing & Trading Score from previous trading session is 100 and hence a deterioration of trend.
| ||||||||
Here are the Smart Investing & Trading Scores of the most requested Emerging Markets stocks at 12Stocks.com (click stock name for detailed review):
|


| 12Stocks.com: Top Performing Emerging Markets Index Stocks | ||||||||||||||||||||||||||||||||||||||||||||||||
 The top performing Emerging Markets Index stocks year to date are
Now, more recently, over last week, the top performing Emerging Markets Index stocks on the move are


|
||||||||||||||||||||||||||||||||||||||||||||||||
| 12Stocks.com: Investing in Emerging Markets Index with Stocks | |
|
The following table helps investors and traders sort through current performance and trends (as measured by Smart Investing & Trading Score ) of various
stocks in the Emerging Markets Index. Quick View: Move mouse or cursor over stock symbol (ticker) to view short-term technical chart and over stock name to view long term chart. Click on  to add stock symbol to your watchlist and to add stock symbol to your watchlist and  to view watchlist. Click on any ticker or stock name for detailed market intelligence report for that stock. to view watchlist. Click on any ticker or stock name for detailed market intelligence report for that stock. |
12Stocks.com Performance of Stocks in Emerging Markets Index
| Ticker | Stock Name | Watchlist | Category | Recent Price | Smart Investing & Trading Score | Change % | YTD Change% |
| TWN | Taiwan Fund |   | Financials | 38.75 | 58 | -0.90% | 12.03% |
| VIOT | Viomi | | Technology | 0.71 | 57 | 3.58% | -29.45% |
| DDL | Dingdong (Cayman) | | Consumer Staples | 1.37 | 57 | 2.24% | -9.87% |
| BQ | Boqii Holding | | Services & Goods | 0.29 | 57 | 0.72% | -35.50% |
| AFYA | Afya | | Services & Goods | 17.25 | 57 | -3.74% | -21.34% |
| ZLAB | Zai Lab | | Health Care | 15.85 | 57 | -1.67% | -42.01% |
| HOLO | MicroCloud Hologram | | Technology | 2.50 | 56 | 2.04% | 619.42% |
| YSG | Yatsen Holding | | Services & Goods | 4.37 | 56 | -2.67% | 497.32% |
| YY | JOYY | | Technology | 32.60 | 56 | -2.60% | -17.88% |
| PBR | Petroleo Brasileiro | | Energy | 16.97 | 55 | -2.08% | 6.26% |
| QFIN | 360 Finance | | Financials | 18.29 | 54 | -1.45% | 15.61% |
| BRFS | BRF S.A | | Consumer Staples | 3.29 | 53 | -3.24% | 18.35% |
| API | Agora | | Technology | 2.48 | 52 | -2.17% | -5.87% |
| AMBI | Ambipar Emergency | | Industrials | 4.30 | 52 | -1.15% | -45.29% |
| CMCM | Cheetah Mobile | | Technology | 3.91 | 51 | -3.22% | 71.49% |
| LU | Lufax Holding | | Financials | 4.39 | 51 | -3.09% | 43.00% |
| INTR | Inter & Co | | Financials | 5.01 | 51 | -2.91% | -10.62% |
| TUYA | Tuya | | Technology | 1.75 | 50 | 1.16% | -23.75% |
| VTMX | Vesta Financials | | Financials | 35.51 | 50 | -3.14% | -10.70% |
| QSG | QuantaSing | | Consumer Staples | 3.01 | 50 | -11.21% | 85.80% |
| XYF | X Financial | | Financials | 3.86 | 50 | -1.03% | 5.46% |
| STNE | StoneCo | | Technology | 15.60 | 50 | -3.64% | -13.48% |
| PAGS | PagSeguro Digital | | Financials | 12.45 | 50 | -1.58% | -0.16% |
| OCFT | OneConnect Financial | | Technology | 2.03 | 49 | 5.18% | -35.56% |
| HUIZ | Huize Holding | | Financials | 0.62 | 49 | 0.13% | -31.01% |
| For chart view version of above stock list: Chart View ➞ 0 - 25 , 25 - 50 , 50 - 75 , 75 - 100 , 100 - 125 , 125 - 150 , 150 - 175 , 175 - 200 | ||
 | Click To Change The Sort Order: By Market Cap or Company Size Performance: Year-to-date, Week and Day |  |
|
Get the most comprehensive stock market coverage daily at 12Stocks.com ➞ Best Stocks Today ➞ Best Stocks Weekly ➞ Best Stocks Year-to-Date ➞ Best Stocks Trends ➞  Best Stocks Today 12Stocks.com Best Nasdaq Stocks ➞ Best S&P 500 Stocks ➞ Best Tech Stocks ➞ Best Biotech Stocks ➞ |
| Detailed Overview of Emerging Markets Stocks |
| Emerging Markets Technical Overview, Leaders & Laggards, Top Emerging Markets ETF Funds & Detailed Emerging Markets Stocks List, Charts, Trends & More |
| Emerging Markets: Technical Analysis, Trends & YTD Performance | |
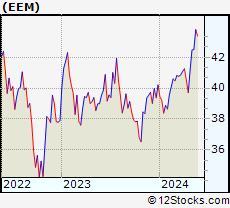
 EEM Weekly Chart |
|
| Long Term Trend: Very Good | |
| Medium Term Trend: Very Good | |
 EEM Daily Chart |
|
| Short Term Trend: Very Good | |
| Overall Trend Score: 93 | |
| YTD Performance: 1.94% | |
| **Trend Scores & Views Are Only For Educational Purposes And Not For Investing | |
| 12Stocks.com: Investing in Emerging Markets Index using Exchange Traded Funds | |
|
The following table shows list of key exchange traded funds (ETF) that
help investors play Emerging Markets stock market. For detailed view, check out our ETF Funds section of our website. Quick View: Move mouse or cursor over ETF symbol (ticker) to view short-term technical chart and over ETF name to view long term chart. Click on ticker or stock name for detailed view. Click on to add stock symbol to your watchlist and to view watchlist. |
12Stocks.com List of ETFs that track Emerging Markets Index
| Ticker | ETF Name | Watchlist | Recent Price | Smart Investing & Trading Score | Change % | Week % | Year-to-date % |
| EEM | Emerging Markets | | 40.99 | 93 | -1.40 | -0.44 | 1.94% |
| VWO | Emerging Markets | | 42.17 | 88 | -1.33 | -0.35 | 2.6% |
| SCHE | Emerging Markets Equity | | 25.46 | 93 | -1.39 | -0.43 | 2.7% |
| EWX | Emerging Markets Small | | 56.80 | 93 | -0.65 | 0.3 | 0.6% |
| EET | Emerging Markets | | 50.72 | 93 | -2.80 | -1.01 | -0.28% |
| EDC | Emrg Mkts Bull | | 29.64 | 88 | -4.14 | -1.23 | -2.6% |
| EEV | Short Emerging | | 19.17 | 7 | 2.35 | -0.28 | -2.81% |
| EUM | Short Emerging | | 14.04 | 7 | 1.19 | 0.36 | -0.81% |
| EDIV | Emerging Markets Dividend | | 33.78 | 88 | -0.79 | 0.51 | 3.87% |
| EMIF | Emerging Markets Infrastructure | | 22.29 | 100 | 0.45 | 0.77 | 4.16% |
| CEW | Emerging Currency Strat | | 17.69 | 55 | -0.35 | 0.06 | -1.75% |
| EBND | Em Mkts Lcl | | 19.88 | 35 | -0.75 | -0.35 | -6.4% |
| EMCB | Emerging Markets Corp | | 63.80 | 45 | 0.09 | 0.13 | -0.16% |
| VWOB | Emerging Mkts Govt | | 62.25 | 55 | -0.74 | -0.24 | -2.35% |
| EEMA | Emerging Markets Asia | | 68.77 | 93 | -0.52 | 0.03 | 4.02% |
| EELV | Em Mkts Low | | 23.50 | 100 | -1.18 | 0.38 | -2.25% |
| DVYE | Emerging Markets Dividend | | 27.05 | 93 | -1.39 | 0.3 | 2.11% |
| SDEM | SuperDividend Em Mkts | | 25.62 | 76 | -0.95 | 0.39 | 3.32% |
| DBEM | Em Mkts Hdgd | | 23.94 | 93 | -0.75 | -0.08 | 3.77% |
| PCY | Emerging Markets Sov | | 19.66 | 32 | -1.11 | -0.41 | -4.66% |
| QEMM | Emerging Mkts StratcFacts | | 57.27 | 93 | -0.97 | -0.12 | 0.2% |
| 12Stocks.com: Charts, Trends, Fundamental Data and Performances of Emerging Markets Stocks | |
|
We now take in-depth look at all Emerging Markets stocks including charts, multi-period performances and overall trends (as measured by Smart Investing & Trading Score ). One can sort Emerging Markets stocks (click link to choose) by Daily, Weekly and by Year-to-Date performances. Also, one can sort by size of the company or by market capitalization. |
| Select Your Default Chart Type: | |||||
| |||||
| Click on stock symbol or name for detailed view. Click on to add stock symbol to your watchlist and to view watchlist. Quick View: Move mouse or cursor over "Daily" to quickly view daily technical stock chart and over "Weekly" to view weekly technical stock chart. | |||||

 | TWN The Taiwan Fund, Inc. |
| Sector: Financials | |
| SubSector: Closed-End Fund - Foreign | |
| MarketCap: 110.547 Millions | |
| Recent Price: 38.75 Smart Investing & Trading Score : 58 | |
| Day Percent Change: -0.90% Day Change: -0.35 | |
| Week Change: 1.01% Year-to-date Change: 12.0% | |
| TWN Links: Profile News Message Board | |
| Charts:- Daily , Weekly | |
| Add TWN to Watchlist: View: Get Complete TWN Trend Analysis ➞ | |
 | VIOT Viomi Technology Co., Ltd |
| Sector: Technology | |
| SubSector: Electronic Equipment | |
| MarketCap: 357.2 Millions | |
| Recent Price: 0.71 Smart Investing & Trading Score : 57 | |
| Day Percent Change: 3.58% Day Change: 0.02 | |
| Week Change: 15.66% Year-to-date Change: -29.5% | |
| VIOT Links: Profile News Message Board | |
| Charts:- Daily , Weekly | |
| Add VIOT to Watchlist: View: Get Complete VIOT Trend Analysis ➞ | |
 | DDL Dingdong (Cayman) Limited |
| Sector: Consumer Staples | |
| SubSector: Grocery Stores | |
| MarketCap: 708 Millions | |
| Recent Price: 1.37 Smart Investing & Trading Score : 57 | |
| Day Percent Change: 2.24% Day Change: 0.03 | |
| Week Change: 8.73% Year-to-date Change: -9.9% | |
| DDL Links: Profile News Message Board | |
| Charts:- Daily , Weekly | |
| Add DDL to Watchlist: View: Get Complete DDL Trend Analysis ➞ | |
 | BQ Boqii Holding Limited |
| Sector: Services & Goods | |
| SubSector: Specialty Retail | |
| MarketCap: 33027 Millions | |
| Recent Price: 0.29 Smart Investing & Trading Score : 57 | |
| Day Percent Change: 0.72% Day Change: 0.00 | |
| Week Change: -3.56% Year-to-date Change: -35.5% | |
| BQ Links: Profile News Message Board | |
| Charts:- Daily , Weekly | |
| Add BQ to Watchlist: View: Get Complete BQ Trend Analysis ➞ | |
 | AFYA Afya Limited |
| Sector: Services & Goods | |
| SubSector: Education & Training Services | |
| MarketCap: 1559.26 Millions | |
| Recent Price: 17.25 Smart Investing & Trading Score : 57 | |
| Day Percent Change: -3.74% Day Change: -0.67 | |
| Week Change: -3.85% Year-to-date Change: -21.3% | |
| AFYA Links: Profile News Message Board | |
| Charts:- Daily , Weekly | |
| Add AFYA to Watchlist: View: Get Complete AFYA Trend Analysis ➞ | |
 | ZLAB Zai Lab Limited |
| Sector: Health Care | |
| SubSector: Biotechnology | |
| MarketCap: 3970.35 Millions | |
| Recent Price: 15.85 Smart Investing & Trading Score : 57 | |
| Day Percent Change: -1.67% Day Change: -0.27 | |
| Week Change: -0.38% Year-to-date Change: -42.0% | |
| ZLAB Links: Profile News Message Board | |
| Charts:- Daily , Weekly | |
| Add ZLAB to Watchlist: View: Get Complete ZLAB Trend Analysis ➞ | |
 | HOLO MicroCloud Hologram Inc. |
| Sector: Technology | |
| SubSector: Electronic Components | |
| MarketCap: 159 Millions | |
| Recent Price: 2.50 Smart Investing & Trading Score : 56 | |
| Day Percent Change: 2.04% Day Change: 0.05 | |
| Week Change: 0% Year-to-date Change: 619.4% | |
| HOLO Links: Profile News Message Board | |
| Charts:- Daily , Weekly | |
| Add HOLO to Watchlist: View: Get Complete HOLO Trend Analysis ➞ | |
 | YSG Yatsen Holding Limited |
| Sector: Services & Goods | |
| SubSector: Specialty Retail | |
| MarketCap: 11827 Millions | |
| Recent Price: 4.37 Smart Investing & Trading Score : 56 | |
| Day Percent Change: -2.67% Day Change: -0.12 | |
| Week Change: -9.71% Year-to-date Change: 497.3% | |
| YSG Links: Profile News Message Board | |
| Charts:- Daily , Weekly | |
| Add YSG to Watchlist: View: Get Complete YSG Trend Analysis ➞ | |
 | YY JOYY Inc. |
| Sector: Technology | |
| SubSector: Internet Information Providers | |
| MarketCap: 3527.6 Millions | |
| Recent Price: 32.60 Smart Investing & Trading Score : 56 | |
| Day Percent Change: -2.60% Day Change: -0.87 | |
| Week Change: -2.34% Year-to-date Change: -17.9% | |
| YY Links: Profile News Message Board | |
| Charts:- Daily , Weekly | |
| Add YY to Watchlist: View: Get Complete YY Trend Analysis ➞ | |
 | PBR Petroleo Brasileiro S.A. - Petrobras |
| Sector: Energy | |
| SubSector: Oil & Gas Drilling & Exploration | |
| MarketCap: 38939.2 Millions | |
| Recent Price: 16.97 Smart Investing & Trading Score : 55 | |
| Day Percent Change: -2.08% Day Change: -0.36 | |
| Week Change: -0.47% Year-to-date Change: 6.3% | |
| PBR Links: Profile News Message Board | |
| Charts:- Daily , Weekly | |
| Add PBR to Watchlist: View: Get Complete PBR Trend Analysis ➞ | |
 | QFIN 360 Finance, Inc. |
| Sector: Financials | |
| SubSector: Credit Services | |
| MarketCap: 956.208 Millions | |
| Recent Price: 18.29 Smart Investing & Trading Score : 54 | |
| Day Percent Change: -1.45% Day Change: -0.27 | |
| Week Change: -1.24% Year-to-date Change: 15.6% | |
| QFIN Links: Profile News Message Board | |
| Charts:- Daily , Weekly | |
| Add QFIN to Watchlist: View: Get Complete QFIN Trend Analysis ➞ | |
 | BRFS BRF S.A. |
| Sector: Consumer Staples | |
| SubSector: Meat Products | |
| MarketCap: 2635.51 Millions | |
| Recent Price: 3.29 Smart Investing & Trading Score : 53 | |
| Day Percent Change: -3.24% Day Change: -0.11 | |
| Week Change: -4.64% Year-to-date Change: 18.4% | |
| BRFS Links: Profile News Message Board | |
| Charts:- Daily , Weekly | |
| Add BRFS to Watchlist: View: Get Complete BRFS Trend Analysis ➞ | |
 | API Agora, Inc. |
| Sector: Technology | |
| SubSector: Software Application | |
| MarketCap: 42787 Millions | |
| Recent Price: 2.48 Smart Investing & Trading Score : 52 | |
| Day Percent Change: -2.17% Day Change: -0.06 | |
| Week Change: -1.39% Year-to-date Change: -5.9% | |
| API Links: Profile News Message Board | |
| Charts:- Daily , Weekly | |
| Add API to Watchlist: View: Get Complete API Trend Analysis ➞ | |
 | AMBI Ambipar Emergency Response |
| Sector: Industrials | |
| SubSector: Waste Management | |
| MarketCap: 462 Millions | |
| Recent Price: 4.30 Smart Investing & Trading Score : 52 | |
| Day Percent Change: -1.15% Day Change: -0.05 | |
| Week Change: 0% Year-to-date Change: -45.3% | |
| AMBI Links: Profile News Message Board | |
| Charts:- Daily , Weekly | |
| Add AMBI to Watchlist: View: Get Complete AMBI Trend Analysis ➞ | |
 | CMCM Cheetah Mobile Inc. |
| Sector: Technology | |
| SubSector: Application Software | |
| MarketCap: 343.362 Millions | |
| Recent Price: 3.91 Smart Investing & Trading Score : 51 | |
| Day Percent Change: -3.22% Day Change: -0.13 | |
| Week Change: -8.22% Year-to-date Change: 71.5% | |
| CMCM Links: Profile News Message Board | |
| Charts:- Daily , Weekly | |
| Add CMCM to Watchlist: View: Get Complete CMCM Trend Analysis ➞ | |
 | LU Lufax Holding Ltd |
| Sector: Financials | |
| SubSector: Credit Services | |
| MarketCap: 33457 Millions | |
| Recent Price: 4.39 Smart Investing & Trading Score : 51 | |
| Day Percent Change: -3.09% Day Change: -0.14 | |
| Week Change: -6.2% Year-to-date Change: 43.0% | |
| LU Links: Profile News Message Board | |
| Charts:- Daily , Weekly | |
| Add LU to Watchlist: View: Get Complete LU Trend Analysis ➞ | |
 | INTR Inter & Co, Inc. |
| Sector: Financials | |
| SubSector: Banks - Regional | |
| MarketCap: 1250 Millions | |
| Recent Price: 5.01 Smart Investing & Trading Score : 51 | |
| Day Percent Change: -2.91% Day Change: -0.15 | |
| Week Change: -3.65% Year-to-date Change: -10.6% | |
| INTR Links: Profile News Message Board | |
| Charts:- Daily , Weekly | |
| Add INTR to Watchlist: View: Get Complete INTR Trend Analysis ➞ | |
 | TUYA Tuya Inc. |
| Sector: Technology | |
| SubSector: Software - Infrastructure | |
| MarketCap: 1050 Millions | |
| Recent Price: 1.75 Smart Investing & Trading Score : 50 | |
| Day Percent Change: 1.16% Day Change: 0.02 | |
| Week Change: 0.57% Year-to-date Change: -23.8% | |
| TUYA Links: Profile News Message Board | |
| Charts:- Daily , Weekly | |
| Add TUYA to Watchlist: View: Get Complete TUYA Trend Analysis ➞ | |
 | VTMX Vesta Financials Corp SAB de CV |
| Sector: Financials | |
| SubSector: REIT - Industrial | |
| MarketCap: 2270 Millions | |
| Recent Price: 35.51 Smart Investing & Trading Score : 50 | |
| Day Percent Change: -3.14% Day Change: -1.15 | |
| Week Change: -1.93% Year-to-date Change: -10.7% | |
| VTMX Links: Profile News Message Board | |
| Charts:- Daily , Weekly | |
| Add VTMX to Watchlist: View: Get Complete VTMX Trend Analysis ➞ | |
 | QSG QuantaSing Group Limited |
| Sector: Consumer Staples | |
| SubSector: Education & Training Services | |
| MarketCap: 433 Millions | |
| Recent Price: 3.01 Smart Investing & Trading Score : 50 | |
| Day Percent Change: -11.21% Day Change: -0.38 | |
| Week Change: -12.24% Year-to-date Change: 85.8% | |
| QSG Links: Profile News Message Board | |
| Charts:- Daily , Weekly | |
| Add QSG to Watchlist: View: Get Complete QSG Trend Analysis ➞ | |
 | XYF X Financial |
| Sector: Financials | |
| SubSector: Credit Services | |
| MarketCap: 168.008 Millions | |
| Recent Price: 3.86 Smart Investing & Trading Score : 50 | |
| Day Percent Change: -1.03% Day Change: -0.04 | |
| Week Change: 0.36% Year-to-date Change: 5.5% | |
| XYF Links: Profile News Message Board | |
| Charts:- Daily , Weekly | |
| Add XYF to Watchlist: View: Get Complete XYF Trend Analysis ➞ | |
 | STNE StoneCo Ltd. |
| Sector: Technology | |
| SubSector: Application Software | |
| MarketCap: 7347.82 Millions | |
| Recent Price: 15.60 Smart Investing & Trading Score : 50 | |
| Day Percent Change: -3.64% Day Change: -0.59 | |
| Week Change: -4.59% Year-to-date Change: -13.5% | |
| STNE Links: Profile News Message Board | |
| Charts:- Daily , Weekly | |
| Add STNE to Watchlist: View: Get Complete STNE Trend Analysis ➞ | |
 | PAGS PagSeguro Digital Ltd. |
| Sector: Financials | |
| SubSector: Credit Services | |
| MarketCap: 6500.78 Millions | |
| Recent Price: 12.45 Smart Investing & Trading Score : 50 | |
| Day Percent Change: -1.58% Day Change: -0.20 | |
| Week Change: -1.81% Year-to-date Change: -0.2% | |
| PAGS Links: Profile News Message Board | |
| Charts:- Daily , Weekly | |
| Add PAGS to Watchlist: View: Get Complete PAGS Trend Analysis ➞ | |
 | OCFT OneConnect Financial Technology Co., Ltd. |
| Sector: Technology | |
| SubSector: Software Application | |
| MarketCap: 80387 Millions | |
| Recent Price: 2.03 Smart Investing & Trading Score : 49 | |
| Day Percent Change: 5.18% Day Change: 0.10 | |
| Week Change: 1.5% Year-to-date Change: -35.6% | |
| OCFT Links: Profile News Message Board | |
| Charts:- Daily , Weekly | |
| Add OCFT to Watchlist: View: Get Complete OCFT Trend Analysis ➞ | |
 | HUIZ Huize Holding Limited |
| Sector: Financials | |
| SubSector: Insurance Brokers | |
| MarketCap: 37157 Millions | |
| Recent Price: 0.62 Smart Investing & Trading Score : 49 | |
| Day Percent Change: 0.13% Day Change: 0.00 | |
| Week Change: 0.96% Year-to-date Change: -31.0% | |
| HUIZ Links: Profile News Message Board | |
| Charts:- Daily , Weekly | |
| Add HUIZ to Watchlist: View: Get Complete HUIZ Trend Analysis ➞ | |
| For tabular summary view of above stock list: Summary View ➞ 0 - 25 , 25 - 50 , 50 - 75 , 75 - 100 , 100 - 125 , 125 - 150 , 150 - 175 , 175 - 200 | ||
| Click To Change The Sort Order: By Market Cap or Company Size Performance: Year-to-date, Week and Day | |
| Select Chart Type: | ||
|
Best Stocks Today 12Stocks.com |
© 2024 12Stocks.com Terms & Conditions Privacy Contact Us
All Information Provided Only For Education And Not To Be Used For Investing or Trading. See Terms & Conditions


One More Thing ... Get Best Stocks Delivered Daily!
Never Ever Miss A Move With Our Top Ten Stocks Lists
Find Best Stocks In Any Market - Bull or Bear Market
Take A Peek At Our Top Ten Stocks Lists: Daily, Weekly, Year-to-Date & Top Trends
Find Best Stocks In Any Market - Bull or Bear Market
Take A Peek At Our Top Ten Stocks Lists: Daily, Weekly, Year-to-Date & Top Trends
Emerging Markets Stocks With Best Up Trends [0-bearish to 100-bullish]: ATRenew [100], Grupo Aeroportuario[100], BeiGene [100], America Movil[100], GDS [100], Kanzhun [95], ICICI Bank[93], Niu [93], Hutchison China[93], Tencent Music[93], Weibo [93]
Best Emerging Markets Stocks Year-to-Date:
U Power[2902.23%], DouYu [803.68%], MicroCloud Hologram[619.42%], China Liberal[518.01%], Yatsen Holding[497.32%], Zhongchao [335.5%], Uxin [164.62%], QuantaSing [85.8%], GigaCloud [73.68%], Cheetah Mobile[71.49%], Yiren Digital[61.54%] Best Emerging Markets Stocks This Week:
Golden Heaven[22.32%], Lixiang Education[20.85%], Viomi [15.66%], Lanvin [13.92%], Smart Share[13.68%], uCloudlink [9.49%], MOGU [9.03%], Dingdong (Cayman)[8.73%], SunCar [8.68%], China Online[7.72%], 21Vianet [7.59%] Best Emerging Markets Stocks Daily:
Golden Heaven[25.95%], Lanvin [19.21%], Smart Share[10.33%], MOGU [10.22%], Sunlands [7.86%], China Online[6.43%], Ebang [5.79%], Yunji [5.43%], OneConnect Financial[5.18%], Cango [4.90%], Viomi [3.58%]