
 Login Sign Up


| |||||
 |  | ||||

| 12Stocks.com Market Intelligence |
Best Emerging Markets Stocks
| In a hurry? Emerging Markets Stocks Lists: Trends Table, Stock Charts
Sort Emerging Markets stocks: Daily, Weekly, Year-to-Date, Market Cap & Trends. Filter Emerging Markets stocks list by sector: Show all, Tech, Finance, Energy, Staples, Retail, Industrial, Materials, Utilities and HealthCare Filter Emerging Markets stocks list by size:All Large Medium Small |
| 12Stocks.com Emerging Markets Stocks Performances & Trends Daily | |||||||||
|
|  The overall Smart Investing & Trading Score is 100 (0-bearish to 100-bullish) which puts Emerging Markets index in short term bullish trend. The Smart Investing & Trading Score from previous trading session is 78 and an improvement of trend continues.
| ||||||||
Here are the Smart Investing & Trading Scores of the most requested Emerging Markets stocks at 12Stocks.com (click stock name for detailed review):
|


| 12Stocks.com: Top Performing Emerging Markets Index Stocks | ||||||||||||||||||||||||||||||||||||||||||||||||
 The top performing Emerging Markets Index stocks year to date are
Now, more recently, over last week, the top performing Emerging Markets Index stocks on the move are


|
||||||||||||||||||||||||||||||||||||||||||||||||
| 12Stocks.com: Investing in Emerging Markets Index with Stocks | |
|
The following table helps investors and traders sort through current performance and trends (as measured by Smart Investing & Trading Score ) of various
stocks in the Emerging Markets Index. Quick View: Move mouse or cursor over stock symbol (ticker) to view short-term technical chart and over stock name to view long term chart. Click on  to add stock symbol to your watchlist and to add stock symbol to your watchlist and  to view watchlist. Click on any ticker or stock name for detailed market intelligence report for that stock. to view watchlist. Click on any ticker or stock name for detailed market intelligence report for that stock. |
12Stocks.com Performance of Stocks in Emerging Markets Index
| Ticker | Stock Name | Watchlist | Category | Recent Price | Smart Investing & Trading Score | Change % | YTD Change% |
| ZH | Zhihu |   | Services & Goods | 0.68 | 39 | 2.11% | -28.36% |
| BBD | Banco Bradesco | | Financials | 2.72 | 39 | 0.00% | -22.29% |
| PBR | Petroleo Brasileiro | | Energy | 16.43 | 38 | -5.25% | 2.88% |
| LXEH | Lixiang Education | | Consumer Staples | 0.48 | 37 | 5.14% | -55.91% |
| DAO | Youdao | | Technology | 3.59 | 37 | 0.84% | -8.88% |
| GDHG | Golden Heaven | | Services & Goods | 0.33 | 37 | 0.00% | -55.21% |
| FMX | Fomento Economico | | Consumer Staples | 118.68 | 35 | 0.95% | -8.95% |
| AGMH | AGM | | Technology | 1.09 | 35 | 0.93% | -39.78% |
| YGMZ | MingZhu Logistics | | Industrials | 0.40 | 35 | 0.00% | -15.87% |
| AIXI | Xiao-I | | Technology | 1.25 | 35 | -6.02% | -44.44% |
| QSG | QuantaSing | | Consumer Staples | 3.16 | 35 | -3.07% | 95.06% |
| SSL | Sasol | | Energy | 7.05 | 35 | 4.60% | -29.07% |
| VTRU | Vitru | | Consumer Staples | 12.33 | 35 | 0.00% | -22.06% |
| GGR | Gogoro | | Services & Goods | 1.54 | 34 | 1.32% | -40.77% |
| EDU | New Oriental | | Services & Goods | 84.75 | 32 | 4.77% | 15.65% |
| GHG | GreenTree Hospitality | | Services & Goods | 3.13 | 32 | 2.29% | -16.76% |
| IH | iHuman | | Consumer Staples | 1.74 | 32 | 0.00% | -42.95% |
| XYF | X Financial | | Financials | 3.82 | 32 | -2.30% | 4.37% |
| HOLI | Hollysys Automation | | Industrials | 23.63 | 32 | -0.08% | -10.32% |
| SIFY | Sify | | Technology | 1.21 | 30 | -0.82% | -35.12% |
| BEDU | Bright Scholar | | Services & Goods | 1.91 | 27 | 0.53% | 52.80% |
| SVA | Sinovac Biotech | | Health Care | 6.47 | 27 | 0.00% | 0.00% |
| LANV | Lanvin | | Services & Goods | 1.60 | 27 | -3.61% | -47.71% |
| EDTK | Skillful Craftsman | | Consumer Staples | 0.92 | 26 | 0.00% | -27.38% |
| WIT | Wipro | | Technology | 5.40 | 24 | 0.56% | -3.05% |
| For chart view version of above stock list: Chart View ➞ 0 - 25 , 25 - 50 , 50 - 75 , 75 - 100 , 100 - 125 , 125 - 150 , 150 - 175 , 175 - 200 | ||
 | Click To Change The Sort Order: By Market Cap or Company Size Performance: Year-to-date, Week and Day |  |
|
Get the most comprehensive stock market coverage daily at 12Stocks.com ➞ Best Stocks Today ➞ Best Stocks Weekly ➞ Best Stocks Year-to-Date ➞ Best Stocks Trends ➞  Best Stocks Today 12Stocks.com Best Nasdaq Stocks ➞ Best S&P 500 Stocks ➞ Best Tech Stocks ➞ Best Biotech Stocks ➞ |
| Detailed Overview of Emerging Markets Stocks |
| Emerging Markets Technical Overview, Leaders & Laggards, Top Emerging Markets ETF Funds & Detailed Emerging Markets Stocks List, Charts, Trends & More |
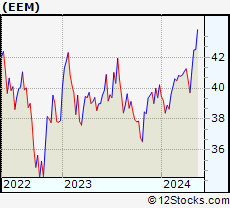
| Emerging Markets: Technical Analysis, Trends & YTD Performance | |
 EEM Weekly Chart |
|
| Long Term Trend: Very Good | |
| Medium Term Trend: Very Good | |
 EEM Daily Chart |
|
| Short Term Trend: Very Good | |
| Overall Trend Score: 100 | |
| YTD Performance: 5.62% | |
| **Trend Scores & Views Are Only For Educational Purposes And Not For Investing | |
| 12Stocks.com: Investing in Emerging Markets Index using Exchange Traded Funds | |
|
The following table shows list of key exchange traded funds (ETF) that
help investors play Emerging Markets stock market. For detailed view, check out our ETF Funds section of our website. Quick View: Move mouse or cursor over ETF symbol (ticker) to view short-term technical chart and over ETF name to view long term chart. Click on ticker or stock name for detailed view. Click on to add stock symbol to your watchlist and to view watchlist. |
12Stocks.com List of ETFs that track Emerging Markets Index
| Ticker | ETF Name | Watchlist | Recent Price | Smart Investing & Trading Score | Change % | Week % | Year-to-date % |
| EEM | Emerging Markets | | 42.47 | 100 | 0.90 | 3.16 | 5.62% |
| VWO | Emerging Markets | | 43.63 | 100 | 0.88 | 3.1 | 6.16% |
| SCHE | Emerging Markets Equity | | 26.35 | 80 | 0.73 | 3.05 | 6.29% |
| EWX | Emerging Markets Small | | 58.18 | 80 | 0.48 | 2.74 | 3.05% |
| EET | Emerging Markets | | 54.38 | 100 | 1.75 | 6.15 | 6.93% |
| EDC | Emrg Mkts Bull | | 32.85 | 100 | 2.82 | 9.46 | 7.95% |
| EEV | Short Emerging | | 18.10 | 18 | -0.39 | -5.85 | -8.23% |
| EUM | Short Emerging | | 13.57 | 0 | -0.84 | -3 | -4.13% |
| EDIV | Emerging Markets Dividend | | 34.42 | 75 | 0.00 | 2.41 | 5.84% |
| EMIF | Emerging Markets Infrastructure | | 22.44 | 100 | 1.77 | 1.45 | 4.86% |
| CEW | Emerging Currency Strat | | 17.88 | 90 | 0.56 | 1.13 | -0.69% |
| EBND | Em Mkts Lcl | | 20.20 | 22 | 0.75 | 1.25 | -4.9% |
| EMCB | Emerging Markets Corp | | 64.20 | 62 | 0.38 | 0.76 | 0.47% |
| VWOB | Emerging Mkts Govt | | 62.99 | 45 | 0.69 | 0.95 | -1.19% |
| EEMA | Emerging Markets Asia | | 71.10 | 80 | 1.08 | 3.42 | 7.55% |
| EELV | Em Mkts Low | | 24.10 | 67 | 0.67 | 2.95 | 0.25% |
| DVYE | Emerging Markets Dividend | | 27.95 | 80 | 1.12 | 3.63 | 5.51% |
| SDEM | SuperDividend Em Mkts | | 26.02 | 77 | 0.13 | 1.98 | 4.95% |
| DBEM | Em Mkts Hdgd | | 24.50 | 88 | 0.57 | 2.25 | 6.2% |
| PCY | Emerging Markets Sov | | 20.13 | 24 | 1.21 | 1.98 | -2.38% |
| QEMM | Emerging Mkts StratcFacts | | 58.78 | 88 | 0.62 | 2.51 | 2.84% |
| 12Stocks.com: Charts, Trends, Fundamental Data and Performances of Emerging Markets Stocks | |
|
We now take in-depth look at all Emerging Markets stocks including charts, multi-period performances and overall trends (as measured by Smart Investing & Trading Score ). One can sort Emerging Markets stocks (click link to choose) by Daily, Weekly and by Year-to-Date performances. Also, one can sort by size of the company or by market capitalization. |
| Select Your Default Chart Type: | |||||
| |||||
| Click on stock symbol or name for detailed view. Click on to add stock symbol to your watchlist and to view watchlist. Quick View: Move mouse or cursor over "Daily" to quickly view daily technical stock chart and over "Weekly" to view weekly technical stock chart. | |||||

 | ZH Zhihu Inc. |
| Sector: Services & Goods | |
| SubSector: Internet Content & Information | |
| MarketCap: 741 Millions | |
| Recent Price: 0.68 Smart Investing & Trading Score : 39 | |
| Day Percent Change: 2.11% Day Change: 0.01 | |
| Week Change: 2.64% Year-to-date Change: -28.4% | |
| ZH Links: Profile News Message Board | |
| Charts:- Daily , Weekly | |
| Add ZH to Watchlist: View: Get Complete ZH Trend Analysis ➞ | |
 | BBD Banco Bradesco S.A. |
| Sector: Financials | |
| SubSector: Foreign Regional Banks | |
| MarketCap: 30281.7 Millions | |
| Recent Price: 2.72 Smart Investing & Trading Score : 39 | |
| Day Percent Change: 0.00% Day Change: 0.00 | |
| Week Change: 0% Year-to-date Change: -22.3% | |
| BBD Links: Profile News Message Board | |
| Charts:- Daily , Weekly | |
| Add BBD to Watchlist: View: Get Complete BBD Trend Analysis ➞ | |
 | PBR Petroleo Brasileiro S.A. - Petrobras |
| Sector: Energy | |
| SubSector: Oil & Gas Drilling & Exploration | |
| MarketCap: 38939.2 Millions | |
| Recent Price: 16.43 Smart Investing & Trading Score : 38 | |
| Day Percent Change: -5.25% Day Change: -0.91 | |
| Week Change: -3.64% Year-to-date Change: 2.9% | |
| PBR Links: Profile News Message Board | |
| Charts:- Daily , Weekly | |
| Add PBR to Watchlist: View: Get Complete PBR Trend Analysis ➞ | |
 | LXEH Lixiang Education Holding Co., Ltd. |
| Sector: Consumer Staples | |
| SubSector: Education & Training Services | |
| MarketCap: 12347 Millions | |
| Recent Price: 0.48 Smart Investing & Trading Score : 37 | |
| Day Percent Change: 5.14% Day Change: 0.02 | |
| Week Change: 16.68% Year-to-date Change: -55.9% | |
| LXEH Links: Profile News Message Board | |
| Charts:- Daily , Weekly | |
| Add LXEH to Watchlist: View: Get Complete LXEH Trend Analysis ➞ | |
 | DAO Youdao, Inc. |
| Sector: Technology | |
| SubSector: Internet Information Providers | |
| MarketCap: 2073.2 Millions | |
| Recent Price: 3.59 Smart Investing & Trading Score : 37 | |
| Day Percent Change: 0.84% Day Change: 0.03 | |
| Week Change: 1.99% Year-to-date Change: -8.9% | |
| DAO Links: Profile News Message Board | |
| Charts:- Daily , Weekly | |
| Add DAO to Watchlist: View: Get Complete DAO Trend Analysis ➞ | |
 | GDHG Golden Heaven Group Holdings Ltd. |
| Sector: Services & Goods | |
| SubSector: Leisure | |
| MarketCap: 230 Millions | |
| Recent Price: 0.33 Smart Investing & Trading Score : 37 | |
| Day Percent Change: 0.00% Day Change: 0.00 | |
| Week Change: 15.1% Year-to-date Change: -55.2% | |
| GDHG Links: Profile News Message Board | |
| Charts:- Daily , Weekly | |
| Add GDHG to Watchlist: View: Get Complete GDHG Trend Analysis ➞ | |
 | FMX Fomento Economico Mexicano, S.A.B. de C.V. |
| Sector: Consumer Staples | |
| SubSector: Beverages - Brewers | |
| MarketCap: 22018.7 Millions | |
| Recent Price: 118.68 Smart Investing & Trading Score : 35 | |
| Day Percent Change: 0.95% Day Change: 1.12 | |
| Week Change: -0.21% Year-to-date Change: -9.0% | |
| FMX Links: Profile News Message Board | |
| Charts:- Daily , Weekly | |
| Add FMX to Watchlist: View: Get Complete FMX Trend Analysis ➞ | |
 | AGMH AGM Group Holdings Inc. |
| Sector: Technology | |
| SubSector: Application Software | |
| MarketCap: 320.362 Millions | |
| Recent Price: 1.09 Smart Investing & Trading Score : 35 | |
| Day Percent Change: 0.93% Day Change: 0.01 | |
| Week Change: 2.83% Year-to-date Change: -39.8% | |
| AGMH Links: Profile News Message Board | |
| Charts:- Daily , Weekly | |
| Add AGMH to Watchlist: View: Get Complete AGMH Trend Analysis ➞ | |
 | YGMZ MingZhu Logistics Holdings Limited |
| Sector: Industrials | |
| SubSector: Trucking | |
| MarketCap: 41627 Millions | |
| Recent Price: 0.40 Smart Investing & Trading Score : 35 | |
| Day Percent Change: 0.00% Day Change: 0.00 | |
| Week Change: -6.67% Year-to-date Change: -15.9% | |
| YGMZ Links: Profile News Message Board | |
| Charts:- Daily , Weekly | |
| Add YGMZ to Watchlist: View: Get Complete YGMZ Trend Analysis ➞ | |
 | AIXI Xiao-I Corporation |
| Sector: Technology | |
| SubSector: Software - Application | |
| MarketCap: 431 Millions | |
| Recent Price: 1.25 Smart Investing & Trading Score : 35 | |
| Day Percent Change: -6.02% Day Change: -0.08 | |
| Week Change: -2.34% Year-to-date Change: -44.4% | |
| AIXI Links: Profile News Message Board | |
| Charts:- Daily , Weekly | |
| Add AIXI to Watchlist: View: Get Complete AIXI Trend Analysis ➞ | |
 | QSG QuantaSing Group Limited |
| Sector: Consumer Staples | |
| SubSector: Education & Training Services | |
| MarketCap: 433 Millions | |
| Recent Price: 3.16 Smart Investing & Trading Score : 35 | |
| Day Percent Change: -3.07% Day Change: -0.10 | |
| Week Change: -7.87% Year-to-date Change: 95.1% | |
| QSG Links: Profile News Message Board | |
| Charts:- Daily , Weekly | |
| Add QSG to Watchlist: View: Get Complete QSG Trend Analysis ➞ | |
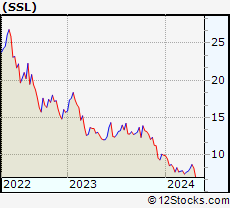 | SSL Sasol Limited |
| Sector: Energy | |
| SubSector: Major Integrated Oil & Gas | |
| MarketCap: 1233.85 Millions | |
| Recent Price: 7.05 Smart Investing & Trading Score : 35 | |
| Day Percent Change: 4.60% Day Change: 0.31 | |
| Week Change: 1.73% Year-to-date Change: -29.1% | |
| SSL Links: Profile News Message Board | |
| Charts:- Daily , Weekly | |
| Add SSL to Watchlist: View: Get Complete SSL Trend Analysis ➞ | |
 | VTRU Vitru Limited |
| Sector: Consumer Staples | |
| SubSector: Education & Training Services | |
| MarketCap: 33347 Millions | |
| Recent Price: 12.33 Smart Investing & Trading Score : 35 | |
| Day Percent Change: 0.00% Day Change: 0.00 | |
| Week Change: -5.15% Year-to-date Change: -22.1% | |
| VTRU Links: Profile News Message Board | |
| Charts:- Daily , Weekly | |
| Add VTRU to Watchlist: View: Get Complete VTRU Trend Analysis ➞ | |
 | GGR Gogoro Inc. |
| Sector: Services & Goods | |
| SubSector: Auto Parts | |
| MarketCap: 856 Millions | |
| Recent Price: 1.54 Smart Investing & Trading Score : 34 | |
| Day Percent Change: 1.32% Day Change: 0.02 | |
| Week Change: 0.65% Year-to-date Change: -40.8% | |
| GGR Links: Profile News Message Board | |
| Charts:- Daily , Weekly | |
| Add GGR to Watchlist: View: Get Complete GGR Trend Analysis ➞ | |
 | EDU New Oriental Education & Technology Group Inc. |
| Sector: Services & Goods | |
| SubSector: Education & Training Services | |
| MarketCap: 18673.7 Millions | |
| Recent Price: 84.75 Smart Investing & Trading Score : 32 | |
| Day Percent Change: 4.77% Day Change: 3.86 | |
| Week Change: 1.79% Year-to-date Change: 15.7% | |
| EDU Links: Profile News Message Board | |
| Charts:- Daily , Weekly | |
| Add EDU to Watchlist: View: Get Complete EDU Trend Analysis ➞ | |
 | GHG GreenTree Hospitality Group Ltd. |
| Sector: Services & Goods | |
| SubSector: Lodging | |
| MarketCap: 1195.36 Millions | |
| Recent Price: 3.13 Smart Investing & Trading Score : 32 | |
| Day Percent Change: 2.29% Day Change: 0.07 | |
| Week Change: 0.97% Year-to-date Change: -16.8% | |
| GHG Links: Profile News Message Board | |
| Charts:- Daily , Weekly | |
| Add GHG to Watchlist: View: Get Complete GHG Trend Analysis ➞ | |
 | IH iHuman Inc. |
| Sector: Consumer Staples | |
| SubSector: Education & Training Services | |
| MarketCap: 12247 Millions | |
| Recent Price: 1.74 Smart Investing & Trading Score : 32 | |
| Day Percent Change: 0.00% Day Change: 0.00 | |
| Week Change: 0% Year-to-date Change: -43.0% | |
| IH Links: Profile News Message Board | |
| Charts:- Daily , Weekly | |
| Add IH to Watchlist: View: Get Complete IH Trend Analysis ➞ | |
 | XYF X Financial |
| Sector: Financials | |
| SubSector: Credit Services | |
| MarketCap: 168.008 Millions | |
| Recent Price: 3.82 Smart Investing & Trading Score : 32 | |
| Day Percent Change: -2.30% Day Change: -0.09 | |
| Week Change: -0.68% Year-to-date Change: 4.4% | |
| XYF Links: Profile News Message Board | |
| Charts:- Daily , Weekly | |
| Add XYF to Watchlist: View: Get Complete XYF Trend Analysis ➞ | |
 | HOLI Hollysys Automation Technologies Ltd. |
| Sector: Industrials | |
| SubSector: Industrial Electrical Equipment | |
| MarketCap: 668.379 Millions | |
| Recent Price: 23.63 Smart Investing & Trading Score : 32 | |
| Day Percent Change: -0.08% Day Change: -0.02 | |
| Week Change: -3.75% Year-to-date Change: -10.3% | |
| HOLI Links: Profile News Message Board | |
| Charts:- Daily , Weekly | |
| Add HOLI to Watchlist: View: Get Complete HOLI Trend Analysis ➞ | |
 | SIFY Sify Technologies Limited |
| Sector: Technology | |
| SubSector: Internet Service Providers | |
| MarketCap: 159.38 Millions | |
| Recent Price: 1.21 Smart Investing & Trading Score : 30 | |
| Day Percent Change: -0.82% Day Change: -0.01 | |
| Week Change: 1.68% Year-to-date Change: -35.1% | |
| SIFY Links: Profile News Message Board | |
| Charts:- Daily , Weekly | |
| Add SIFY to Watchlist: View: Get Complete SIFY Trend Analysis ➞ | |
 | BEDU Bright Scholar Education Holdings Limited |
| Sector: Services & Goods | |
| SubSector: Education & Training Services | |
| MarketCap: 792.406 Millions | |
| Recent Price: 1.91 Smart Investing & Trading Score : 27 | |
| Day Percent Change: 0.53% Day Change: 0.01 | |
| Week Change: -1.29% Year-to-date Change: 52.8% | |
| BEDU Links: Profile News Message Board | |
| Charts:- Daily , Weekly | |
| Add BEDU to Watchlist: View: Get Complete BEDU Trend Analysis ➞ | |
 | SVA Sinovac Biotech Ltd. |
| Sector: Health Care | |
| SubSector: Biotechnology | |
| MarketCap: 336.88 Millions | |
| Recent Price: 6.47 Smart Investing & Trading Score : 27 | |
| Day Percent Change: 0.00% Day Change: 0.00 | |
| Week Change: 0% Year-to-date Change: 0.0% | |
| SVA Links: Profile News Message Board | |
| Charts:- Daily , Weekly | |
| Add SVA to Watchlist: View: Get Complete SVA Trend Analysis ➞ | |
 | LANV Lanvin Group Holdings Limited |
| Sector: Services & Goods | |
| SubSector: Luxury Goods | |
| MarketCap: 712 Millions | |
| Recent Price: 1.60 Smart Investing & Trading Score : 27 | |
| Day Percent Change: -3.61% Day Change: -0.06 | |
| Week Change: 1.27% Year-to-date Change: -47.7% | |
| LANV Links: Profile News Message Board | |
| Charts:- Daily , Weekly | |
| Add LANV to Watchlist: View: Get Complete LANV Trend Analysis ➞ | |
 | EDTK Skillful Craftsman Education Technology Limited |
| Sector: Consumer Staples | |
| SubSector: Education & Training Services | |
| MarketCap: 32347 Millions | |
| Recent Price: 0.92 Smart Investing & Trading Score : 26 | |
| Day Percent Change: 0.00% Day Change: 0.00 | |
| Week Change: -3.67% Year-to-date Change: -27.4% | |
| EDTK Links: Profile News Message Board | |
| Charts:- Daily , Weekly | |
| Add EDTK to Watchlist: View: Get Complete EDTK Trend Analysis ➞ | |
 | WIT Wipro Limited |
| Sector: Technology | |
| SubSector: Information Technology Services | |
| MarketCap: 15101.3 Millions | |
| Recent Price: 5.40 Smart Investing & Trading Score : 24 | |
| Day Percent Change: 0.56% Day Change: 0.03 | |
| Week Change: -1.1% Year-to-date Change: -3.1% | |
| WIT Links: Profile News Message Board | |
| Charts:- Daily , Weekly | |
| Add WIT to Watchlist: View: Get Complete WIT Trend Analysis ➞ | |
| For tabular summary view of above stock list: Summary View ➞ 0 - 25 , 25 - 50 , 50 - 75 , 75 - 100 , 100 - 125 , 125 - 150 , 150 - 175 , 175 - 200 | ||
| Click To Change The Sort Order: By Market Cap or Company Size Performance: Year-to-date, Week and Day | |
| Select Chart Type: | ||
|
Best Stocks Today 12Stocks.com |
© 2024 12Stocks.com Terms & Conditions Privacy Contact Us
All Information Provided Only For Education And Not To Be Used For Investing or Trading. See Terms & Conditions


One More Thing ... Get Best Stocks Delivered Daily!
Never Ever Miss A Move With Our Top Ten Stocks Lists
Find Best Stocks In Any Market - Bull or Bear Market
Take A Peek At Our Top Ten Stocks Lists: Daily, Weekly, Year-to-Date & Top Trends
Find Best Stocks In Any Market - Bull or Bear Market
Take A Peek At Our Top Ten Stocks Lists: Daily, Weekly, Year-to-Date & Top Trends
Emerging Markets Stocks With Best Up Trends [0-bearish to 100-bullish]: SunCar [100], Hesai [100], Trip.com [100], Noah [100], Weibo [100], United Microelectronics[100], KE [100], Tencent Music[100], Huazhu [100], BrasilAgro -[100], America Movil[100]
Best Emerging Markets Stocks Year-to-Date:
U Power[3264.96%], DouYu [854.74%], MicroCloud Hologram[553.24%], China Liberal[515.21%], Yatsen Holding[493.22%], Zhongchao [338.24%], Uxin [188.16%], GigaCloud [97.11%], QuantaSing [95.06%], Cheetah Mobile[74.12%], Smart Share[68.93%] Best Emerging Markets Stocks This Week:
Smart Share[40.05%], Dingdong (Cayman)[24.6%], NIO [24.05%], OneConnect Financial[21%], 21Vianet [20.89%], KE [17.8%], U Power[17.77%], Hesai [17.05%], Lixiang Education[16.68%], AMTD Digital[16.36%], XPeng [15.56%] Best Emerging Markets Stocks Daily:
OneConnect Financial[12.04%], U Power[9.44%], SunCar [9.43%], Azul S.A[8.63%], AMTD Digital[8.33%], Burning Rock[6.51%], Nu [6.13%], Grupo Televisa[6.02%], XP [5.96%], Dingdong (Cayman)[5.72%], Studio City[5.54%]