
 Login Sign Up


| |||||
 |  | ||||

| 12Stocks.com Market Intelligence |
Best Emerging Markets Stocks
| In a hurry? Emerging Markets Stocks Lists: Trends Table, Stock Charts
Sort Emerging Markets stocks: Daily, Weekly, Year-to-Date, Market Cap & Trends. Filter Emerging Markets stocks list by sector: Show all, Tech, Finance, Energy, Staples, Retail, Industrial, Materials, Utilities and HealthCare Filter Emerging Markets stocks list by size:All Large Medium Small |
| 12Stocks.com Emerging Markets Stocks Performances & Trends Daily | |||||||||
|
|  The overall Smart Investing & Trading Score is 38 (0-bearish to 100-bullish) which puts Emerging Markets index in short term bearish to neutral trend. The Smart Investing & Trading Score from previous trading session is 31 and hence an improvement of trend.
| ||||||||
Here are the Smart Investing & Trading Scores of the most requested Emerging Markets stocks at 12Stocks.com (click stock name for detailed review):
|


| 12Stocks.com: Top Performing Emerging Markets Index Stocks | ||||||||||||||||||||||||||||||||||||||||||||||||
 The top performing Emerging Markets Index stocks year to date are
Now, more recently, over last week, the top performing Emerging Markets Index stocks on the move are


|
||||||||||||||||||||||||||||||||||||||||||||||||
| 12Stocks.com: Investing in Emerging Markets Index with Stocks | |
|
The following table helps investors and traders sort through current performance and trends (as measured by Smart Investing & Trading Score ) of various
stocks in the Emerging Markets Index. Quick View: Move mouse or cursor over stock symbol (ticker) to view short-term technical chart and over stock name to view long term chart. Click on  to add stock symbol to your watchlist and to add stock symbol to your watchlist and  to view watchlist. Click on any ticker or stock name for detailed market intelligence report for that stock. to view watchlist. Click on any ticker or stock name for detailed market intelligence report for that stock. |
12Stocks.com Performance of Stocks in Emerging Markets Index
| Ticker | Stock Name | Watchlist | Category | Recent Price | Smart Investing & Trading Score | Change % | YTD Change% |
| PBR | Petroleo Brasileiro |   | Energy | 15.69 | 47 | 0.26% | -1.75% |
| RERE | ATRenew | | Services & Goods | 1.59 | 46 | 3.92% | -15.87% |
| TME | Tencent Music | | Technology | 11.27 | 46 | 0.18% | 25.08% |
| LI | Li Auto | | Services & Goods | 28.73 | 43 | 1.13% | -23.26% |
| CIG | Companhia Energetica | | Utilities | 2.42 | 43 | 0.83% | 4.31% |
| IBN | ICICI Bank | | Financials | 25.63 | 43 | 0.55% | 7.51% |
| BILI | Bilibili | | Technology | 11.03 | 43 | 0.36% | -9.37% |
| JFIN | Jiayin | | Technology | 6.37 | 43 | 0.16% | 22.97% |
| PERF | Perfect | | Technology | 2.39 | 43 | -3.63% | -22.90% |
| QSG | QuantaSing | | Consumer Staples | 3.56 | 42 | 8.87% | 119.75% |
| LANV | Lanvin | | Services & Goods | 1.50 | 42 | -6.83% | -50.98% |
| COE | China Online | | Services & Goods | 6.60 | 42 | -2.80% | -17.82% |
| ZCMD | Zhongchao | | Health Care | 1.37 | 41 | 0.74% | 275.24% |
| YRD | Yiren Digital | | Financials | 4.71 | 41 | -2.08% | 50.96% |
| NU | Nu | | Financials | 10.79 | 41 | -0.46% | 29.38% |
| EDU | New Oriental | | Services & Goods | 84.55 | 40 | -1.11% | 15.38% |
| YJ | Yunji | | Services & Goods | 0.79 | 38 | 2.53% | 11.06% |
| NOAH | Noah | | Financials | 11.84 | 38 | -1.66% | -14.27% |
| ASX | ASE | | Technology | 10.59 | 38 | -1.49% | 12.54% |
| YGMZ | MingZhu Logistics | | Industrials | 0.39 | 38 | 0.00% | -17.69% |
| WB | | Technology | 7.77 | 37 | 0.91% | -29.04% | |
| FENG | Phoenix New | | Technology | 1.89 | 36 | 3.85% | 38.97% |
| UCL | uCloudlink | | Technology | 1.51 | 36 | 0.00% | -18.38% |
| DQ | Daqo New | | Technology | 22.39 | 36 | -4.15% | -15.83% |
| ASR | Grupo Aeroportuario | | Transports | 303.74 | 36 | -1.50% | 3.22% |
| For chart view version of above stock list: Chart View ➞ 0 - 25 , 25 - 50 , 50 - 75 , 75 - 100 , 100 - 125 , 125 - 150 , 150 - 175 , 175 - 200 | ||
 | Click To Change The Sort Order: By Market Cap or Company Size Performance: Year-to-date, Week and Day |  |
|
Get the most comprehensive stock market coverage daily at 12Stocks.com ➞ Best Stocks Today ➞ Best Stocks Weekly ➞ Best Stocks Year-to-Date ➞ Best Stocks Trends ➞  Best Stocks Today 12Stocks.com Best Nasdaq Stocks ➞ Best S&P 500 Stocks ➞ Best Tech Stocks ➞ Best Biotech Stocks ➞ |
| Detailed Overview of Emerging Markets Stocks |
| Emerging Markets Technical Overview, Leaders & Laggards, Top Emerging Markets ETF Funds & Detailed Emerging Markets Stocks List, Charts, Trends & More |
| Emerging Markets: Technical Analysis, Trends & YTD Performance | |
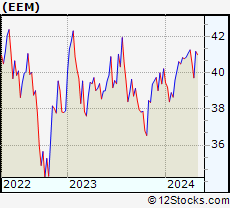
 EEM Weekly Chart |
|
| Long Term Trend: Good | |
| Medium Term Trend: Not Good | |
 EEM Daily Chart |
|
| Short Term Trend: Not Good | |
| Overall Trend Score: 38 | |
| YTD Performance: -1.24% | |
| **Trend Scores & Views Are Only For Educational Purposes And Not For Investing | |
| 12Stocks.com: Investing in Emerging Markets Index using Exchange Traded Funds | |
|
The following table shows list of key exchange traded funds (ETF) that
help investors play Emerging Markets stock market. For detailed view, check out our ETF Funds section of our website. Quick View: Move mouse or cursor over ETF symbol (ticker) to view short-term technical chart and over ETF name to view long term chart. Click on ticker or stock name for detailed view. Click on to add stock symbol to your watchlist and to view watchlist. |
12Stocks.com List of ETFs that track Emerging Markets Index
| Ticker | ETF Name | Watchlist | Recent Price | Smart Investing & Trading Score | Change % | Week % | Year-to-date % |
| EEM | Emerging Markets | | 39.71 | 38 | -0.08 | -2.02 | -1.24% |
| VWO | Emerging Markets | | 40.90 | 38 | 0.17 | -1.68 | -0.49% |
| SCHE | Emerging Markets Equity | | 24.70 | 38 | 0.04 | -1.71 | -0.36% |
| EWX | Emerging Markets Small | | 55.35 | 33 | 1.17 | -1.27 | -1.97% |
| EET | Emerging Markets | | 47.95 | 31 | -0.15 | -3.72 | -5.73% |
| EDC | Emrg Mkts Bull | | 27.12 | 38 | -0.18 | -6.09 | -10.88% |
| EEV | Short Emerging | | 20.56 | 74 | 0.26 | 4.15 | 4.24% |
| EUM | Short Emerging | | 14.50 | 74 | 0.31 | 2.22 | 2.47% |
| EDIV | Emerging Markets Dividend | | 32.71 | 51 | 0.77 | -0.7 | 0.58% |
| EMIF | Emerging Markets Infrastructure | | 21.36 | 33 | 0.23 | -1.94 | -0.19% |
| CEW | Emerging Currency Strat | | 17.58 | 28 | 0.24 | -0.59 | -2.35% |
| EBND | Em Mkts Lcl | | 19.89 | 10 | 0.61 | -0.9 | -6.36% |
| EMCB | Emerging Markets Corp | | 63.97 | 21 | -0.17 | -0.2 | 0.11% |
| VWOB | Emerging Mkts Govt | | 62.18 | 17 | 0.79 | -0.77 | -2.46% |
| EEMA | Emerging Markets Asia | | 65.90 | 31 | -0.15 | -2.13 | -0.32% |
| EELV | Em Mkts Low | | 23.11 | 0 | 0.06 | -1.72 | -3.87% |
| DVYE | Emerging Markets Dividend | | 26.31 | 53 | 0.69 | -0.57 | -0.68% |
| SDEM | SuperDividend Em Mkts | | 25.58 | 56 | 0.59 | -0.48 | 3.16% |
| DBEM | Em Mkts Hdgd | | 23.07 | 31 | -0.41 | -1.91 | 0% |
| PCY | Emerging Markets Sov | | 19.80 | 17 | 0.99 | -1.1 | -3.98% |
| QEMM | Emerging Mkts StratcFacts | | 56.05 | 33 | 0.02 | -1.46 | -1.93% |
| 12Stocks.com: Charts, Trends, Fundamental Data and Performances of Emerging Markets Stocks | |
|
We now take in-depth look at all Emerging Markets stocks including charts, multi-period performances and overall trends (as measured by Smart Investing & Trading Score ). One can sort Emerging Markets stocks (click link to choose) by Daily, Weekly and by Year-to-Date performances. Also, one can sort by size of the company or by market capitalization. |
| Select Your Default Chart Type: | |||||
| |||||
| Click on stock symbol or name for detailed view. Click on to add stock symbol to your watchlist and to view watchlist. Quick View: Move mouse or cursor over "Daily" to quickly view daily technical stock chart and over "Weekly" to view weekly technical stock chart. | |||||

 | PBR Petroleo Brasileiro S.A. - Petrobras |
| Sector: Energy | |
| SubSector: Oil & Gas Drilling & Exploration | |
| MarketCap: 38939.2 Millions | |
| Recent Price: 15.69 Smart Investing & Trading Score : 47 | |
| Day Percent Change: 0.26% Day Change: 0.04 | |
| Week Change: -0.19% Year-to-date Change: -1.8% | |
| PBR Links: Profile News Message Board | |
| Charts:- Daily , Weekly | |
| Add PBR to Watchlist: View: Get Complete PBR Trend Analysis ➞ | |
 | RERE ATRenew Inc. |
| Sector: Services & Goods | |
| SubSector: Internet Retail | |
| MarketCap: 672 Millions | |
| Recent Price: 1.59 Smart Investing & Trading Score : 46 | |
| Day Percent Change: 3.92% Day Change: 0.06 | |
| Week Change: -8.62% Year-to-date Change: -15.9% | |
| RERE Links: Profile News Message Board | |
| Charts:- Daily , Weekly | |
| Add RERE to Watchlist: View: Get Complete RERE Trend Analysis ➞ | |
 | TME Tencent Music Entertainment Group |
| Sector: Technology | |
| SubSector: Internet Information Providers | |
| MarketCap: 16195 Millions | |
| Recent Price: 11.27 Smart Investing & Trading Score : 46 | |
| Day Percent Change: 0.18% Day Change: 0.02 | |
| Week Change: -0.88% Year-to-date Change: 25.1% | |
| TME Links: Profile News Message Board | |
| Charts:- Daily , Weekly | |
| Add TME to Watchlist: View: Get Complete TME Trend Analysis ➞ | |
 | LI Li Auto Inc. |
| Sector: Services & Goods | |
| SubSector: Auto Manufacturers | |
| MarketCap: 29167 Millions | |
| Recent Price: 28.73 Smart Investing & Trading Score : 43 | |
| Day Percent Change: 1.13% Day Change: 0.32 | |
| Week Change: -2.25% Year-to-date Change: -23.3% | |
| LI Links: Profile News Message Board | |
| Charts:- Daily , Weekly | |
| Add LI to Watchlist: View: Get Complete LI Trend Analysis ➞ | |
 | CIG Companhia Energetica de Minas Gerais |
| Sector: Utilities | |
| SubSector: Electric Utilities | |
| MarketCap: 3203.54 Millions | |
| Recent Price: 2.42 Smart Investing & Trading Score : 43 | |
| Day Percent Change: 0.83% Day Change: 0.02 | |
| Week Change: -2.02% Year-to-date Change: 4.3% | |
| CIG Links: Profile News Message Board | |
| Charts:- Daily , Weekly | |
| Add CIG to Watchlist: View: Get Complete CIG Trend Analysis ➞ | |
 | IBN ICICI Bank Limited |
| Sector: Financials | |
| SubSector: Money Center Banks | |
| MarketCap: 31194.1 Millions | |
| Recent Price: 25.63 Smart Investing & Trading Score : 43 | |
| Day Percent Change: 0.55% Day Change: 0.14 | |
| Week Change: -1.95% Year-to-date Change: 7.5% | |
| IBN Links: Profile News Message Board | |
| Charts:- Daily , Weekly | |
| Add IBN to Watchlist: View: Get Complete IBN Trend Analysis ➞ | |
 | BILI Bilibili Inc. |
| Sector: Technology | |
| SubSector: Internet Information Providers | |
| MarketCap: 7043.1 Millions | |
| Recent Price: 11.03 Smart Investing & Trading Score : 43 | |
| Day Percent Change: 0.36% Day Change: 0.04 | |
| Week Change: -3.92% Year-to-date Change: -9.4% | |
| BILI Links: Profile News Message Board | |
| Charts:- Daily , Weekly | |
| Add BILI to Watchlist: View: Get Complete BILI Trend Analysis ➞ | |
 | JFIN Jiayin Group Inc. |
| Sector: Technology | |
| SubSector: Internet Information Providers | |
| MarketCap: 131.48 Millions | |
| Recent Price: 6.37 Smart Investing & Trading Score : 43 | |
| Day Percent Change: 0.16% Day Change: 0.01 | |
| Week Change: -1.39% Year-to-date Change: 23.0% | |
| JFIN Links: Profile News Message Board | |
| Charts:- Daily , Weekly | |
| Add JFIN to Watchlist: View: Get Complete JFIN Trend Analysis ➞ | |
 | PERF Perfect Corp. |
| Sector: Technology | |
| SubSector: Software - Application | |
| MarketCap: 582 Millions | |
| Recent Price: 2.39 Smart Investing & Trading Score : 43 | |
| Day Percent Change: -3.63% Day Change: -0.09 | |
| Week Change: -10.15% Year-to-date Change: -22.9% | |
| PERF Links: Profile News Message Board | |
| Charts:- Daily , Weekly | |
| Add PERF to Watchlist: View: Get Complete PERF Trend Analysis ➞ | |
 | QSG QuantaSing Group Limited |
| Sector: Consumer Staples | |
| SubSector: Education & Training Services | |
| MarketCap: 433 Millions | |
| Recent Price: 3.56 Smart Investing & Trading Score : 42 | |
| Day Percent Change: 8.87% Day Change: 0.29 | |
| Week Change: 5.95% Year-to-date Change: 119.8% | |
| QSG Links: Profile News Message Board | |
| Charts:- Daily , Weekly | |
| Add QSG to Watchlist: View: Get Complete QSG Trend Analysis ➞ | |
 | LANV Lanvin Group Holdings Limited |
| Sector: Services & Goods | |
| SubSector: Luxury Goods | |
| MarketCap: 712 Millions | |
| Recent Price: 1.50 Smart Investing & Trading Score : 42 | |
| Day Percent Change: -6.83% Day Change: -0.11 | |
| Week Change: -6.25% Year-to-date Change: -51.0% | |
| LANV Links: Profile News Message Board | |
| Charts:- Daily , Weekly | |
| Add LANV to Watchlist: View: Get Complete LANV Trend Analysis ➞ | |
 | COE China Online Education Group |
| Sector: Services & Goods | |
| SubSector: Education & Training Services | |
| MarketCap: 643.406 Millions | |
| Recent Price: 6.60 Smart Investing & Trading Score : 42 | |
| Day Percent Change: -2.80% Day Change: -0.19 | |
| Week Change: 1.38% Year-to-date Change: -17.8% | |
| COE Links: Profile News Message Board | |
| Charts:- Daily , Weekly | |
| Add COE to Watchlist: View: Get Complete COE Trend Analysis ➞ | |
 | ZCMD Zhongchao Inc. |
| Sector: Health Care | |
| SubSector: Health Information Services | |
| MarketCap: 41487 Millions | |
| Recent Price: 1.37 Smart Investing & Trading Score : 41 | |
| Day Percent Change: 0.74% Day Change: 0.01 | |
| Week Change: -16.46% Year-to-date Change: 275.2% | |
| ZCMD Links: Profile News Message Board | |
| Charts:- Daily , Weekly | |
| Add ZCMD to Watchlist: View: Get Complete ZCMD Trend Analysis ➞ | |
 | YRD Yiren Digital Ltd. |
| Sector: Financials | |
| SubSector: Credit Services | |
| MarketCap: 330.208 Millions | |
| Recent Price: 4.71 Smart Investing & Trading Score : 41 | |
| Day Percent Change: -2.08% Day Change: -0.10 | |
| Week Change: -8.54% Year-to-date Change: 51.0% | |
| YRD Links: Profile News Message Board | |
| Charts:- Daily , Weekly | |
| Add YRD to Watchlist: View: Get Complete YRD Trend Analysis ➞ | |
 | NU Nu Holdings Ltd. |
| Sector: Financials | |
| SubSector: Banks - Diversified | |
| MarketCap: 37240 Millions | |
| Recent Price: 10.79 Smart Investing & Trading Score : 41 | |
| Day Percent Change: -0.46% Day Change: -0.05 | |
| Week Change: -4.43% Year-to-date Change: 29.4% | |
| NU Links: Profile News Message Board | |
| Charts:- Daily , Weekly | |
| Add NU to Watchlist: View: Get Complete NU Trend Analysis ➞ | |
 | EDU New Oriental Education & Technology Group Inc. |
| Sector: Services & Goods | |
| SubSector: Education & Training Services | |
| MarketCap: 18673.7 Millions | |
| Recent Price: 84.55 Smart Investing & Trading Score : 40 | |
| Day Percent Change: -1.11% Day Change: -0.95 | |
| Week Change: -2.32% Year-to-date Change: 15.4% | |
| EDU Links: Profile News Message Board | |
| Charts:- Daily , Weekly | |
| Add EDU to Watchlist: View: Get Complete EDU Trend Analysis ➞ | |
 | YJ Yunji Inc. |
| Sector: Services & Goods | |
| SubSector: Specialty Retail, Other | |
| MarketCap: 770.644 Millions | |
| Recent Price: 0.79 Smart Investing & Trading Score : 38 | |
| Day Percent Change: 2.53% Day Change: 0.02 | |
| Week Change: -10.28% Year-to-date Change: 11.1% | |
| YJ Links: Profile News Message Board | |
| Charts:- Daily , Weekly | |
| Add YJ to Watchlist: View: Get Complete YJ Trend Analysis ➞ | |
 | NOAH Noah Holdings Limited |
| Sector: Financials | |
| SubSector: Asset Management | |
| MarketCap: 1495.33 Millions | |
| Recent Price: 11.84 Smart Investing & Trading Score : 38 | |
| Day Percent Change: -1.66% Day Change: -0.20 | |
| Week Change: -8% Year-to-date Change: -14.3% | |
| NOAH Links: Profile News Message Board | |
| Charts:- Daily , Weekly | |
| Add NOAH to Watchlist: View: Get Complete NOAH Trend Analysis ➞ | |
 | ASX ASE Technology Holding Co., Ltd. |
| Sector: Technology | |
| SubSector: Semiconductor Equipment & Materials | |
| MarketCap: 8513.18 Millions | |
| Recent Price: 10.59 Smart Investing & Trading Score : 38 | |
| Day Percent Change: -1.49% Day Change: -0.16 | |
| Week Change: -2.4% Year-to-date Change: 12.5% | |
| ASX Links: Profile News Message Board | |
| Charts:- Daily , Weekly | |
| Add ASX to Watchlist: View: Get Complete ASX Trend Analysis ➞ | |
 | YGMZ MingZhu Logistics Holdings Limited |
| Sector: Industrials | |
| SubSector: Trucking | |
| MarketCap: 41627 Millions | |
| Recent Price: 0.39 Smart Investing & Trading Score : 38 | |
| Day Percent Change: 0.00% Day Change: 0.00 | |
| Week Change: -2.78% Year-to-date Change: -17.7% | |
| YGMZ Links: Profile News Message Board | |
| Charts:- Daily , Weekly | |
| Add YGMZ to Watchlist: View: Get Complete YGMZ Trend Analysis ➞ | |
 | WB Weibo Corporation |
| Sector: Technology | |
| SubSector: Internet Information Providers | |
| MarketCap: 8164.6 Millions | |
| Recent Price: 7.77 Smart Investing & Trading Score : 37 | |
| Day Percent Change: 0.91% Day Change: 0.07 | |
| Week Change: 1.83% Year-to-date Change: -29.0% | |
| WB Links: Profile News Message Board | |
| Charts:- Daily , Weekly | |
| Add WB to Watchlist: View: Get Complete WB Trend Analysis ➞ | |
 | FENG Phoenix New Media Limited |
| Sector: Technology | |
| SubSector: Internet Information Providers | |
| MarketCap: 107.08 Millions | |
| Recent Price: 1.89 Smart Investing & Trading Score : 36 | |
| Day Percent Change: 3.85% Day Change: 0.07 | |
| Week Change: -6.9% Year-to-date Change: 39.0% | |
| FENG Links: Profile News Message Board | |
| Charts:- Daily , Weekly | |
| Add FENG to Watchlist: View: Get Complete FENG Trend Analysis ➞ | |
 | UCL uCloudlink Group Inc. |
| Sector: Technology | |
| SubSector: Telecom Services | |
| MarketCap: 35837 Millions | |
| Recent Price: 1.51 Smart Investing & Trading Score : 36 | |
| Day Percent Change: 0.00% Day Change: 0.00 | |
| Week Change: -2.64% Year-to-date Change: -18.4% | |
| UCL Links: Profile News Message Board | |
| Charts:- Daily , Weekly | |
| Add UCL to Watchlist: View: Get Complete UCL Trend Analysis ➞ | |
 | DQ Daqo New Energy Corp. |
| Sector: Technology | |
| SubSector: Semiconductor Equipment & Materials | |
| MarketCap: 660.918 Millions | |
| Recent Price: 22.39 Smart Investing & Trading Score : 36 | |
| Day Percent Change: -4.15% Day Change: -0.97 | |
| Week Change: -4.07% Year-to-date Change: -15.8% | |
| DQ Links: Profile News Message Board | |
| Charts:- Daily , Weekly | |
| Add DQ to Watchlist: View: Get Complete DQ Trend Analysis ➞ | |
 | ASR Grupo Aeroportuario del Sureste, S. A. B. de C. V. |
| Sector: Transports | |
| SubSector: Air Services, Other | |
| MarketCap: 2739.98 Millions | |
| Recent Price: 303.74 Smart Investing & Trading Score : 36 | |
| Day Percent Change: -1.50% Day Change: -4.62 | |
| Week Change: -4.19% Year-to-date Change: 3.2% | |
| ASR Links: Profile News Message Board | |
| Charts:- Daily , Weekly | |
| Add ASR to Watchlist: View: Get Complete ASR Trend Analysis ➞ | |
| For tabular summary view of above stock list: Summary View ➞ 0 - 25 , 25 - 50 , 50 - 75 , 75 - 100 , 100 - 125 , 125 - 150 , 150 - 175 , 175 - 200 | ||
| Click To Change The Sort Order: By Market Cap or Company Size Performance: Year-to-date, Week and Day | |
| Select Chart Type: | ||
|
Best Stocks Today 12Stocks.com |
© 2024 12Stocks.com Terms & Conditions Privacy Contact Us
All Information Provided Only For Education And Not To Be Used For Investing or Trading. See Terms & Conditions


One More Thing ... Get Best Stocks Delivered Daily!
Never Ever Miss A Move With Our Top Ten Stocks Lists
Find Best Stocks In Any Market - Bull or Bear Market
Take A Peek At Our Top Ten Stocks Lists: Daily, Weekly, Year-to-Date & Top Trends
Find Best Stocks In Any Market - Bull or Bear Market
Take A Peek At Our Top Ten Stocks Lists: Daily, Weekly, Year-to-Date & Top Trends
Emerging Markets Stocks With Best Up Trends [0-bearish to 100-bullish]: GigaCloud [100], DouYu [90], Yatsen Holding[90], TAL Education[78], Sibanye Stillwater[76], iQIYI [73], Harmony Gold[71], DRDGOLD [71], Gold Fields[70], Bright Scholar[70], HDFC Bank[69]
Best Emerging Markets Stocks Year-to-Date:
U Power[2651.12%], DouYu [730.53%], MicroCloud Hologram[541.73%], China Liberal[453.69%], Yatsen Holding[393.44%], Zhongchao [275.24%], Uxin [133.95%], QuantaSing [119.75%], GigaCloud [90.77%], Bright Scholar[55.2%], Yiren Digital[50.96%] Best Emerging Markets Stocks This Week:
Regencell Bioscience[24.33%], Yatsen Holding[19.93%], Burning Rock[6.58%], Controladora Vuela[6.52%], QuantaSing [5.95%], Bright Scholar[5.43%], Smart Share[5.06%], DouYu [4.5%], SunCar [4.43%], Momo [4.15%], GigaCloud [3.36%] Best Emerging Markets Stocks Daily:
Regencell Bioscience[27.68%], U Power[10.29%], QuantaSing [8.87%], MINISO [8.10%], Controladora Vuela[6.37%], Aesthetic Medical[6.06%], Hywin [5.87%], EHang [5.81%], Fangdd Network[5.14%], Studio City[5.05%], Hesai [4.50%]