
 Login Sign Up


| |||||
 |  | ||||

| 12Stocks.com Market Intelligence |
Best Emerging Markets Stocks
| In a hurry? Emerging Markets Stocks Lists: Trends Table, Stock Charts
Sort Emerging Markets stocks: Daily, Weekly, Year-to-Date, Market Cap & Trends. Filter Emerging Markets stocks list by sector: Show all, Tech, Finance, Energy, Staples, Retail, Industrial, Materials, Utilities and HealthCare Filter Emerging Markets stocks list by size:All Large Medium Small |
| 12Stocks.com Emerging Markets Stocks Performances & Trends Daily | |||||||||
|
|  The overall Smart Investing & Trading Score is 68 (0-bearish to 100-bullish) which puts Emerging Markets index in short term neutral to bullish trend. The Smart Investing & Trading Score from previous trading session is 63 and an improvement of trend continues.
| ||||||||
Here are the Smart Investing & Trading Scores of the most requested Emerging Markets stocks at 12Stocks.com (click stock name for detailed review):
|


| 12Stocks.com: Top Performing Emerging Markets Index Stocks | ||||||||||||||||||||||||||||||||||||||||||||||||
 The top performing Emerging Markets Index stocks year to date are
Now, more recently, over last week, the top performing Emerging Markets Index stocks on the move are


|
||||||||||||||||||||||||||||||||||||||||||||||||
| 12Stocks.com: Investing in Emerging Markets Index with Stocks | |
|
The following table helps investors and traders sort through current performance and trends (as measured by Smart Investing & Trading Score ) of various
stocks in the Emerging Markets Index. Quick View: Move mouse or cursor over stock symbol (ticker) to view short-term technical chart and over stock name to view long term chart. Click on  to add stock symbol to your watchlist and to add stock symbol to your watchlist and  to view watchlist. Click on any ticker or stock name for detailed market intelligence report for that stock. to view watchlist. Click on any ticker or stock name for detailed market intelligence report for that stock. |
12Stocks.com Performance of Stocks in Emerging Markets Index
| Ticker | Stock Name | Watchlist | Category | Recent Price | Smart Investing & Trading Score | Change % | YTD Change% |
| YSG | Yatsen Holding |   | Services & Goods | 4.23 | 100 | 7.63% | 478.18% |
| JD | JD.com | | Technology | 28.32 | 100 | 2.78% | -1.99% |
| YMM | Full Truck | | Technology | 8.34 | 100 | 2.14% | 19.16% |
| BABA | Alibaba | | Services & Goods | 73.91 | 100 | 1.93% | -4.64% |
| MNSO | MINISO | | Services & Goods | 22.39 | 100 | 1.57% | 9.73% |
| VLRS | Controladora Vuela | | Transports | 8.48 | 100 | 0.00% | -9.59% |
| PAC | Grupo Aeroportuario | | Transports | 174.43 | 100 | -2.26% | -0.45% |
| BZUN | Baozun | | Services & Goods | 2.63 | 95 | 3.14% | -4.01% |
| BRFS | BRF S.A | | Consumer Staples | 3.39 | 95 | -1.17% | 21.94% |
| ASR | Grupo Aeroportuario | | Transports | 333.00 | 93 | -1.59% | 13.16% |
| LU | Lufax Holding | | Financials | 4.53 | 90 | 3.78% | 47.39% |
| RLX | RLX | | Consumer Staples | 1.85 | 90 | 0.82% | -6.82% |
| XNET | Xunlei | | Technology | 1.56 | 90 | 0.00% | -3.70% |
| IBN | ICICI Bank | | Financials | 26.19 | 90 | -0.38% | 9.86% |
| CMCM | Cheetah Mobile | | Technology | 4.06 | 88 | 0.00% | 78.07% |
| YUMC | Yum China | | Services & Goods | 38.40 | 85 | 0.10% | -9.50% |
| OMAB | Grupo Aeroportuario | | Transports | 80.47 | 85 | -1.42% | -4.92% |
| TAL | TAL Education | | Services & Goods | 11.70 | 83 | -4.02% | -7.36% |
| BZ | Kanzhun | | Industrials | 19.05 | 81 | 1.38% | 15.25% |
| GDS | GDS | | Technology | 7.04 | 80 | 4.06% | -22.75% |
| KC | Kingsoft Cloud | | Technology | 2.87 | 80 | 1.24% | -24.31% |
| HTHT | Huazhu | | Services & Goods | 39.03 | 80 | 1.00% | 16.73% |
| YRD | Yiren Digital | | Financials | 5.15 | 78 | 2.59% | 65.06% |
| NOAH | Noah | | Financials | 12.25 | 78 | 0.91% | -11.30% |
| ZTO | ZTO Express | | Transports | 20.82 | 75 | 2.87% | -2.16% |
| For chart view version of above stock list: Chart View ➞ 0 - 25 , 25 - 50 , 50 - 75 , 75 - 100 , 100 - 125 , 125 - 150 | ||
 | Click To Change The Sort Order: By Market Cap or Company Size Performance: Year-to-date, Week and Day |  |
|
Get the most comprehensive stock market coverage daily at 12Stocks.com ➞ Best Stocks Today ➞ Best Stocks Weekly ➞ Best Stocks Year-to-Date ➞ Best Stocks Trends ➞  Best Stocks Today 12Stocks.com Best Nasdaq Stocks ➞ Best S&P 500 Stocks ➞ Best Tech Stocks ➞ Best Biotech Stocks ➞ |
| Detailed Overview of Emerging Markets Stocks |
| Emerging Markets Technical Overview, Leaders & Laggards, Top Emerging Markets ETF Funds & Detailed Emerging Markets Stocks List, Charts, Trends & More |
| Emerging Markets: Technical Analysis, Trends & YTD Performance | |
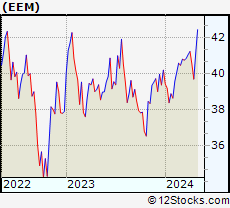
 EEM Weekly Chart |
|
| Long Term Trend: Very Good | |
| Medium Term Trend: Not Good | |
 EEM Daily Chart |
|
| Short Term Trend: Very Good | |
| Overall Trend Score: 68 | |
| YTD Performance: 1.07% | |
| **Trend Scores & Views Are Only For Educational Purposes And Not For Investing | |
| 12Stocks.com: Investing in Emerging Markets Index using Exchange Traded Funds | |
|
The following table shows list of key exchange traded funds (ETF) that
help investors play Emerging Markets stock market. For detailed view, check out our ETF Funds section of our website. Quick View: Move mouse or cursor over ETF symbol (ticker) to view short-term technical chart and over ETF name to view long term chart. Click on ticker or stock name for detailed view. Click on to add stock symbol to your watchlist and to view watchlist. |
12Stocks.com List of ETFs that track Emerging Markets Index
| Ticker | ETF Name | Watchlist | Recent Price | Smart Investing & Trading Score | Change % | Week % | Year-to-date % |
| EEM | Emerging Markets | | 40.64 | 68 | 0.42 | 2.34 | 1.07% |
| VWO | Emerging Markets | | 41.68 | 68 | 0.24 | 1.93 | 1.41% |
| SCHE | Emerging Markets Equity | | 25.21 | 68 | 0.44 | 2.11 | 1.69% |
| EET | Emerging Markets | | 49.58 | 68 | 0.52 | 3.9 | -2.52% |
| EDC | Emrg Mkts Bull | | 29.05 | 68 | 1.33 | 7.31 | -4.53% |
| EEV | Short Emerging | | 19.70 | 32 | -0.33 | -4.01 | -0.14% |
| EUM | Short Emerging | | 14.15 | 32 | -0.51 | -2.36 | 0% |
| PCY | Emerging Markets Sov | | 19.75 | 25 | -0.65 | -0.3 | -4.22% |
| 12Stocks.com: Charts, Trends, Fundamental Data and Performances of Emerging Markets Stocks | |
|
We now take in-depth look at all Emerging Markets stocks including charts, multi-period performances and overall trends (as measured by Smart Investing & Trading Score ). One can sort Emerging Markets stocks (click link to choose) by Daily, Weekly and by Year-to-Date performances. Also, one can sort by size of the company or by market capitalization. |
| Select Your Default Chart Type: | |||||
| |||||
| Click on stock symbol or name for detailed view. Click on to add stock symbol to your watchlist and to view watchlist. Quick View: Move mouse or cursor over "Daily" to quickly view daily technical stock chart and over "Weekly" to view weekly technical stock chart. | |||||

 | YSG Yatsen Holding Limited |
| Sector: Services & Goods | |
| SubSector: Specialty Retail | |
| MarketCap: 11827 Millions | |
| Recent Price: 4.23 Smart Investing & Trading Score : 100 | |
| Day Percent Change: 7.63% Day Change: 0.30 | |
| Week Change: 17.01% Year-to-date Change: 478.2% | |
| YSG Links: Profile News Message Board | |
| Charts:- Daily , Weekly | |
| Add YSG to Watchlist: View: Get Complete YSG Trend Analysis ➞ | |
 | JD JD.com, Inc. |
| Sector: Technology | |
| SubSector: Internet Information Providers | |
| MarketCap: 59907.3 Millions | |
| Recent Price: 28.32 Smart Investing & Trading Score : 100 | |
| Day Percent Change: 2.78% Day Change: 0.77 | |
| Week Change: 11% Year-to-date Change: -2.0% | |
| JD Links: Profile News Message Board | |
| Charts:- Daily , Weekly | |
| Add JD to Watchlist: View: Get Complete JD Trend Analysis ➞ | |
 | YMM Full Truck Alliance Co. Ltd. |
| Sector: Technology | |
| SubSector: Software - Application | |
| MarketCap: 6960 Millions | |
| Recent Price: 8.34 Smart Investing & Trading Score : 100 | |
| Day Percent Change: 2.14% Day Change: 0.18 | |
| Week Change: 7.27% Year-to-date Change: 19.2% | |
| YMM Links: Profile News Message Board | |
| Charts:- Daily , Weekly | |
| Add YMM to Watchlist: View: Get Complete YMM Trend Analysis ➞ | |
 | BABA Alibaba Group Holding Limited |
| Sector: Services & Goods | |
| SubSector: Specialty Retail, Other | |
| MarketCap: 522666 Millions | |
| Recent Price: 73.91 Smart Investing & Trading Score : 100 | |
| Day Percent Change: 1.93% Day Change: 1.40 | |
| Week Change: 7.01% Year-to-date Change: -4.6% | |
| BABA Links: Profile News Message Board | |
| Charts:- Daily , Weekly | |
| Add BABA to Watchlist: View: Get Complete BABA Trend Analysis ➞ | |
 | MNSO MINISO Group Holding Limited |
| Sector: Services & Goods | |
| SubSector: Specialty Retail | |
| MarketCap: 69427 Millions | |
| Recent Price: 22.39 Smart Investing & Trading Score : 100 | |
| Day Percent Change: 1.57% Day Change: 0.35 | |
| Week Change: 9.17% Year-to-date Change: 9.7% | |
| MNSO Links: Profile News Message Board | |
| Charts:- Daily , Weekly | |
| Add MNSO to Watchlist: View: Get Complete MNSO Trend Analysis ➞ | |
 | VLRS Controladora Vuela Compania de Aviacion, S.A.B. de C.V. |
| Sector: Transports | |
| SubSector: Major Airlines | |
| MarketCap: 382 Millions | |
| Recent Price: 8.48 Smart Investing & Trading Score : 100 | |
| Day Percent Change: 0.00% Day Change: 0.00 | |
| Week Change: 8.72% Year-to-date Change: -9.6% | |
| VLRS Links: Profile News Message Board | |
| Charts:- Daily , Weekly | |
| Add VLRS to Watchlist: View: Get Complete VLRS Trend Analysis ➞ | |
 | PAC Grupo Aeroportuario del Pacifico, S.A.B. de C.V. |
| Sector: Transports | |
| SubSector: Air Services, Other | |
| MarketCap: 3204.18 Millions | |
| Recent Price: 174.43 Smart Investing & Trading Score : 100 | |
| Day Percent Change: -2.26% Day Change: -4.03 | |
| Week Change: 11.71% Year-to-date Change: -0.5% | |
| PAC Links: Profile News Message Board | |
| Charts:- Daily , Weekly | |
| Add PAC to Watchlist: View: Get Complete PAC Trend Analysis ➞ | |
 | BZUN Baozun Inc. |
| Sector: Services & Goods | |
| SubSector: Catalog & Mail Order Houses | |
| MarketCap: 1668.92 Millions | |
| Recent Price: 2.63 Smart Investing & Trading Score : 95 | |
| Day Percent Change: 3.14% Day Change: 0.08 | |
| Week Change: 13.36% Year-to-date Change: -4.0% | |
| BZUN Links: Profile News Message Board | |
| Charts:- Daily , Weekly | |
| Add BZUN to Watchlist: View: Get Complete BZUN Trend Analysis ➞ | |
 | BRFS BRF S.A. |
| Sector: Consumer Staples | |
| SubSector: Meat Products | |
| MarketCap: 2635.51 Millions | |
| Recent Price: 3.39 Smart Investing & Trading Score : 95 | |
| Day Percent Change: -1.17% Day Change: -0.04 | |
| Week Change: 3.35% Year-to-date Change: 21.9% | |
| BRFS Links: Profile News Message Board | |
| Charts:- Daily , Weekly | |
| Add BRFS to Watchlist: View: Get Complete BRFS Trend Analysis ➞ | |
 | ASR Grupo Aeroportuario del Sureste, S. A. B. de C. V. |
| Sector: Transports | |
| SubSector: Air Services, Other | |
| MarketCap: 2739.98 Millions | |
| Recent Price: 333.00 Smart Investing & Trading Score : 93 | |
| Day Percent Change: -1.59% Day Change: -5.38 | |
| Week Change: 8.04% Year-to-date Change: 13.2% | |
| ASR Links: Profile News Message Board | |
| Charts:- Daily , Weekly | |
| Add ASR to Watchlist: View: Get Complete ASR Trend Analysis ➞ | |
 | LU Lufax Holding Ltd |
| Sector: Financials | |
| SubSector: Credit Services | |
| MarketCap: 33457 Millions | |
| Recent Price: 4.53 Smart Investing & Trading Score : 90 | |
| Day Percent Change: 3.78% Day Change: 0.17 | |
| Week Change: 4.02% Year-to-date Change: 47.4% | |
| LU Links: Profile News Message Board | |
| Charts:- Daily , Weekly | |
| Add LU to Watchlist: View: Get Complete LU Trend Analysis ➞ | |
 | RLX RLX Technology Inc. |
| Sector: Consumer Staples | |
| SubSector: Tobacco | |
| MarketCap: 2800 Millions | |
| Recent Price: 1.85 Smart Investing & Trading Score : 90 | |
| Day Percent Change: 0.82% Day Change: 0.01 | |
| Week Change: 3.65% Year-to-date Change: -6.8% | |
| RLX Links: Profile News Message Board | |
| Charts:- Daily , Weekly | |
| Add RLX to Watchlist: View: Get Complete RLX Trend Analysis ➞ | |
 | XNET Xunlei Limited |
| Sector: Technology | |
| SubSector: Application Software | |
| MarketCap: 203.662 Millions | |
| Recent Price: 1.56 Smart Investing & Trading Score : 90 | |
| Day Percent Change: 0.00% Day Change: 0.00 | |
| Week Change: 5.41% Year-to-date Change: -3.7% | |
| XNET Links: Profile News Message Board | |
| Charts:- Daily , Weekly | |
| Add XNET to Watchlist: View: Get Complete XNET Trend Analysis ➞ | |
 | IBN ICICI Bank Limited |
| Sector: Financials | |
| SubSector: Money Center Banks | |
| MarketCap: 31194.1 Millions | |
| Recent Price: 26.19 Smart Investing & Trading Score : 90 | |
| Day Percent Change: -0.38% Day Change: -0.10 | |
| Week Change: 1.99% Year-to-date Change: 9.9% | |
| IBN Links: Profile News Message Board | |
| Charts:- Daily , Weekly | |
| Add IBN to Watchlist: View: Get Complete IBN Trend Analysis ➞ | |
 | CMCM Cheetah Mobile Inc. |
| Sector: Technology | |
| SubSector: Application Software | |
| MarketCap: 343.362 Millions | |
| Recent Price: 4.06 Smart Investing & Trading Score : 88 | |
| Day Percent Change: 0.00% Day Change: 0.00 | |
| Week Change: 14.69% Year-to-date Change: 78.1% | |
| CMCM Links: Profile News Message Board | |
| Charts:- Daily , Weekly | |
| Add CMCM to Watchlist: View: Get Complete CMCM Trend Analysis ➞ | |
 | YUMC Yum China Holdings, Inc. |
| Sector: Services & Goods | |
| SubSector: Restaurants | |
| MarketCap: 16284.5 Millions | |
| Recent Price: 38.40 Smart Investing & Trading Score : 85 | |
| Day Percent Change: 0.10% Day Change: 0.04 | |
| Week Change: 3.5% Year-to-date Change: -9.5% | |
| YUMC Links: Profile News Message Board | |
| Charts:- Daily , Weekly | |
| Add YUMC to Watchlist: View: Get Complete YUMC Trend Analysis ➞ | |
 | OMAB Grupo Aeroportuario del Centro Norte, S.A.B. de C.V. |
| Sector: Transports | |
| SubSector: Air Services, Other | |
| MarketCap: 1196.38 Millions | |
| Recent Price: 80.47 Smart Investing & Trading Score : 85 | |
| Day Percent Change: -1.42% Day Change: -1.16 | |
| Week Change: 7.15% Year-to-date Change: -4.9% | |
| OMAB Links: Profile News Message Board | |
| Charts:- Daily , Weekly | |
| Add OMAB to Watchlist: View: Get Complete OMAB Trend Analysis ➞ | |
 | TAL TAL Education Group |
| Sector: Services & Goods | |
| SubSector: Education & Training Services | |
| MarketCap: 30103.1 Millions | |
| Recent Price: 11.70 Smart Investing & Trading Score : 83 | |
| Day Percent Change: -4.02% Day Change: -0.49 | |
| Week Change: 2.36% Year-to-date Change: -7.4% | |
| TAL Links: Profile News Message Board | |
| Charts:- Daily , Weekly | |
| Add TAL to Watchlist: View: Get Complete TAL Trend Analysis ➞ | |
 | BZ Kanzhun Limited |
| Sector: Industrials | |
| SubSector: Staffing & Employment Services | |
| MarketCap: 6680 Millions | |
| Recent Price: 19.05 Smart Investing & Trading Score : 81 | |
| Day Percent Change: 1.38% Day Change: 0.26 | |
| Week Change: 6.75% Year-to-date Change: 15.3% | |
| BZ Links: Profile News Message Board | |
| Charts:- Daily , Weekly | |
| Add BZ to Watchlist: View: Get Complete BZ Trend Analysis ➞ | |
 | GDS GDS Holdings Limited |
| Sector: Technology | |
| SubSector: Data Storage Devices | |
| MarketCap: 8597.99 Millions | |
| Recent Price: 7.04 Smart Investing & Trading Score : 80 | |
| Day Percent Change: 4.06% Day Change: 0.28 | |
| Week Change: 11.47% Year-to-date Change: -22.8% | |
| GDS Links: Profile News Message Board | |
| Charts:- Daily , Weekly | |
| Add GDS to Watchlist: View: Get Complete GDS Trend Analysis ➞ | |
 | KC Kingsoft Cloud Holdings Limited |
| Sector: Technology | |
| SubSector: Software Application | |
| MarketCap: 98487 Millions | |
| Recent Price: 2.87 Smart Investing & Trading Score : 80 | |
| Day Percent Change: 1.24% Day Change: 0.04 | |
| Week Change: 7.5% Year-to-date Change: -24.3% | |
| KC Links: Profile News Message Board | |
| Charts:- Daily , Weekly | |
| Add KC to Watchlist: View: Get Complete KC Trend Analysis ➞ | |
 | HTHT Huazhu Group Limited |
| Sector: Services & Goods | |
| SubSector: Lodging | |
| MarketCap: 9164.46 Millions | |
| Recent Price: 39.03 Smart Investing & Trading Score : 80 | |
| Day Percent Change: 1.00% Day Change: 0.38 | |
| Week Change: 5.81% Year-to-date Change: 16.7% | |
| HTHT Links: Profile News Message Board | |
| Charts:- Daily , Weekly | |
| Add HTHT to Watchlist: View: Get Complete HTHT Trend Analysis ➞ | |
 | YRD Yiren Digital Ltd. |
| Sector: Financials | |
| SubSector: Credit Services | |
| MarketCap: 330.208 Millions | |
| Recent Price: 5.15 Smart Investing & Trading Score : 78 | |
| Day Percent Change: 2.59% Day Change: 0.13 | |
| Week Change: 6.63% Year-to-date Change: 65.1% | |
| YRD Links: Profile News Message Board | |
| Charts:- Daily , Weekly | |
| Add YRD to Watchlist: View: Get Complete YRD Trend Analysis ➞ | |
 | NOAH Noah Holdings Limited |
| Sector: Financials | |
| SubSector: Asset Management | |
| MarketCap: 1495.33 Millions | |
| Recent Price: 12.25 Smart Investing & Trading Score : 78 | |
| Day Percent Change: 0.91% Day Change: 0.11 | |
| Week Change: 5.42% Year-to-date Change: -11.3% | |
| NOAH Links: Profile News Message Board | |
| Charts:- Daily , Weekly | |
| Add NOAH to Watchlist: View: Get Complete NOAH Trend Analysis ➞ | |
 | ZTO ZTO Express (Cayman) Inc. |
| Sector: Transports | |
| SubSector: Air Delivery & Freight Services | |
| MarketCap: 20507 Millions | |
| Recent Price: 20.82 Smart Investing & Trading Score : 75 | |
| Day Percent Change: 2.87% Day Change: 0.58 | |
| Week Change: 4.41% Year-to-date Change: -2.2% | |
| ZTO Links: Profile News Message Board | |
| Charts:- Daily , Weekly | |
| Add ZTO to Watchlist: View: Get Complete ZTO Trend Analysis ➞ | |
| For tabular summary view of above stock list: Summary View ➞ 0 - 25 , 25 - 50 , 50 - 75 , 75 - 100 , 100 - 125 , 125 - 150 | ||
| Click To Change The Sort Order: By Market Cap or Company Size Performance: Year-to-date, Week and Day | |
| Select Chart Type: | ||
|
Best Stocks Today 12Stocks.com |
© 2024 12Stocks.com Terms & Conditions Privacy Contact Us
All Information Provided Only For Education And Not To Be Used For Investing or Trading. See Terms & Conditions


One More Thing ... Get Best Stocks Delivered Daily!
Never Ever Miss A Move With Our Top Ten Stocks Lists
Find Best Stocks In Any Market - Bull or Bear Market
Take A Peek At Our Top Ten Stocks Lists: Daily, Weekly, Year-to-Date & Top Trends
Find Best Stocks In Any Market - Bull or Bear Market
Take A Peek At Our Top Ten Stocks Lists: Daily, Weekly, Year-to-Date & Top Trends
Emerging Markets Stocks With Best Up Trends [0-bearish to 100-bullish]: Yatsen Holding[100], JD.com [100], Full Truck[100], Alibaba [100], MINISO [100], Controladora Vuela[100], Grupo Aeroportuario[100], Baozun [95], BRF S.A[95], Grupo Aeroportuario[93], Lufax Holding[90]
Best Emerging Markets Stocks Year-to-Date:
U Power[2785.04%], MicroCloud Hologram[616.55%], China Liberal[498.43%], Yatsen Holding[478.18%], Zhongchao [347.82%], QuantaSing [104.32%], GigaCloud [100.44%], Cheetah Mobile[78.07%], Yiren Digital[65.06%], Lufax Holding[47.39%], MakeMyTrip [40.86%] Best Emerging Markets Stocks This Week:
WiMi Hologram[21.13%], Yatsen Holding[17.01%], Cheetah Mobile[14.69%], Baozun [13.36%], BeiGene [12.21%], Grupo Aeroportuario[11.71%], GDS [11.47%], JD.com [11%], Tuya [10.19%], MINISO [9.17%], Controladora Vuela[8.72%] Best Emerging Markets Stocks Daily:
WiMi Hologram[16.49%], Intchains [7.71%], Yatsen Holding[7.63%], AMTD Digital[4.81%], 17 Education[4.68%], BeiGene [4.56%], MingZhu Logistics[4.18%], iHuman [4.12%], GDS [4.06%], Lufax Holding[3.78%], Baozun [3.14%]