
 Login Sign Up


| |||||
 |  | ||||

| 12Stocks.com Market Intelligence |
Best Emerging Markets Stocks
| In a hurry? Emerging Markets Stocks Lists: Trends Table, Stock Charts
Sort Emerging Markets stocks: Daily, Weekly, Year-to-Date, Market Cap & Trends. Filter Emerging Markets stocks list by sector: Show all, Tech, Finance, Energy, Staples, Retail, Industrial, Materials, Utilities and HealthCare Filter Emerging Markets stocks list by size:All Large Medium Small |
| 12Stocks.com Emerging Markets Stocks Performances & Trends Daily | |||||||||
|
|  The overall Smart Investing & Trading Score is 68 (0-bearish to 100-bullish) which puts Emerging Markets index in short term neutral to bullish trend. The Smart Investing & Trading Score from previous trading session is 63 and an improvement of trend continues.
| ||||||||
Here are the Smart Investing & Trading Scores of the most requested Emerging Markets stocks at 12Stocks.com (click stock name for detailed review):
|


| 12Stocks.com: Top Performing Emerging Markets Index Stocks | ||||||||||||||||||||||||||||||||||||||||||||||||
 The top performing Emerging Markets Index stocks year to date are
Now, more recently, over last week, the top performing Emerging Markets Index stocks on the move are


|
||||||||||||||||||||||||||||||||||||||||||||||||
| 12Stocks.com: Investing in Emerging Markets Index with Stocks | |
|
The following table helps investors and traders sort through current performance and trends (as measured by Smart Investing & Trading Score ) of various
stocks in the Emerging Markets Index. Quick View: Move mouse or cursor over stock symbol (ticker) to view short-term technical chart and over stock name to view long term chart. Click on  to add stock symbol to your watchlist and to add stock symbol to your watchlist and  to view watchlist. Click on any ticker or stock name for detailed market intelligence report for that stock. to view watchlist. Click on any ticker or stock name for detailed market intelligence report for that stock. |
12Stocks.com Performance of Stocks in Emerging Markets Index
| Ticker | Stock Name | Watchlist | Category | Recent Price | Smart Investing & Trading Score | Change % | YTD Change% |
| UXIN | Uxin |   | Technology | 1.97 | 39 | 18.37% | 180.31% |
| HSAI | Hesai | | Services & Goods | 4.34 | 37 | 2.48% | -52.20% |
| FENG | Phoenix New | | Technology | 1.75 | 36 | -3.85% | 28.68% |
| SUZ | Suzano S.A | | Consumer Staples | 11.69 | 36 | -0.47% | 2.86% |
| DRD | DRDGOLD | | Materials | 7.87 | 36 | -0.25% | -1.01% |
| VIV | Telefonica Brasil | | Technology | 9.41 | 35 | 0.27% | -13.94% |
| QH | Quhuo | | Technology | 0.61 | 35 | 0.00% | -58.38% |
| VSTA | Vasta Platform | | Consumer Staples | 3.80 | 35 | 0.00% | -13.64% |
| KRKR | 36Kr | | Technology | 0.38 | 35 | 0.00% | -32.68% |
| GDHG | Golden Heaven | | Services & Goods | 0.25 | 35 | -2.32% | -66.01% |
| YI | 111 | | Services & Goods | 1.07 | 35 | -1.83% | -30.97% |
| INFY | Infosys | | Technology | 17.04 | 35 | -0.70% | -7.29% |
| HYW | Hywin | | Financials | 0.87 | 35 | -0.53% | -53.17% |
| VTRU | Vitru | | Consumer Staples | 13.29 | 35 | -0.37% | -15.99% |
| VINP | Vi Partners | | Financials | 10.48 | 32 | 1.75% | -4.64% |
| UMC | United Microelectronics | | Technology | 7.61 | 32 | 0.07% | -10.11% |
| JG | Aurora Mobile | | Technology | 3.14 | 32 | 0.00% | 10.10% |
| HIMX | Himax | | Technology | 4.91 | 32 | 0.00% | -19.11% |
| COE | China Online | | Services & Goods | 7.03 | 32 | -2.90% | -12.46% |
| ASAI | Sendas Distribuidora | | Consumer Staples | 13.09 | 32 | -2.31% | -5.11% |
| VTMX | Vesta Financials | | Financials | 35.78 | 32 | -1.87% | -10.02% |
| NTES | NetEase | | Technology | 94.11 | 32 | 1.12% | 1.03% |
| UCL | uCloudlink | | Technology | 1.44 | 30 | 0.00% | -22.16% |
| SIM | Grupo Simec | | Materials | 31.00 | 30 | -2.52% | -0.55% |
| ZLAB | Zai Lab | | Health Care | 15.61 | 29 | 3.21% | -42.90% |
| For chart view version of above stock list: Chart View ➞ 0 - 25 , 25 - 50 , 50 - 75 , 75 - 100 , 100 - 125 , 125 - 150 , 150 - 175 , 175 - 200 | ||
 | Click To Change The Sort Order: By Market Cap or Company Size Performance: Year-to-date, Week and Day |  |
|
Get the most comprehensive stock market coverage daily at 12Stocks.com ➞ Best Stocks Today ➞ Best Stocks Weekly ➞ Best Stocks Year-to-Date ➞ Best Stocks Trends ➞  Best Stocks Today 12Stocks.com Best Nasdaq Stocks ➞ Best S&P 500 Stocks ➞ Best Tech Stocks ➞ Best Biotech Stocks ➞ |
| Detailed Overview of Emerging Markets Stocks |
| Emerging Markets Technical Overview, Leaders & Laggards, Top Emerging Markets ETF Funds & Detailed Emerging Markets Stocks List, Charts, Trends & More |
| Emerging Markets: Technical Analysis, Trends & YTD Performance | |
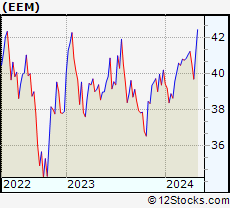
 EEM Weekly Chart |
|
| Long Term Trend: Very Good | |
| Medium Term Trend: Not Good | |
 EEM Daily Chart |
|
| Short Term Trend: Very Good | |
| Overall Trend Score: 68 | |
| YTD Performance: 0.99% | |
| **Trend Scores & Views Are Only For Educational Purposes And Not For Investing | |
| 12Stocks.com: Investing in Emerging Markets Index using Exchange Traded Funds | |
|
The following table shows list of key exchange traded funds (ETF) that
help investors play Emerging Markets stock market. For detailed view, check out our ETF Funds section of our website. Quick View: Move mouse or cursor over ETF symbol (ticker) to view short-term technical chart and over ETF name to view long term chart. Click on ticker or stock name for detailed view. Click on to add stock symbol to your watchlist and to view watchlist. |
12Stocks.com List of ETFs that track Emerging Markets Index
| Ticker | ETF Name | Watchlist | Recent Price | Smart Investing & Trading Score | Change % | Week % | Year-to-date % |
| EEM | Emerging Markets | | 40.61 | 68 | 0.35 | 2.27 | 0.99% |
| VWO | Emerging Markets | | 41.69 | 68 | 0.26 | 1.96 | 1.44% |
| SCHE | Emerging Markets Equity | | 25.16 | 68 | 0.26 | 1.92 | 1.51% |
| EWX | Emerging Markets Small | | 55.73 | 43 | 0.11 | 1.02 | -1.29% |
| EET | Emerging Markets | | 49.83 | 68 | 1.03 | 4.43 | -2.03% |
| EDC | Emrg Mkts Bull | | 28.87 | 63 | 0.70 | 6.65 | -5.13% |
| EEV | Short Emerging | | 19.69 | 32 | -0.35 | -4.03 | -0.17% |
| EUM | Short Emerging | | 14.19 | 32 | -0.23 | -2.08 | 0.28% |
| EDIV | Emerging Markets Dividend | | 33.16 | 50 | 0.45 | 0.45 | 1.97% |
| EMIF | Emerging Markets Infrastructure | | 21.87 | 60 | 1.16 | 2.29 | 2.2% |
| CEW | Emerging Currency Strat | | 17.61 | 13 | -0.03 | 0.03 | -2.19% |
| EBND | Em Mkts Lcl | | 19.92 | 20 | -0.50 | -0.05 | -6.21% |
| EMCB | Emerging Markets Corp | | 63.88 | 23 | -0.38 | 0.45 | -0.04% |
| VWOB | Emerging Mkts Govt | | 62.26 | 30 | -0.73 | -0.11 | -2.34% |
| EEMA | Emerging Markets Asia | | 67.73 | 68 | 0.37 | 2.48 | 2.45% |
| EELV | Em Mkts Low | | 23.30 | 31 | -0.69 | 0.6 | -3.08% |
| DVYE | Emerging Markets Dividend | | 26.50 | 70 | -0.23 | 0.08 | 0.04% |
| SDEM | SuperDividend Em Mkts | | 25.24 | 36 | -0.24 | -2.4 | 1.79% |
| DBEM | Em Mkts Hdgd | | 23.64 | 60 | 0.42 | 2.34 | 2.47% |
| PCY | Emerging Markets Sov | | 19.68 | 25 | -1.00 | -0.65 | -4.55% |
| QEMM | Emerging Mkts StratcFacts | | 56.67 | 41 | -0.46 | 0.91 | -0.85% |
| 12Stocks.com: Charts, Trends, Fundamental Data and Performances of Emerging Markets Stocks | |
|
We now take in-depth look at all Emerging Markets stocks including charts, multi-period performances and overall trends (as measured by Smart Investing & Trading Score ). One can sort Emerging Markets stocks (click link to choose) by Daily, Weekly and by Year-to-Date performances. Also, one can sort by size of the company or by market capitalization. |
| Select Your Default Chart Type: | |||||
| |||||
| Click on stock symbol or name for detailed view. Click on to add stock symbol to your watchlist and to view watchlist. Quick View: Move mouse or cursor over "Daily" to quickly view daily technical stock chart and over "Weekly" to view weekly technical stock chart. | |||||

 | UXIN Uxin Limited |
| Sector: Technology | |
| SubSector: Internet Information Providers | |
| MarketCap: 414.58 Millions | |
| Recent Price: 1.97 Smart Investing & Trading Score : 39 | |
| Day Percent Change: 18.37% Day Change: 0.31 | |
| Week Change: 16.27% Year-to-date Change: 180.3% | |
| UXIN Links: Profile News Message Board | |
| Charts:- Daily , Weekly | |
| Add UXIN to Watchlist: View: Get Complete UXIN Trend Analysis ➞ | |
 | HSAI Hesai Group |
| Sector: Services & Goods | |
| SubSector: Auto Parts | |
| MarketCap: 1330 Millions | |
| Recent Price: 4.34 Smart Investing & Trading Score : 37 | |
| Day Percent Change: 2.48% Day Change: 0.10 | |
| Week Change: 9.32% Year-to-date Change: -52.2% | |
| HSAI Links: Profile News Message Board | |
| Charts:- Daily , Weekly | |
| Add HSAI to Watchlist: View: Get Complete HSAI Trend Analysis ➞ | |
 | FENG Phoenix New Media Limited |
| Sector: Technology | |
| SubSector: Internet Information Providers | |
| MarketCap: 107.08 Millions | |
| Recent Price: 1.75 Smart Investing & Trading Score : 36 | |
| Day Percent Change: -3.85% Day Change: -0.07 | |
| Week Change: -3.85% Year-to-date Change: 28.7% | |
| FENG Links: Profile News Message Board | |
| Charts:- Daily , Weekly | |
| Add FENG to Watchlist: View: Get Complete FENG Trend Analysis ➞ | |
 | SUZ Suzano S.A. |
| Sector: Consumer Staples | |
| SubSector: Paper & Paper Products | |
| MarketCap: 7042.93 Millions | |
| Recent Price: 11.69 Smart Investing & Trading Score : 36 | |
| Day Percent Change: -0.47% Day Change: -0.05 | |
| Week Change: -0.89% Year-to-date Change: 2.9% | |
| SUZ Links: Profile News Message Board | |
| Charts:- Daily , Weekly | |
| Add SUZ to Watchlist: View: Get Complete SUZ Trend Analysis ➞ | |
 | DRD DRDGOLD Limited |
| Sector: Materials | |
| SubSector: Gold | |
| MarketCap: 556.919 Millions | |
| Recent Price: 7.87 Smart Investing & Trading Score : 36 | |
| Day Percent Change: -0.25% Day Change: -0.02 | |
| Week Change: -7.95% Year-to-date Change: -1.0% | |
| DRD Links: Profile News Message Board | |
| Charts:- Daily , Weekly | |
| Add DRD to Watchlist: View: Get Complete DRD Trend Analysis ➞ | |
 | VIV Telefonica Brasil S.A. |
| Sector: Technology | |
| SubSector: Wireless Communications | |
| MarketCap: 19611.1 Millions | |
| Recent Price: 9.41 Smart Investing & Trading Score : 35 | |
| Day Percent Change: 0.27% Day Change: 0.02 | |
| Week Change: 0.7% Year-to-date Change: -13.9% | |
| VIV Links: Profile News Message Board | |
| Charts:- Daily , Weekly | |
| Add VIV to Watchlist: View: Get Complete VIV Trend Analysis ➞ | |
 | QH Quhuo Limited |
| Sector: Technology | |
| SubSector: Software Application | |
| MarketCap: 37787 Millions | |
| Recent Price: 0.61 Smart Investing & Trading Score : 35 | |
| Day Percent Change: 0.00% Day Change: 0.00 | |
| Week Change: -2.94% Year-to-date Change: -58.4% | |
| QH Links: Profile News Message Board | |
| Charts:- Daily , Weekly | |
| Add QH to Watchlist: View: Get Complete QH Trend Analysis ➞ | |
 | VSTA Vasta Platform Limited |
| Sector: Consumer Staples | |
| SubSector: Education & Training Services | |
| MarketCap: 12747 Millions | |
| Recent Price: 3.80 Smart Investing & Trading Score : 35 | |
| Day Percent Change: 0.00% Day Change: 0.00 | |
| Week Change: 1.33% Year-to-date Change: -13.6% | |
| VSTA Links: Profile News Message Board | |
| Charts:- Daily , Weekly | |
| Add VSTA to Watchlist: View: Get Complete VSTA Trend Analysis ➞ | |
 | KRKR 36Kr Holdings Inc. |
| Sector: Technology | |
| SubSector: Internet Information Providers | |
| MarketCap: 173.18 Millions | |
| Recent Price: 0.38 Smart Investing & Trading Score : 35 | |
| Day Percent Change: 0.00% Day Change: 0.00 | |
| Week Change: 4.14% Year-to-date Change: -32.7% | |
| KRKR Links: Profile News Message Board | |
| Charts:- Daily , Weekly | |
| Add KRKR to Watchlist: View: Get Complete KRKR Trend Analysis ➞ | |
 | GDHG Golden Heaven Group Holdings Ltd. |
| Sector: Services & Goods | |
| SubSector: Leisure | |
| MarketCap: 230 Millions | |
| Recent Price: 0.25 Smart Investing & Trading Score : 35 | |
| Day Percent Change: -2.32% Day Change: -0.01 | |
| Week Change: 5.57% Year-to-date Change: -66.0% | |
| GDHG Links: Profile News Message Board | |
| Charts:- Daily , Weekly | |
| Add GDHG to Watchlist: View: Get Complete GDHG Trend Analysis ➞ | |
 | YI 111, Inc. |
| Sector: Services & Goods | |
| SubSector: Drug Stores | |
| MarketCap: 520.351 Millions | |
| Recent Price: 1.07 Smart Investing & Trading Score : 35 | |
| Day Percent Change: -1.83% Day Change: -0.02 | |
| Week Change: 4.9% Year-to-date Change: -31.0% | |
| YI Links: Profile News Message Board | |
| Charts:- Daily , Weekly | |
| Add YI to Watchlist: View: Get Complete YI Trend Analysis ➞ | |
 | INFY Infosys Limited |
| Sector: Technology | |
| SubSector: Information Technology Services | |
| MarketCap: 33819.1 Millions | |
| Recent Price: 17.04 Smart Investing & Trading Score : 35 | |
| Day Percent Change: -0.70% Day Change: -0.12 | |
| Week Change: 1.37% Year-to-date Change: -7.3% | |
| INFY Links: Profile News Message Board | |
| Charts:- Daily , Weekly | |
| Add INFY to Watchlist: View: Get Complete INFY Trend Analysis ➞ | |
 | HYW Hywin Holdings Ltd. |
| Sector: Financials | |
| SubSector: Asset Management | |
| MarketCap: 161 Millions | |
| Recent Price: 0.87 Smart Investing & Trading Score : 35 | |
| Day Percent Change: -0.53% Day Change: 0.00 | |
| Week Change: 8.3% Year-to-date Change: -53.2% | |
| HYW Links: Profile News Message Board | |
| Charts:- Daily , Weekly | |
| Add HYW to Watchlist: View: Get Complete HYW Trend Analysis ➞ | |
 | VTRU Vitru Limited |
| Sector: Consumer Staples | |
| SubSector: Education & Training Services | |
| MarketCap: 33347 Millions | |
| Recent Price: 13.29 Smart Investing & Trading Score : 35 | |
| Day Percent Change: -0.37% Day Change: -0.05 | |
| Week Change: 7.79% Year-to-date Change: -16.0% | |
| VTRU Links: Profile News Message Board | |
| Charts:- Daily , Weekly | |
| Add VTRU to Watchlist: View: Get Complete VTRU Trend Analysis ➞ | |
 | VINP Vinci Partners Investments Ltd. |
| Sector: Financials | |
| SubSector: Asset Management | |
| MarketCap: 537 Millions | |
| Recent Price: 10.48 Smart Investing & Trading Score : 32 | |
| Day Percent Change: 1.75% Day Change: 0.18 | |
| Week Change: 2.24% Year-to-date Change: -4.6% | |
| VINP Links: Profile News Message Board | |
| Charts:- Daily , Weekly | |
| Add VINP to Watchlist: View: Get Complete VINP Trend Analysis ➞ | |
 | UMC United Microelectronics Corporation |
| Sector: Technology | |
| SubSector: Semiconductor Equipment & Materials | |
| MarketCap: 5672.78 Millions | |
| Recent Price: 7.61 Smart Investing & Trading Score : 32 | |
| Day Percent Change: 0.07% Day Change: 0.01 | |
| Week Change: 2.77% Year-to-date Change: -10.1% | |
| UMC Links: Profile News Message Board | |
| Charts:- Daily , Weekly | |
| Add UMC to Watchlist: View: Get Complete UMC Trend Analysis ➞ | |
 | JG Aurora Mobile Limited |
| Sector: Technology | |
| SubSector: Application Software | |
| MarketCap: 268.762 Millions | |
| Recent Price: 3.14 Smart Investing & Trading Score : 32 | |
| Day Percent Change: 0.00% Day Change: 0.00 | |
| Week Change: 7.53% Year-to-date Change: 10.1% | |
| JG Links: Profile News Message Board | |
| Charts:- Daily , Weekly | |
| Add JG to Watchlist: View: Get Complete JG Trend Analysis ➞ | |
 | HIMX Himax Technologies, Inc. |
| Sector: Technology | |
| SubSector: Semiconductor - Specialized | |
| MarketCap: 496.16 Millions | |
| Recent Price: 4.91 Smart Investing & Trading Score : 32 | |
| Day Percent Change: 0.00% Day Change: 0.00 | |
| Week Change: 1.66% Year-to-date Change: -19.1% | |
| HIMX Links: Profile News Message Board | |
| Charts:- Daily , Weekly | |
| Add HIMX to Watchlist: View: Get Complete HIMX Trend Analysis ➞ | |
 | COE China Online Education Group |
| Sector: Services & Goods | |
| SubSector: Education & Training Services | |
| MarketCap: 643.406 Millions | |
| Recent Price: 7.03 Smart Investing & Trading Score : 32 | |
| Day Percent Change: -2.90% Day Change: -0.21 | |
| Week Change: 8.66% Year-to-date Change: -12.5% | |
| COE Links: Profile News Message Board | |
| Charts:- Daily , Weekly | |
| Add COE to Watchlist: View: Get Complete COE Trend Analysis ➞ | |
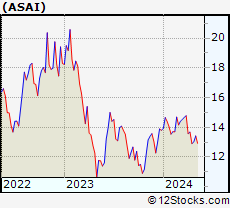 | ASAI Sendas Distribuidora S.A. |
| Sector: Consumer Staples | |
| SubSector: Grocery Stores | |
| MarketCap: 3790 Millions | |
| Recent Price: 13.09 Smart Investing & Trading Score : 32 | |
| Day Percent Change: -2.31% Day Change: -0.31 | |
| Week Change: 1.47% Year-to-date Change: -5.1% | |
| ASAI Links: Profile News Message Board | |
| Charts:- Daily , Weekly | |
| Add ASAI to Watchlist: View: Get Complete ASAI Trend Analysis ➞ | |
 | VTMX Vesta Financials Corp SAB de CV |
| Sector: Financials | |
| SubSector: REIT - Industrial | |
| MarketCap: 2270 Millions | |
| Recent Price: 35.78 Smart Investing & Trading Score : 32 | |
| Day Percent Change: -1.87% Day Change: -0.68 | |
| Week Change: 1.53% Year-to-date Change: -10.0% | |
| VTMX Links: Profile News Message Board | |
| Charts:- Daily , Weekly | |
| Add VTMX to Watchlist: View: Get Complete VTMX Trend Analysis ➞ | |
 | NTES NetEase, Inc. |
| Sector: Technology | |
| SubSector: Internet Software & Services | |
| MarketCap: 40105.1 Millions | |
| Recent Price: 94.11 Smart Investing & Trading Score : 32 | |
| Day Percent Change: 1.12% Day Change: 1.05 | |
| Week Change: 0.65% Year-to-date Change: 1.0% | |
| NTES Links: Profile News Message Board | |
| Charts:- Daily , Weekly | |
| Add NTES to Watchlist: View: Get Complete NTES Trend Analysis ➞ | |
 | UCL uCloudlink Group Inc. |
| Sector: Technology | |
| SubSector: Telecom Services | |
| MarketCap: 35837 Millions | |
| Recent Price: 1.44 Smart Investing & Trading Score : 30 | |
| Day Percent Change: 0.00% Day Change: 0.00 | |
| Week Change: 4.73% Year-to-date Change: -22.2% | |
| UCL Links: Profile News Message Board | |
| Charts:- Daily , Weekly | |
| Add UCL to Watchlist: View: Get Complete UCL Trend Analysis ➞ | |
 | SIM Grupo Simec, S.A.B. de C.V. |
| Sector: Materials | |
| SubSector: Steel & Iron | |
| MarketCap: 1418.28 Millions | |
| Recent Price: 31.00 Smart Investing & Trading Score : 30 | |
| Day Percent Change: -2.52% Day Change: -0.80 | |
| Week Change: 0% Year-to-date Change: -0.6% | |
| SIM Links: Profile News Message Board | |
| Charts:- Daily , Weekly | |
| Add SIM to Watchlist: View: Get Complete SIM Trend Analysis ➞ | |
 | ZLAB Zai Lab Limited |
| Sector: Health Care | |
| SubSector: Biotechnology | |
| MarketCap: 3970.35 Millions | |
| Recent Price: 15.61 Smart Investing & Trading Score : 29 | |
| Day Percent Change: 3.21% Day Change: 0.49 | |
| Week Change: 10.83% Year-to-date Change: -42.9% | |
| ZLAB Links: Profile News Message Board | |
| Charts:- Daily , Weekly | |
| Add ZLAB to Watchlist: View: Get Complete ZLAB Trend Analysis ➞ | |
| For tabular summary view of above stock list: Summary View ➞ 0 - 25 , 25 - 50 , 50 - 75 , 75 - 100 , 100 - 125 , 125 - 150 , 150 - 175 , 175 - 200 | ||
| Click To Change The Sort Order: By Market Cap or Company Size Performance: Year-to-date, Week and Day | |
| Select Chart Type: | ||
|
Best Stocks Today 12Stocks.com |
© 2024 12Stocks.com Terms & Conditions Privacy Contact Us
All Information Provided Only For Education And Not To Be Used For Investing or Trading. See Terms & Conditions


One More Thing ... Get Best Stocks Delivered Daily!
Never Ever Miss A Move With Our Top Ten Stocks Lists
Find Best Stocks In Any Market - Bull or Bear Market
Take A Peek At Our Top Ten Stocks Lists: Daily, Weekly, Year-to-Date & Top Trends
Find Best Stocks In Any Market - Bull or Bear Market
Take A Peek At Our Top Ten Stocks Lists: Daily, Weekly, Year-to-Date & Top Trends
Emerging Markets Stocks With Best Up Trends [0-bearish to 100-bullish]: Yatsen Holding[100], ZTO Express[100], Alibaba [100], Controladora Vuela[100], JD.com [100], Grupo Aeroportuario[100], Full Truck[100], MINISO [100], Grupo Aeroportuario[100], WiMi Hologram[95], Baozun [95]
Best Emerging Markets Stocks Year-to-Date:
U Power[2785.04%], DouYu [802.11%], MicroCloud Hologram[625.18%], China Liberal[498.43%], Yatsen Holding[473.4%], Zhongchao [353.3%], Uxin [180.31%], QuantaSing [105.25%], GigaCloud [102.68%], Cheetah Mobile[80.7%], Yiren Digital[64.74%] Best Emerging Markets Stocks This Week:
WiMi Hologram[29.01%], Aesthetic Medical[21.75%], Bilibili [17.28%], iQIYI [17.01%], Cheetah Mobile[16.38%], Uxin [16.27%], Yatsen Holding[16.04%], GDS [14.24%], Grupo Aeroportuario[13.7%], Baozun [13.36%], Pinduoduo [12.13%] Best Emerging Markets Stocks Daily:
WiMi Hologram[24.07%], Uxin [18.37%], Aesthetic Medical[14.75%], 17 Education[11.49%], Bilibili [11.36%], AMTD Digital[8.33%], Intchains [7.71%], Yatsen Holding[6.74%], GDS [6.65%], 21Vianet [6.08%], TOP Financial[6.05%]