
 Login Sign Up


| |||||
 |  | ||||

| 12Stocks.com Market Intelligence |
Best Emerging Markets Stocks
| In a hurry? Emerging Markets Stocks Lists: Trends Table, Stock Charts
Sort Emerging Markets stocks: Daily, Weekly, Year-to-Date, Market Cap & Trends. Filter Emerging Markets stocks list by sector: Show all, Tech, Finance, Energy, Staples, Retail, Industrial, Materials, Utilities and HealthCare Filter Emerging Markets stocks list by size:All Large Medium Small |
| 12Stocks.com Emerging Markets Stocks Performances & Trends Daily | |||||||||
|
|  The overall Smart Investing & Trading Score is 66 (0-bearish to 100-bullish) which puts Emerging Markets index in short term neutral to bullish trend. The Smart Investing & Trading Score from previous trading session is 100 and hence a deterioration of trend.
| ||||||||
Here are the Smart Investing & Trading Scores of the most requested Emerging Markets stocks at 12Stocks.com (click stock name for detailed review):
|


| 12Stocks.com: Top Performing Emerging Markets Index Stocks | ||||||||||||||||||||||||||||||||||||||||||||||||
 The top performing Emerging Markets Index stocks year to date are
Now, more recently, over last week, the top performing Emerging Markets Index stocks on the move are


|
||||||||||||||||||||||||||||||||||||||||||||||||
| 12Stocks.com: Investing in Emerging Markets Index with Stocks | |
|
The following table helps investors and traders sort through current performance and trends (as measured by Smart Investing & Trading Score ) of various
stocks in the Emerging Markets Index. Quick View: Move mouse or cursor over stock symbol (ticker) to view short-term technical chart and over stock name to view long term chart. Click on  to add stock symbol to your watchlist and to add stock symbol to your watchlist and  to view watchlist. Click on any ticker or stock name for detailed market intelligence report for that stock. to view watchlist. Click on any ticker or stock name for detailed market intelligence report for that stock. |
12Stocks.com Performance of Stocks in Emerging Markets Index
| Ticker | Stock Name | Watchlist | Category | Recent Price | Smart Investing & Trading Score | Change % | YTD Change% |
| DRD | DRDGOLD |   | Materials | 7.80 | 36 | -6.25 | -1.89% |
| ZCMD | Zhongchao | | Health Care | 1.60 | 41 | -6.32 | 338.78% |
| EDU | New Oriental | | Services & Goods | 77.10 | 13 | -6.33 | 5.21% |
| GCT | GigaCloud | | Technology | 31.79 | 36 | -6.44 | 73.62% |
| XNET | Xunlei | | Technology | 1.53 | 32 | -6.71 | -5.56% |
| HTHT | Huazhu | | Services & Goods | 36.71 | 36 | -6.87 | 9.78% |
| BAK | Braskem S.A | | Materials | 8.20 | 15 | -7.03 | -7.03% |
| TV | Grupo Televisa | | Services & Goods | 2.92 | 10 | -7.59 | -12.57% |
| YQ | 17 Education | | Consumer Staples | 2.67 | 41 | -8.00 | 30.78% |
| SBSW | Sibanye Stillwater | | Materials | 4.65 | 17 | -8.28 | -14.36% |
| YUMC | Yum China | | Services & Goods | 36.51 | 36 | -8.82 | -13.95% |
| WIMI | WiMi Hologram | | Technology | 0.93 | 56 | -8.92 | 15.40% |
| FANH | Fanhua | | Financials | 3.20 | 0 | -9.60 | -51.88% |
| GFI | Gold Fields | | Materials | 16.17 | 36 | -9.61 | 11.83% |
| BNR | Burning Rock | | Health Care | 0.76 | 13 | -9.73 | -21.74% |
| DQ | Daqo New | | Technology | 19.20 | 36 | -10.90 | -27.82% |
| QSG | QuantaSing | | Consumer Staples | 3.01 | 10 | -11.21 | 85.80% |
| ICG | Intchains | | Technology | 6.85 | 0 | -15.22 | -44.31% |
| For chart view version of above stock list: Chart View ➞ 0 - 25 , 25 - 50 , 50 - 75 , 75 - 100 , 100 - 125 , 125 - 150 , 150 - 175 , 175 - 200 | ||
 | Click To Change The Sort Order: By Market Cap or Company Size Performance: Year-to-date, Week and Day |  |
|
Get the most comprehensive stock market coverage daily at 12Stocks.com ➞ Best Stocks Today ➞ Best Stocks Weekly ➞ Best Stocks Year-to-Date ➞ Best Stocks Trends ➞  Best Stocks Today 12Stocks.com Best Nasdaq Stocks ➞ Best S&P 500 Stocks ➞ Best Tech Stocks ➞ Best Biotech Stocks ➞ |
| Detailed Overview of Emerging Markets Stocks |
| Emerging Markets Technical Overview, Leaders & Laggards, Top Emerging Markets ETF Funds & Detailed Emerging Markets Stocks List, Charts, Trends & More |
| Emerging Markets: Technical Analysis, Trends & YTD Performance | |
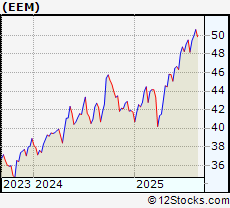
 EEM Weekly Chart |
|
| Long Term Trend: Very Good | |
| Medium Term Trend: Very Good | |
 EEM Daily Chart |
|
| Short Term Trend: Very Good | |
| Overall Trend Score: 66 | |
| YTD Performance: 1.94% | |
| **Trend Scores & Views Are Only For Educational Purposes And Not For Investing | |
| 12Stocks.com: Investing in Emerging Markets Index using Exchange Traded Funds | |
|
The following table shows list of key exchange traded funds (ETF) that
help investors play Emerging Markets stock market. For detailed view, check out our ETF Funds section of our website. Quick View: Move mouse or cursor over ETF symbol (ticker) to view short-term technical chart and over ETF name to view long term chart. Click on ticker or stock name for detailed view. Click on to add stock symbol to your watchlist and to view watchlist. |
12Stocks.com List of ETFs that track Emerging Markets Index
| Ticker | ETF Name | Watchlist | Recent Price | Smart Investing & Trading Score | Change % | Week % | Year-to-date % |
| EEM | Emerging Markets | | 40.99 | 66 | -1.40 | -0.44 | 1.94% |
| VWO | Emerging Markets | | 42.17 | 83 | -1.33 | -0.35 | 2.6% |
| SCHE | Emerging Markets Equity | | 25.46 | 76 | -1.39 | -0.43 | 2.7% |
| EWX | Emerging Markets Small | | 56.73 | 93 | -0.77 | 0.18 | 0.48% |
| EET | Emerging Markets | | 50.72 | 83 | -2.80 | -1.01 | -0.28% |
| EDC | Emrg Mkts Bull | | 29.61 | 88 | -4.24 | -1.33 | -2.69% |
| EEV | Short Emerging | | 19.14 | 7 | 2.19 | -0.44 | -2.96% |
| EUM | Short Emerging | | 14.06 | 35 | 1.33 | 0.5 | -0.67% |
| EDIV | Emerging Markets Dividend | | 33.77 | 88 | -0.82 | 0.48 | 3.84% |
| EMIF | Emerging Markets Infrastructure | | 22.03 | 71 | -0.72 | -0.41 | 2.94% |
| CEW | Emerging Currency Strat | | 17.69 | 25 | -0.35 | 0.06 | -1.75% |
| EBND | Em Mkts Lcl | | 19.88 | 10 | -0.75 | -0.35 | -6.4% |
| EMCB | Emerging Markets Corp | | 63.86 | 45 | 0.18 | 0.23 | -0.06% |
| VWOB | Emerging Mkts Govt | | 62.19 | 22 | -0.84 | -0.34 | -2.45% |
| EEMA | Emerging Markets Asia | | 68.33 | 66 | -1.16 | -0.61 | 3.36% |
| EELV | Em Mkts Low | | 23.48 | 63 | -1.26 | 0.3 | -2.33% |
| DVYE | Emerging Markets Dividend | | 27.06 | 83 | -1.35 | 0.33 | 2.15% |
| SDEM | SuperDividend Em Mkts | | 25.55 | 66 | -1.22 | 0.12 | 3.04% |
| DBEM | Em Mkts Hdgd | | 23.90 | 76 | -0.91 | -0.25 | 3.6% |
| PCY | Emerging Markets Sov | | 19.63 | 15 | -1.26 | -0.56 | -4.8% |
| QEMM | Emerging Mkts StratcFacts | | 57.27 | 63 | -0.97 | -0.12 | 0.2% |
| 12Stocks.com: Charts, Trends, Fundamental Data and Performances of Emerging Markets Stocks | |
|
We now take in-depth look at all Emerging Markets stocks including charts, multi-period performances and overall trends (as measured by Smart Investing & Trading Score ). One can sort Emerging Markets stocks (click link to choose) by Daily, Weekly and by Year-to-Date performances. Also, one can sort by size of the company or by market capitalization. |
| Select Your Default Chart Type: | |||||
| |||||
| Click on stock symbol or name for detailed view. Click on to add stock symbol to your watchlist and to view watchlist. Quick View: Move mouse or cursor over "Daily" to quickly view daily technical stock chart and over "Weekly" to view weekly technical stock chart. | |||||

 | DRD DRDGOLD Limited |
| Sector: Materials | |
| SubSector: Gold | |
| MarketCap: 556.919 Millions | |
| Recent Price: 7.80 Smart Investing & Trading Score : 36 | |
| Day Percent Change: -6.25% Day Change: -0.52 | |
| Week Change: -6.36% Year-to-date Change: -1.9% | |
| DRD Links: Profile News Message Board | |
| Charts:- Daily , Weekly | |
| Add DRD to Watchlist: View: Get Complete DRD Trend Analysis ➞ | |
 | ZCMD Zhongchao Inc. |
| Sector: Health Care | |
| SubSector: Health Information Services | |
| MarketCap: 41487 Millions | |
| Recent Price: 1.60 Smart Investing & Trading Score : 41 | |
| Day Percent Change: -6.32% Day Change: -0.11 | |
| Week Change: -5.21% Year-to-date Change: 338.8% | |
| ZCMD Links: Profile News Message Board | |
| Charts:- Daily , Weekly | |
| Add ZCMD to Watchlist: View: Get Complete ZCMD Trend Analysis ➞ | |
 | EDU New Oriental Education & Technology Group Inc. |
| Sector: Services & Goods | |
| SubSector: Education & Training Services | |
| MarketCap: 18673.7 Millions | |
| Recent Price: 77.10 Smart Investing & Trading Score : 13 | |
| Day Percent Change: -6.33% Day Change: -5.21 | |
| Week Change: -7.4% Year-to-date Change: 5.2% | |
| EDU Links: Profile News Message Board | |
| Charts:- Daily , Weekly | |
| Add EDU to Watchlist: View: Get Complete EDU Trend Analysis ➞ | |
 | GCT GigaCloud Technology Inc. |
| Sector: Technology | |
| SubSector: Software - Infrastructure | |
| MarketCap: 240 Millions | |
| Recent Price: 31.79 Smart Investing & Trading Score : 36 | |
| Day Percent Change: -6.44% Day Change: -2.19 | |
| Week Change: -10.07% Year-to-date Change: 73.6% | |
| GCT Links: Profile News Message Board | |
| Charts:- Daily , Weekly | |
| Add GCT to Watchlist: View: Get Complete GCT Trend Analysis ➞ | |
 | XNET Xunlei Limited |
| Sector: Technology | |
| SubSector: Application Software | |
| MarketCap: 203.662 Millions | |
| Recent Price: 1.53 Smart Investing & Trading Score : 32 | |
| Day Percent Change: -6.71% Day Change: -0.11 | |
| Week Change: -2.24% Year-to-date Change: -5.6% | |
| XNET Links: Profile News Message Board | |
| Charts:- Daily , Weekly | |
| Add XNET to Watchlist: View: Get Complete XNET Trend Analysis ➞ | |
 | HTHT Huazhu Group Limited |
| Sector: Services & Goods | |
| SubSector: Lodging | |
| MarketCap: 9164.46 Millions | |
| Recent Price: 36.71 Smart Investing & Trading Score : 36 | |
| Day Percent Change: -6.87% Day Change: -2.71 | |
| Week Change: -8.36% Year-to-date Change: 9.8% | |
| HTHT Links: Profile News Message Board | |
| Charts:- Daily , Weekly | |
| Add HTHT to Watchlist: View: Get Complete HTHT Trend Analysis ➞ | |
 | BAK Braskem S.A. |
| Sector: Materials | |
| SubSector: Chemicals - Major Diversified | |
| MarketCap: 2715.86 Millions | |
| Recent Price: 8.20 Smart Investing & Trading Score : 15 | |
| Day Percent Change: -7.03% Day Change: -0.62 | |
| Week Change: -8.28% Year-to-date Change: -7.0% | |
| BAK Links: Profile News Message Board | |
| Charts:- Daily , Weekly | |
| Add BAK to Watchlist: View: Get Complete BAK Trend Analysis ➞ | |
 | TV Grupo Televisa, S.A.B. |
| Sector: Services & Goods | |
| SubSector: Broadcasting - TV | |
| MarketCap: 3740.43 Millions | |
| Recent Price: 2.92 Smart Investing & Trading Score : 10 | |
| Day Percent Change: -7.59% Day Change: -0.24 | |
| Week Change: -7.59% Year-to-date Change: -12.6% | |
| TV Links: Profile News Message Board | |
| Charts:- Daily , Weekly | |
| Add TV to Watchlist: View: Get Complete TV Trend Analysis ➞ | |
 | YQ 17 Education & Technology Group Inc. |
| Sector: Consumer Staples | |
| SubSector: Education & Training Services | |
| MarketCap: 32347 Millions | |
| Recent Price: 2.67 Smart Investing & Trading Score : 41 | |
| Day Percent Change: -8.00% Day Change: -0.23 | |
| Week Change: -7.68% Year-to-date Change: 30.8% | |
| YQ Links: Profile News Message Board | |
| Charts:- Daily , Weekly | |
| Add YQ to Watchlist: View: Get Complete YQ Trend Analysis ➞ | |
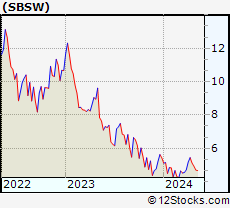 | SBSW Sibanye Stillwater Limited |
| Sector: Materials | |
| SubSector: Gold | |
| MarketCap: 3853.99 Millions | |
| Recent Price: 4.65 Smart Investing & Trading Score : 17 | |
| Day Percent Change: -8.28% Day Change: -0.42 | |
| Week Change: -5.68% Year-to-date Change: -14.4% | |
| SBSW Links: Profile News Message Board | |
| Charts:- Daily , Weekly | |
| Add SBSW to Watchlist: View: Get Complete SBSW Trend Analysis ➞ | |
 | YUMC Yum China Holdings, Inc. |
| Sector: Services & Goods | |
| SubSector: Restaurants | |
| MarketCap: 16284.5 Millions | |
| Recent Price: 36.51 Smart Investing & Trading Score : 36 | |
| Day Percent Change: -8.82% Day Change: -3.53 | |
| Week Change: -7.92% Year-to-date Change: -14.0% | |
| YUMC Links: Profile News Message Board | |
| Charts:- Daily , Weekly | |
| Add YUMC to Watchlist: View: Get Complete YUMC Trend Analysis ➞ | |
 | WIMI WiMi Hologram Cloud Inc. |
| Sector: Technology | |
| SubSector: Advertising Agencies | |
| MarketCap: 41837 Millions | |
| Recent Price: 0.93 Smart Investing & Trading Score : 56 | |
| Day Percent Change: -8.92% Day Change: -0.09 | |
| Week Change: -8.92% Year-to-date Change: 15.4% | |
| WIMI Links: Profile News Message Board | |
| Charts:- Daily , Weekly | |
| Add WIMI to Watchlist: View: Get Complete WIMI Trend Analysis ➞ | |
 | FANH Fanhua Inc. |
| Sector: Financials | |
| SubSector: Insurance Brokers | |
| MarketCap: 1436.67 Millions | |
| Recent Price: 3.20 Smart Investing & Trading Score : 0 | |
| Day Percent Change: -9.60% Day Change: -0.34 | |
| Week Change: -6.43% Year-to-date Change: -51.9% | |
| FANH Links: Profile News Message Board | |
| Charts:- Daily , Weekly | |
| Add FANH to Watchlist: View: Get Complete FANH Trend Analysis ➞ | |
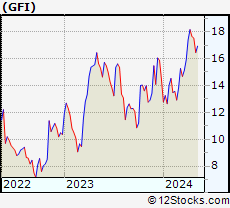 | GFI Gold Fields Limited |
| Sector: Materials | |
| SubSector: Gold | |
| MarketCap: 4908.39 Millions | |
| Recent Price: 16.17 Smart Investing & Trading Score : 36 | |
| Day Percent Change: -9.61% Day Change: -1.72 | |
| Week Change: -7.76% Year-to-date Change: 11.8% | |
| GFI Links: Profile News Message Board | |
| Charts:- Daily , Weekly | |
| Add GFI to Watchlist: View: Get Complete GFI Trend Analysis ➞ | |
 | BNR Burning Rock Biotech Limited |
| Sector: Health Care | |
| SubSector: Diagnostics & Research | |
| MarketCap: 27887 Millions | |
| Recent Price: 0.76 Smart Investing & Trading Score : 13 | |
| Day Percent Change: -9.73% Day Change: -0.08 | |
| Week Change: -11.16% Year-to-date Change: -21.7% | |
| BNR Links: Profile News Message Board | |
| Charts:- Daily , Weekly | |
| Add BNR to Watchlist: View: Get Complete BNR Trend Analysis ➞ | |
 | DQ Daqo New Energy Corp. |
| Sector: Technology | |
| SubSector: Semiconductor Equipment & Materials | |
| MarketCap: 660.918 Millions | |
| Recent Price: 19.20 Smart Investing & Trading Score : 36 | |
| Day Percent Change: -10.90% Day Change: -2.35 | |
| Week Change: -19.12% Year-to-date Change: -27.8% | |
| DQ Links: Profile News Message Board | |
| Charts:- Daily , Weekly | |
| Add DQ to Watchlist: View: Get Complete DQ Trend Analysis ➞ | |
 | QSG QuantaSing Group Limited |
| Sector: Consumer Staples | |
| SubSector: Education & Training Services | |
| MarketCap: 433 Millions | |
| Recent Price: 3.01 Smart Investing & Trading Score : 10 | |
| Day Percent Change: -11.21% Day Change: -0.38 | |
| Week Change: -12.24% Year-to-date Change: 85.8% | |
| QSG Links: Profile News Message Board | |
| Charts:- Daily , Weekly | |
| Add QSG to Watchlist: View: Get Complete QSG Trend Analysis ➞ | |
 | ICG Intchains Group Limited |
| Sector: Technology | |
| SubSector: Semiconductors | |
| MarketCap: 450 Millions | |
| Recent Price: 6.85 Smart Investing & Trading Score : 0 | |
| Day Percent Change: -15.22% Day Change: -1.23 | |
| Week Change: -21.62% Year-to-date Change: -44.3% | |
| ICG Links: Profile News Message Board | |
| Charts:- Daily , Weekly | |
| Add ICG to Watchlist: View: Get Complete ICG Trend Analysis ➞ | |
| For tabular summary view of above stock list: Summary View ➞ 0 - 25 , 25 - 50 , 50 - 75 , 75 - 100 , 100 - 125 , 125 - 150 , 150 - 175 , 175 - 200 | ||
| Click To Change The Sort Order: By Market Cap or Company Size Performance: Year-to-date, Week and Day | |
| Select Chart Type: | ||
|
Best Stocks Today 12Stocks.com |
© 2024 12Stocks.com Terms & Conditions Privacy Contact Us
All Information Provided Only For Education And Not To Be Used For Investing or Trading. See Terms & Conditions


One More Thing ... Get Best Stocks Delivered Daily!
Never Ever Miss A Move With Our Top Ten Stocks Lists
Find Best Stocks In Any Market - Bull or Bear Market
Take A Peek At Our Top Ten Stocks Lists: Daily, Weekly, Year-to-Date & Top Trends
Find Best Stocks In Any Market - Bull or Bear Market
Take A Peek At Our Top Ten Stocks Lists: Daily, Weekly, Year-to-Date & Top Trends
Emerging Markets Stocks With Best Up Trends [0-bearish to 100-bullish]: Smart Share[100], ATRenew [100], Grupo Aeroportuario[100], America Movil[100], GDS [100], MOGU [93], ICICI Bank[93], Niu [93], BeiGene [93], Grupo Aeroportuario[90], Kanzhun [90]
Best Emerging Markets Stocks Year-to-Date:
U Power[2891.07%], DouYu [803.16%], MicroCloud Hologram[628.06%], China Liberal[504.03%], Yatsen Holding[497.32%], Zhongchao [338.78%], Uxin [163.91%], QuantaSing [85.8%], GigaCloud [73.62%], Cheetah Mobile[71.49%], Yiren Digital[61.54%] Best Emerging Markets Stocks This Week:
Golden Heaven[22.28%], Lixiang Education[20.85%], Viomi [16.39%], Smart Share[14.54%], Lanvin [13.92%], uCloudlink [9.49%], MOGU [9.03%], Dingdong (Cayman)[8.73%], SunCar [8.68%], China Online[7.72%], 21Vianet [6.96%] Best Emerging Markets Stocks Daily:
Golden Heaven[25.92%], Lanvin [19.21%], Regencell Bioscience[13.33%], Smart Share[11.15%], MOGU [10.22%], Skillful Craftsman[7.89%], China Online[6.43%], Sunlands [6.39%], Yunji [5.43%], OneConnect Financial[5.18%], Cango [4.90%]