
 Login Sign Up


| |||||
 |  | ||||

| 12Stocks.com Market Intelligence |
Best Emerging Markets Stocks
| In a hurry? Emerging Markets Stocks Lists: Trends Table, Stock Charts
Sort Emerging Markets stocks: Daily, Weekly, Year-to-Date, Market Cap & Trends. Filter Emerging Markets stocks list by sector: Show all, Tech, Finance, Energy, Staples, Retail, Industrial, Materials, Utilities and HealthCare Filter Emerging Markets stocks list by size:All Large Medium Small |
| 12Stocks.com Emerging Markets Stocks Performances & Trends Daily | |||||||||
|
|  The overall Smart Investing & Trading Score is 68 (0-bearish to 100-bullish) which puts Emerging Markets index in short term neutral to bullish trend. The Smart Investing & Trading Score from previous trading session is 63 and an improvement of trend continues.
| ||||||||
Here are the Smart Investing & Trading Scores of the most requested Emerging Markets stocks at 12Stocks.com (click stock name for detailed review):
|


| 12Stocks.com: Top Performing Emerging Markets Index Stocks | ||||||||||||||||||||||||||||||||||||||||||||||||
 The top performing Emerging Markets Index stocks year to date are
Now, more recently, over last week, the top performing Emerging Markets Index stocks on the move are


|
||||||||||||||||||||||||||||||||||||||||||||||||
| 12Stocks.com: Investing in Emerging Markets Index with Stocks | |
|
The following table helps investors and traders sort through current performance and trends (as measured by Smart Investing & Trading Score ) of various
stocks in the Emerging Markets Index. Quick View: Move mouse or cursor over stock symbol (ticker) to view short-term technical chart and over stock name to view long term chart. Click on  to add stock symbol to your watchlist and to add stock symbol to your watchlist and  to view watchlist. Click on any ticker or stock name for detailed market intelligence report for that stock. to view watchlist. Click on any ticker or stock name for detailed market intelligence report for that stock. |
12Stocks.com Performance of Stocks in Emerging Markets Index
| Ticker | Stock Name | Watchlist | Category | Recent Price | Smart Investing & Trading Score | Change % | YTD Change% |
| IBN | ICICI Bank |   | Financials | 26.19 | 90 | -0.38 | 9.86% |
| QD | Qudian | | Technology | 2.46 | 95 | -0.40 | 20.59% |
| CIG | Companhia Energetica | | Utilities | 2.46 | 54 | -0.40 | 6.03% |
| FMX | Fomento Economico | | Consumer Staples | 115.90 | 10 | -0.41 | -11.09% |
| HYW | Hywin | | Financials | 0.87 | 35 | -0.53 | -53.17% |
| RC | Ready Capital | | Financials | 8.82 | 60 | -0.56 | -13.95% |
| ITUB | Itau Unibanco | | Financials | 6.21 | 42 | -0.64 | -10.65% |
| GGR | Gogoro | | Services & Goods | 1.49 | 45 | -0.67 | -42.69% |
| SBS | Companhia de | | Utilities | 16.03 | 62 | -0.68 | 5.25% |
| OMAB | Grupo Aeroportuario | | Transports | 81.06 | 85 | -0.70 | -4.22% |
| INFY | Infosys | | Technology | 17.04 | 35 | -0.70 | -7.29% |
| WIT | Wipro | | Technology | 5.47 | 42 | -0.73 | -1.80% |
| CSAN | Cosan S.A | | Energy | 11.16 | 42 | -0.80 | -29.17% |
| RDY | Dr. Reddy | | Health Care | 70.92 | 25 | -0.80 | 1.93% |
| CNF | CNFinance | | Financials | 1.82 | 10 | -0.82 | -18.02% |
| BBDO | Banco Bradesco | | Financials | 2.33 | 27 | -0.85 | -26.89% |
| PBR | Petroleo Brasileiro | | Energy | 16.81 | 69 | -0.88 | 5.26% |
| DRD | DRDGOLD | | Materials | 7.82 | 36 | -0.89 | -1.64% |
| CHT | Chunghwa Telecom | | Technology | 38.24 | 51 | -0.91 | -2.12% |
| BAK | Braskem S.A | | Materials | 8.80 | 22 | -1.01 | -0.23% |
| EBON | Ebang | | Technology | 7.89 | 17 | -1.13 | -48.35% |
| BRFS | BRF S.A | | Consumer Staples | 3.39 | 75 | -1.17 | 21.94% |
| DDL | Dingdong (Cayman) | | Consumer Staples | 1.21 | 54 | -1.23 | -20.72% |
| PAC | Grupo Aeroportuario | | Transports | 176.15 | 100 | -1.29 | 0.53% |
| XYF | X Financial | | Financials | 3.83 | 25 | -1.34 | 4.64% |
| For chart view version of above stock list: Chart View ➞ 0 - 25 , 25 - 50 , 50 - 75 , 75 - 100 , 100 - 125 , 125 - 150 , 150 - 175 , 175 - 200 | ||
 | Click To Change The Sort Order: By Market Cap or Company Size Performance: Year-to-date, Week and Day |  |
|
Get the most comprehensive stock market coverage daily at 12Stocks.com ➞ Best Stocks Today ➞ Best Stocks Weekly ➞ Best Stocks Year-to-Date ➞ Best Stocks Trends ➞  Best Stocks Today 12Stocks.com Best Nasdaq Stocks ➞ Best S&P 500 Stocks ➞ Best Tech Stocks ➞ Best Biotech Stocks ➞ |
| Detailed Overview of Emerging Markets Stocks |
| Emerging Markets Technical Overview, Leaders & Laggards, Top Emerging Markets ETF Funds & Detailed Emerging Markets Stocks List, Charts, Trends & More |
| Emerging Markets: Technical Analysis, Trends & YTD Performance | |
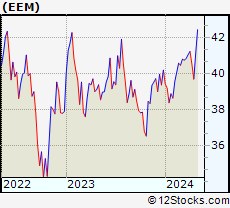
 EEM Weekly Chart |
|
| Long Term Trend: Very Good | |
| Medium Term Trend: Not Good | |
 EEM Daily Chart |
|
| Short Term Trend: Very Good | |
| Overall Trend Score: 68 | |
| YTD Performance: 0.99% | |
| **Trend Scores & Views Are Only For Educational Purposes And Not For Investing | |
| 12Stocks.com: Investing in Emerging Markets Index using Exchange Traded Funds | |
|
The following table shows list of key exchange traded funds (ETF) that
help investors play Emerging Markets stock market. For detailed view, check out our ETF Funds section of our website. Quick View: Move mouse or cursor over ETF symbol (ticker) to view short-term technical chart and over ETF name to view long term chart. Click on ticker or stock name for detailed view. Click on to add stock symbol to your watchlist and to view watchlist. |
12Stocks.com List of ETFs that track Emerging Markets Index
| Ticker | ETF Name | Watchlist | Recent Price | Smart Investing & Trading Score | Change % | Week % | Year-to-date % |
| EEM | Emerging Markets | | 40.61 | 68 | 0.35 | 2.27 | 0.99% |
| VWO | Emerging Markets | | 41.71 | 68 | 0.31 | 2.01 | 1.48% |
| SCHE | Emerging Markets Equity | | 25.20 | 68 | 0.40 | 2.07 | 1.65% |
| EWX | Emerging Markets Small | | 55.80 | 43 | 0.23 | 1.14 | -1.17% |
| EET | Emerging Markets | | 49.90 | 68 | 1.18 | 4.58 | -1.89% |
| EDC | Emrg Mkts Bull | | 28.91 | 63 | 0.84 | 6.8 | -5% |
| EEV | Short Emerging | | 19.69 | 32 | -0.35 | -4.03 | -0.17% |
| EUM | Short Emerging | | 14.16 | 32 | -0.44 | -2.29 | 0.07% |
| EDIV | Emerging Markets Dividend | | 33.15 | 50 | 0.42 | 0.42 | 1.94% |
| EMIF | Emerging Markets Infrastructure | | 21.87 | 60 | 1.16 | 2.29 | 2.2% |
| CEW | Emerging Currency Strat | | 17.66 | 20 | 0.26 | 0.31 | -1.92% |
| EBND | Em Mkts Lcl | | 19.92 | 20 | -0.50 | -0.05 | -6.21% |
| EMCB | Emerging Markets Corp | | 63.38 | 23 | -1.15 | -0.33 | -0.81% |
| VWOB | Emerging Mkts Govt | | 62.35 | 30 | -0.59 | 0.03 | -2.2% |
| EEMA | Emerging Markets Asia | | 67.83 | 68 | 0.51 | 2.63 | 2.6% |
| EELV | Em Mkts Low | | 23.29 | 31 | -0.74 | 0.56 | -3.12% |
| DVYE | Emerging Markets Dividend | | 26.53 | 70 | -0.11 | 0.19 | 0.15% |
| SDEM | SuperDividend Em Mkts | | 25.28 | 36 | -0.08 | -2.24 | 1.95% |
| DBEM | Em Mkts Hdgd | | 23.71 | 60 | 0.71 | 2.63 | 2.76% |
| PCY | Emerging Markets Sov | | 19.70 | 25 | -0.91 | -0.56 | -4.46% |
| QEMM | Emerging Mkts StratcFacts | | 56.76 | 41 | -0.31 | 1.06 | -0.7% |
| 12Stocks.com: Charts, Trends, Fundamental Data and Performances of Emerging Markets Stocks | |
|
We now take in-depth look at all Emerging Markets stocks including charts, multi-period performances and overall trends (as measured by Smart Investing & Trading Score ). One can sort Emerging Markets stocks (click link to choose) by Daily, Weekly and by Year-to-Date performances. Also, one can sort by size of the company or by market capitalization. |
| Select Your Default Chart Type: | |||||
| |||||
| Click on stock symbol or name for detailed view. Click on to add stock symbol to your watchlist and to view watchlist. Quick View: Move mouse or cursor over "Daily" to quickly view daily technical stock chart and over "Weekly" to view weekly technical stock chart. | |||||

 | IBN ICICI Bank Limited |
| Sector: Financials | |
| SubSector: Money Center Banks | |
| MarketCap: 31194.1 Millions | |
| Recent Price: 26.19 Smart Investing & Trading Score : 90 | |
| Day Percent Change: -0.38% Day Change: -0.10 | |
| Week Change: 1.99% Year-to-date Change: 9.9% | |
| IBN Links: Profile News Message Board | |
| Charts:- Daily , Weekly | |
| Add IBN to Watchlist: View: Get Complete IBN Trend Analysis ➞ | |
 | QD Qudian Inc. |
| Sector: Technology | |
| SubSector: Information Technology Services | |
| MarketCap: 544.968 Millions | |
| Recent Price: 2.46 Smart Investing & Trading Score : 95 | |
| Day Percent Change: -0.40% Day Change: -0.01 | |
| Week Change: 7.89% Year-to-date Change: 20.6% | |
| QD Links: Profile News Message Board | |
| Charts:- Daily , Weekly | |
| Add QD to Watchlist: View: Get Complete QD Trend Analysis ➞ | |
 | CIG Companhia Energetica de Minas Gerais |
| Sector: Utilities | |
| SubSector: Electric Utilities | |
| MarketCap: 3203.54 Millions | |
| Recent Price: 2.46 Smart Investing & Trading Score : 54 | |
| Day Percent Change: -0.40% Day Change: -0.01 | |
| Week Change: -0.81% Year-to-date Change: 6.0% | |
| CIG Links: Profile News Message Board | |
| Charts:- Daily , Weekly | |
| Add CIG to Watchlist: View: Get Complete CIG Trend Analysis ➞ | |
 | FMX Fomento Economico Mexicano, S.A.B. de C.V. |
| Sector: Consumer Staples | |
| SubSector: Beverages - Brewers | |
| MarketCap: 22018.7 Millions | |
| Recent Price: 115.90 Smart Investing & Trading Score : 10 | |
| Day Percent Change: -0.41% Day Change: -0.48 | |
| Week Change: -3.17% Year-to-date Change: -11.1% | |
| FMX Links: Profile News Message Board | |
| Charts:- Daily , Weekly | |
| Add FMX to Watchlist: View: Get Complete FMX Trend Analysis ➞ | |
 | HYW Hywin Holdings Ltd. |
| Sector: Financials | |
| SubSector: Asset Management | |
| MarketCap: 161 Millions | |
| Recent Price: 0.87 Smart Investing & Trading Score : 35 | |
| Day Percent Change: -0.53% Day Change: 0.00 | |
| Week Change: 8.3% Year-to-date Change: -53.2% | |
| HYW Links: Profile News Message Board | |
| Charts:- Daily , Weekly | |
| Add HYW to Watchlist: View: Get Complete HYW Trend Analysis ➞ | |
 | RC Ready Capital Corporation |
| Sector: Financials | |
| SubSector: Mortgage Investment | |
| MarketCap: 358.039 Millions | |
| Recent Price: 8.82 Smart Investing & Trading Score : 60 | |
| Day Percent Change: -0.56% Day Change: -0.05 | |
| Week Change: 2.32% Year-to-date Change: -14.0% | |
| RC Links: Profile News Message Board | |
| Charts:- Daily , Weekly | |
| Add RC to Watchlist: View: Get Complete RC Trend Analysis ➞ | |
 | ITUB Itau Unibanco Holding S.A. |
| Sector: Financials | |
| SubSector: Foreign Regional Banks | |
| MarketCap: 48121 Millions | |
| Recent Price: 6.21 Smart Investing & Trading Score : 42 | |
| Day Percent Change: -0.64% Day Change: -0.04 | |
| Week Change: 2.64% Year-to-date Change: -10.7% | |
| ITUB Links: Profile News Message Board | |
| Charts:- Daily , Weekly | |
| Add ITUB to Watchlist: View: Get Complete ITUB Trend Analysis ➞ | |
 | GGR Gogoro Inc. |
| Sector: Services & Goods | |
| SubSector: Auto Parts | |
| MarketCap: 856 Millions | |
| Recent Price: 1.49 Smart Investing & Trading Score : 45 | |
| Day Percent Change: -0.67% Day Change: -0.01 | |
| Week Change: 5.67% Year-to-date Change: -42.7% | |
| GGR Links: Profile News Message Board | |
| Charts:- Daily , Weekly | |
| Add GGR to Watchlist: View: Get Complete GGR Trend Analysis ➞ | |
 | SBS Companhia de Saneamento Basico do Estado de Sao Paulo - SABESP |
| Sector: Utilities | |
| SubSector: Water Utilities | |
| MarketCap: 5498.72 Millions | |
| Recent Price: 16.03 Smart Investing & Trading Score : 62 | |
| Day Percent Change: -0.68% Day Change: -0.11 | |
| Week Change: 3.49% Year-to-date Change: 5.3% | |
| SBS Links: Profile News Message Board | |
| Charts:- Daily , Weekly | |
| Add SBS to Watchlist: View: Get Complete SBS Trend Analysis ➞ | |
 | OMAB Grupo Aeroportuario del Centro Norte, S.A.B. de C.V. |
| Sector: Transports | |
| SubSector: Air Services, Other | |
| MarketCap: 1196.38 Millions | |
| Recent Price: 81.06 Smart Investing & Trading Score : 85 | |
| Day Percent Change: -0.70% Day Change: -0.57 | |
| Week Change: 7.94% Year-to-date Change: -4.2% | |
| OMAB Links: Profile News Message Board | |
| Charts:- Daily , Weekly | |
| Add OMAB to Watchlist: View: Get Complete OMAB Trend Analysis ➞ | |
 | INFY Infosys Limited |
| Sector: Technology | |
| SubSector: Information Technology Services | |
| MarketCap: 33819.1 Millions | |
| Recent Price: 17.04 Smart Investing & Trading Score : 35 | |
| Day Percent Change: -0.70% Day Change: -0.12 | |
| Week Change: 1.37% Year-to-date Change: -7.3% | |
| INFY Links: Profile News Message Board | |
| Charts:- Daily , Weekly | |
| Add INFY to Watchlist: View: Get Complete INFY Trend Analysis ➞ | |
 | WIT Wipro Limited |
| Sector: Technology | |
| SubSector: Information Technology Services | |
| MarketCap: 15101.3 Millions | |
| Recent Price: 5.47 Smart Investing & Trading Score : 42 | |
| Day Percent Change: -0.73% Day Change: -0.04 | |
| Week Change: 4.19% Year-to-date Change: -1.8% | |
| WIT Links: Profile News Message Board | |
| Charts:- Daily , Weekly | |
| Add WIT to Watchlist: View: Get Complete WIT Trend Analysis ➞ | |
 | CSAN Cosan S.A. |
| Sector: Energy | |
| SubSector: Oil & Gas Refining & Marketing | |
| MarketCap: 6890 Millions | |
| Recent Price: 11.16 Smart Investing & Trading Score : 42 | |
| Day Percent Change: -0.80% Day Change: -0.09 | |
| Week Change: 0.72% Year-to-date Change: -29.2% | |
| CSAN Links: Profile News Message Board | |
| Charts:- Daily , Weekly | |
| Add CSAN to Watchlist: View: Get Complete CSAN Trend Analysis ➞ | |
 | RDY Dr. Reddy s Laboratories Limited |
| Sector: Health Care | |
| SubSector: Drug Manufacturers - Other | |
| MarketCap: 6590.23 Millions | |
| Recent Price: 70.92 Smart Investing & Trading Score : 25 | |
| Day Percent Change: -0.80% Day Change: -0.57 | |
| Week Change: -0.31% Year-to-date Change: 1.9% | |
| RDY Links: Profile News Message Board | |
| Charts:- Daily , Weekly | |
| Add RDY to Watchlist: View: Get Complete RDY Trend Analysis ➞ | |
 | CNF CNFinance Holdings Limited |
| Sector: Financials | |
| SubSector: Credit Services | |
| MarketCap: 277.408 Millions | |
| Recent Price: 1.82 Smart Investing & Trading Score : 10 | |
| Day Percent Change: -0.82% Day Change: -0.01 | |
| Week Change: -1.09% Year-to-date Change: -18.0% | |
| CNF Links: Profile News Message Board | |
| Charts:- Daily , Weekly | |
| Add CNF to Watchlist: View: Get Complete CNF Trend Analysis ➞ | |
 | BBDO Banco Bradesco S.A. |
| Sector: Financials | |
| SubSector: Foreign Regional Banks | |
| MarketCap: 27711.4 Millions | |
| Recent Price: 2.33 Smart Investing & Trading Score : 27 | |
| Day Percent Change: -0.85% Day Change: -0.02 | |
| Week Change: -0.21% Year-to-date Change: -26.9% | |
| BBDO Links: Profile News Message Board | |
| Charts:- Daily , Weekly | |
| Add BBDO to Watchlist: View: Get Complete BBDO Trend Analysis ➞ | |
 | PBR Petroleo Brasileiro S.A. - Petrobras |
| Sector: Energy | |
| SubSector: Oil & Gas Drilling & Exploration | |
| MarketCap: 38939.2 Millions | |
| Recent Price: 16.81 Smart Investing & Trading Score : 69 | |
| Day Percent Change: -0.88% Day Change: -0.15 | |
| Week Change: 2.06% Year-to-date Change: 5.3% | |
| PBR Links: Profile News Message Board | |
| Charts:- Daily , Weekly | |
| Add PBR to Watchlist: View: Get Complete PBR Trend Analysis ➞ | |
 | DRD DRDGOLD Limited |
| Sector: Materials | |
| SubSector: Gold | |
| MarketCap: 556.919 Millions | |
| Recent Price: 7.82 Smart Investing & Trading Score : 36 | |
| Day Percent Change: -0.89% Day Change: -0.07 | |
| Week Change: -8.54% Year-to-date Change: -1.6% | |
| DRD Links: Profile News Message Board | |
| Charts:- Daily , Weekly | |
| Add DRD to Watchlist: View: Get Complete DRD Trend Analysis ➞ | |
 | CHT Chunghwa Telecom Co., Ltd. |
| Sector: Technology | |
| SubSector: Telecom Services - Domestic | |
| MarketCap: 28101.3 Millions | |
| Recent Price: 38.24 Smart Investing & Trading Score : 51 | |
| Day Percent Change: -0.91% Day Change: -0.35 | |
| Week Change: 1.03% Year-to-date Change: -2.1% | |
| CHT Links: Profile News Message Board | |
| Charts:- Daily , Weekly | |
| Add CHT to Watchlist: View: Get Complete CHT Trend Analysis ➞ | |
 | BAK Braskem S.A. |
| Sector: Materials | |
| SubSector: Chemicals - Major Diversified | |
| MarketCap: 2715.86 Millions | |
| Recent Price: 8.80 Smart Investing & Trading Score : 22 | |
| Day Percent Change: -1.01% Day Change: -0.09 | |
| Week Change: 1.73% Year-to-date Change: -0.2% | |
| BAK Links: Profile News Message Board | |
| Charts:- Daily , Weekly | |
| Add BAK to Watchlist: View: Get Complete BAK Trend Analysis ➞ | |
 | EBON Ebang International Holdings Inc. |
| Sector: Technology | |
| SubSector: Computer Hardware | |
| MarketCap: 33787 Millions | |
| Recent Price: 7.89 Smart Investing & Trading Score : 17 | |
| Day Percent Change: -1.13% Day Change: -0.09 | |
| Week Change: -4.25% Year-to-date Change: -48.4% | |
| EBON Links: Profile News Message Board | |
| Charts:- Daily , Weekly | |
| Add EBON to Watchlist: View: Get Complete EBON Trend Analysis ➞ | |
 | BRFS BRF S.A. |
| Sector: Consumer Staples | |
| SubSector: Meat Products | |
| MarketCap: 2635.51 Millions | |
| Recent Price: 3.39 Smart Investing & Trading Score : 75 | |
| Day Percent Change: -1.17% Day Change: -0.04 | |
| Week Change: 3.35% Year-to-date Change: 21.9% | |
| BRFS Links: Profile News Message Board | |
| Charts:- Daily , Weekly | |
| Add BRFS to Watchlist: View: Get Complete BRFS Trend Analysis ➞ | |
 | DDL Dingdong (Cayman) Limited |
| Sector: Consumer Staples | |
| SubSector: Grocery Stores | |
| MarketCap: 708 Millions | |
| Recent Price: 1.21 Smart Investing & Trading Score : 54 | |
| Day Percent Change: -1.23% Day Change: -0.01 | |
| Week Change: 4.78% Year-to-date Change: -20.7% | |
| DDL Links: Profile News Message Board | |
| Charts:- Daily , Weekly | |
| Add DDL to Watchlist: View: Get Complete DDL Trend Analysis ➞ | |
 | PAC Grupo Aeroportuario del Pacifico, S.A.B. de C.V. |
| Sector: Transports | |
| SubSector: Air Services, Other | |
| MarketCap: 3204.18 Millions | |
| Recent Price: 176.15 Smart Investing & Trading Score : 100 | |
| Day Percent Change: -1.29% Day Change: -2.31 | |
| Week Change: 12.81% Year-to-date Change: 0.5% | |
| PAC Links: Profile News Message Board | |
| Charts:- Daily , Weekly | |
| Add PAC to Watchlist: View: Get Complete PAC Trend Analysis ➞ | |
 | XYF X Financial |
| Sector: Financials | |
| SubSector: Credit Services | |
| MarketCap: 168.008 Millions | |
| Recent Price: 3.83 Smart Investing & Trading Score : 25 | |
| Day Percent Change: -1.34% Day Change: -0.05 | |
| Week Change: 1.32% Year-to-date Change: 4.6% | |
| XYF Links: Profile News Message Board | |
| Charts:- Daily , Weekly | |
| Add XYF to Watchlist: View: Get Complete XYF Trend Analysis ➞ | |
| For tabular summary view of above stock list: Summary View ➞ 0 - 25 , 25 - 50 , 50 - 75 , 75 - 100 , 100 - 125 , 125 - 150 , 150 - 175 , 175 - 200 | ||
| Click To Change The Sort Order: By Market Cap or Company Size Performance: Year-to-date, Week and Day | |
| Select Chart Type: | ||
|
Best Stocks Today 12Stocks.com |
© 2024 12Stocks.com Terms & Conditions Privacy Contact Us
All Information Provided Only For Education And Not To Be Used For Investing or Trading. See Terms & Conditions


One More Thing ... Get Best Stocks Delivered Daily!
Never Ever Miss A Move With Our Top Ten Stocks Lists
Find Best Stocks In Any Market - Bull or Bear Market
Take A Peek At Our Top Ten Stocks Lists: Daily, Weekly, Year-to-Date & Top Trends
Find Best Stocks In Any Market - Bull or Bear Market
Take A Peek At Our Top Ten Stocks Lists: Daily, Weekly, Year-to-Date & Top Trends
Emerging Markets Stocks With Best Up Trends [0-bearish to 100-bullish]: Yatsen Holding[100], ZTO Express[100], Alibaba [100], JD.com [100], MINISO [100], Controladora Vuela[100], Full Truck[100], Grupo Aeroportuario[100], Grupo Aeroportuario[100], WiMi Hologram[95], Baozun [95]
Best Emerging Markets Stocks Year-to-Date:
U Power[3013.84%], DouYu [802.11%], MicroCloud Hologram[574.82%], China Liberal[531.99%], Yatsen Holding[479.55%], Zhongchao [325.91%], Uxin [169.61%], QuantaSing [106.48%], GigaCloud [96.01%], Cheetah Mobile[73.68%], Yiren Digital[62.82%] Best Emerging Markets Stocks This Week:
WiMi Hologram[64.85%], Aesthetic Medical[53.58%], Golden Heaven[20.85%], Intchains [20.36%], iQIYI [17.99%], Yatsen Holding[17.29%], Bilibili [16.87%], GDS [14.87%], Baozun [14.66%], Grupo Aeroportuario[12.81%], Pinduoduo [12.39%] Best Emerging Markets Stocks Daily:
WiMi Hologram[58.53%], Aesthetic Medical[44.75%], Intchains [22.28%], Uxin [13.86%], Golden Heaven[11.81%], 17 Education[11.70%], Bilibili [10.97%], AMTD Digital[8.33%], Yatsen Holding[7.89%], Dada Nexus[7.53%], U Power[7.31%]