
 Login Sign Up


| |||||
 |  | ||||

| 12Stocks.com Market Intelligence |
Best Emerging Markets Stocks
| In a hurry? Emerging Markets Stocks Lists: Trends Table, Stock Charts
Sort Emerging Markets stocks: Daily, Weekly, Year-to-Date, Market Cap & Trends. Filter Emerging Markets stocks list by sector: Show all, Tech, Finance, Energy, Staples, Retail, Industrial, Materials, Utilities and HealthCare Filter Emerging Markets stocks list by size:All Large Medium Small |
| 12Stocks.com Emerging Markets Stocks Performances & Trends Daily | |||||||||
|
|  The overall Smart Investing & Trading Score is 66 (0-bearish to 100-bullish) which puts Emerging Markets index in short term neutral to bullish trend. The Smart Investing & Trading Score from previous trading session is 100 and hence a deterioration of trend.
| ||||||||
Here are the Smart Investing & Trading Scores of the most requested Emerging Markets stocks at 12Stocks.com (click stock name for detailed review):
|


| 12Stocks.com: Top Performing Emerging Markets Index Stocks | ||||||||||||||||||||||||||||||||||||||||||||||||
 The top performing Emerging Markets Index stocks year to date are
Now, more recently, over last week, the top performing Emerging Markets Index stocks on the move are


|
||||||||||||||||||||||||||||||||||||||||||||||||
| 12Stocks.com: Investing in Emerging Markets Index with Stocks | |
|
The following table helps investors and traders sort through current performance and trends (as measured by Smart Investing & Trading Score ) of various
stocks in the Emerging Markets Index. Quick View: Move mouse or cursor over stock symbol (ticker) to view short-term technical chart and over stock name to view long term chart. Click on  to add stock symbol to your watchlist and to add stock symbol to your watchlist and  to view watchlist. Click on any ticker or stock name for detailed market intelligence report for that stock. to view watchlist. Click on any ticker or stock name for detailed market intelligence report for that stock. |
12Stocks.com Performance of Stocks in Emerging Markets Index
| Ticker | Stock Name | Watchlist | Category | Recent Price | Smart Investing & Trading Score | Change % | YTD Change% |
| ASR | Grupo Aeroportuario |   | Transports | 344.50 | 68 | -3.46 | 17.07% |
| UGP | Ultrapar Participacoes | | Energy | 5.02 | 0 | -3.46 | -7.38% |
| VTRU | Vitru | | Consumer Staples | 12.30 | 10 | -3.53 | -22.25% |
| VLRS | Controladora Vuela | | Transports | 8.19 | 68 | -3.53 | -12.69% |
| STNE | StoneCo | | Technology | 15.60 | 15 | -3.64 | -13.48% |
| KNDI | Kandi | | Consumer Staples | 2.54 | 42 | -3.79 | -9.29% |
| AFYA | Afya | | Services & Goods | 17.23 | 37 | -3.85 | -21.43% |
| XP | XP | | Financials | 20.47 | 18 | -3.85 | -21.48% |
| GDS | GDS | | Technology | 8.16 | 100 | -4.00 | -10.53% |
| MSC | Studio City | | Services & Goods | 7.44 | 61 | -4.00 | 14.81% |
| LX | LexinFintech | | Financials | 1.68 | 17 | -4.00 | -8.70% |
| ASAI | Sendas Distribuidora | | Consumer Staples | 12.73 | 0 | -4.29 | -7.72% |
| BZUN | Baozun | | Services & Goods | 2.60 | 58 | -4.41 | -5.11% |
| EH | EHang | | Industrials | 17.82 | 58 | -4.60 | 6.07% |
| AZUL | Azul S.A | | Transports | 5.60 | 25 | -4.60 | -42.21% |
| QD | Qudian | | Technology | 2.38 | 33 | -4.80 | 16.67% |
| TAL | TAL Education | | Services & Goods | 12.04 | 58 | -4.90 | -4.67% |
| SDA | SunCar | | Services & Goods | 7.89 | 74 | -4.94 | 1.54% |
| BILI | Bilibili | | Technology | 12.64 | 83 | -5.32 | 3.86% |
| VIPS | Vipshop | | Services & Goods | 15.04 | 0 | -5.35 | -15.32% |
| HOLI | Hollysys Automation | | Industrials | 23.29 | 0 | -5.40 | -11.61% |
| LXEH | Lixiang Education | | Consumer Staples | 0.50 | 59 | -5.62 | -54.33% |
| JG | Aurora Mobile | | Technology | 2.95 | 5 | -5.75 | 3.44% |
| HMY | Harmony Gold | | Materials | 8.57 | 43 | -5.93 | 39.35% |
| AIXI | Xiao-I | | Technology | 1.22 | 20 | -6.15 | -45.78% |
| For chart view version of above stock list: Chart View ➞ 0 - 25 , 25 - 50 , 50 - 75 , 75 - 100 , 100 - 125 , 125 - 150 , 150 - 175 , 175 - 200 | ||
 | Click To Change The Sort Order: By Market Cap or Company Size Performance: Year-to-date, Week and Day |  |
|
Get the most comprehensive stock market coverage daily at 12Stocks.com ➞ Best Stocks Today ➞ Best Stocks Weekly ➞ Best Stocks Year-to-Date ➞ Best Stocks Trends ➞  Best Stocks Today 12Stocks.com Best Nasdaq Stocks ➞ Best S&P 500 Stocks ➞ Best Tech Stocks ➞ Best Biotech Stocks ➞ |
| Detailed Overview of Emerging Markets Stocks |
| Emerging Markets Technical Overview, Leaders & Laggards, Top Emerging Markets ETF Funds & Detailed Emerging Markets Stocks List, Charts, Trends & More |
| Emerging Markets: Technical Analysis, Trends & YTD Performance | |
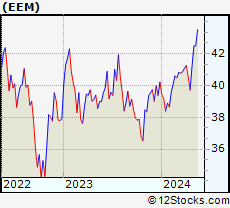
 EEM Weekly Chart |
|
| Long Term Trend: Very Good | |
| Medium Term Trend: Very Good | |
 EEM Daily Chart |
|
| Short Term Trend: Very Good | |
| Overall Trend Score: 66 | |
| YTD Performance: 1.94% | |
| **Trend Scores & Views Are Only For Educational Purposes And Not For Investing | |
| 12Stocks.com: Investing in Emerging Markets Index using Exchange Traded Funds | |
|
The following table shows list of key exchange traded funds (ETF) that
help investors play Emerging Markets stock market. For detailed view, check out our ETF Funds section of our website. Quick View: Move mouse or cursor over ETF symbol (ticker) to view short-term technical chart and over ETF name to view long term chart. Click on ticker or stock name for detailed view. Click on to add stock symbol to your watchlist and to view watchlist. |
12Stocks.com List of ETFs that track Emerging Markets Index
| Ticker | ETF Name | Watchlist | Recent Price | Smart Investing & Trading Score | Change % | Week % | Year-to-date % |
| EEM | Emerging Markets | | 40.99 | 66 | -1.40 | -0.44 | 1.94% |
| VWO | Emerging Markets | | 42.17 | 83 | -1.33 | -0.35 | 2.6% |
| SCHE | Emerging Markets Equity | | 25.46 | 76 | -1.39 | -0.43 | 2.7% |
| EWX | Emerging Markets Small | | 56.73 | 93 | -0.77 | 0.18 | 0.48% |
| EET | Emerging Markets | | 50.72 | 83 | -2.80 | -1.01 | -0.28% |
| EDC | Emrg Mkts Bull | | 29.61 | 88 | -4.24 | -1.33 | -2.69% |
| EEV | Short Emerging | | 19.14 | 7 | 2.19 | -0.44 | -2.96% |
| EUM | Short Emerging | | 14.06 | 35 | 1.33 | 0.5 | -0.67% |
| EDIV | Emerging Markets Dividend | | 33.77 | 88 | -0.82 | 0.48 | 3.84% |
| EMIF | Emerging Markets Infrastructure | | 22.03 | 71 | -0.72 | -0.41 | 2.94% |
| CEW | Emerging Currency Strat | | 17.69 | 25 | -0.35 | 0.06 | -1.75% |
| EBND | Em Mkts Lcl | | 19.88 | 10 | -0.75 | -0.35 | -6.4% |
| EMCB | Emerging Markets Corp | | 63.86 | 45 | 0.18 | 0.23 | -0.06% |
| VWOB | Emerging Mkts Govt | | 62.19 | 22 | -0.84 | -0.34 | -2.45% |
| EEMA | Emerging Markets Asia | | 68.33 | 66 | -1.16 | -0.61 | 3.36% |
| EELV | Em Mkts Low | | 23.48 | 63 | -1.26 | 0.3 | -2.33% |
| DVYE | Emerging Markets Dividend | | 27.06 | 83 | -1.35 | 0.33 | 2.15% |
| SDEM | SuperDividend Em Mkts | | 25.55 | 66 | -1.22 | 0.12 | 3.04% |
| DBEM | Em Mkts Hdgd | | 23.90 | 76 | -0.91 | -0.25 | 3.6% |
| PCY | Emerging Markets Sov | | 19.63 | 15 | -1.26 | -0.56 | -4.8% |
| QEMM | Emerging Mkts StratcFacts | | 57.27 | 63 | -0.97 | -0.12 | 0.2% |
| 12Stocks.com: Charts, Trends, Fundamental Data and Performances of Emerging Markets Stocks | |
|
We now take in-depth look at all Emerging Markets stocks including charts, multi-period performances and overall trends (as measured by Smart Investing & Trading Score ). One can sort Emerging Markets stocks (click link to choose) by Daily, Weekly and by Year-to-Date performances. Also, one can sort by size of the company or by market capitalization. |
| Select Your Default Chart Type: | |||||
| |||||
| Click on stock symbol or name for detailed view. Click on to add stock symbol to your watchlist and to view watchlist. Quick View: Move mouse or cursor over "Daily" to quickly view daily technical stock chart and over "Weekly" to view weekly technical stock chart. | |||||

 | ASR Grupo Aeroportuario del Sureste, S. A. B. de C. V. |
| Sector: Transports | |
| SubSector: Air Services, Other | |
| MarketCap: 2739.98 Millions | |
| Recent Price: 344.50 Smart Investing & Trading Score : 68 | |
| Day Percent Change: -3.46% Day Change: -12.36 | |
| Week Change: -2.78% Year-to-date Change: 17.1% | |
| ASR Links: Profile News Message Board | |
| Charts:- Daily , Weekly | |
| Add ASR to Watchlist: View: Get Complete ASR Trend Analysis ➞ | |
 | UGP Ultrapar Participacoes S.A. |
| Sector: Energy | |
| SubSector: Oil & Gas Refining & Marketing | |
| MarketCap: 3473.54 Millions | |
| Recent Price: 5.02 Smart Investing & Trading Score : 0 | |
| Day Percent Change: -3.46% Day Change: -0.18 | |
| Week Change: -3.83% Year-to-date Change: -7.4% | |
| UGP Links: Profile News Message Board | |
| Charts:- Daily , Weekly | |
| Add UGP to Watchlist: View: Get Complete UGP Trend Analysis ➞ | |
 | VTRU Vitru Limited |
| Sector: Consumer Staples | |
| SubSector: Education & Training Services | |
| MarketCap: 33347 Millions | |
| Recent Price: 12.30 Smart Investing & Trading Score : 10 | |
| Day Percent Change: -3.53% Day Change: -0.45 | |
| Week Change: -5.38% Year-to-date Change: -22.3% | |
| VTRU Links: Profile News Message Board | |
| Charts:- Daily , Weekly | |
| Add VTRU to Watchlist: View: Get Complete VTRU Trend Analysis ➞ | |
 | VLRS Controladora Vuela Compania de Aviacion, S.A.B. de C.V. |
| Sector: Transports | |
| SubSector: Major Airlines | |
| MarketCap: 382 Millions | |
| Recent Price: 8.19 Smart Investing & Trading Score : 68 | |
| Day Percent Change: -3.53% Day Change: -0.30 | |
| Week Change: -4.99% Year-to-date Change: -12.7% | |
| VLRS Links: Profile News Message Board | |
| Charts:- Daily , Weekly | |
| Add VLRS to Watchlist: View: Get Complete VLRS Trend Analysis ➞ | |
 | STNE StoneCo Ltd. |
| Sector: Technology | |
| SubSector: Application Software | |
| MarketCap: 7347.82 Millions | |
| Recent Price: 15.60 Smart Investing & Trading Score : 15 | |
| Day Percent Change: -3.64% Day Change: -0.59 | |
| Week Change: -4.59% Year-to-date Change: -13.5% | |
| STNE Links: Profile News Message Board | |
| Charts:- Daily , Weekly | |
| Add STNE to Watchlist: View: Get Complete STNE Trend Analysis ➞ | |
 | KNDI Kandi Technologies Group, Inc. |
| Sector: Consumer Staples | |
| SubSector: Auto Manufacturers - Major | |
| MarketCap: 137.471 Millions | |
| Recent Price: 2.54 Smart Investing & Trading Score : 42 | |
| Day Percent Change: -3.79% Day Change: -0.10 | |
| Week Change: -2.68% Year-to-date Change: -9.3% | |
| KNDI Links: Profile News Message Board | |
| Charts:- Daily , Weekly | |
| Add KNDI to Watchlist: View: Get Complete KNDI Trend Analysis ➞ | |
 | AFYA Afya Limited |
| Sector: Services & Goods | |
| SubSector: Education & Training Services | |
| MarketCap: 1559.26 Millions | |
| Recent Price: 17.23 Smart Investing & Trading Score : 37 | |
| Day Percent Change: -3.85% Day Change: -0.69 | |
| Week Change: -3.96% Year-to-date Change: -21.4% | |
| AFYA Links: Profile News Message Board | |
| Charts:- Daily , Weekly | |
| Add AFYA to Watchlist: View: Get Complete AFYA Trend Analysis ➞ | |
 | XP XP Inc. |
| Sector: Financials | |
| SubSector: Asset Management | |
| MarketCap: 12990.3 Millions | |
| Recent Price: 20.47 Smart Investing & Trading Score : 18 | |
| Day Percent Change: -3.85% Day Change: -0.82 | |
| Week Change: -2.8% Year-to-date Change: -21.5% | |
| XP Links: Profile News Message Board | |
| Charts:- Daily , Weekly | |
| Add XP to Watchlist: View: Get Complete XP Trend Analysis ➞ | |
 | GDS GDS Holdings Limited |
| Sector: Technology | |
| SubSector: Data Storage Devices | |
| MarketCap: 8597.99 Millions | |
| Recent Price: 8.16 Smart Investing & Trading Score : 100 | |
| Day Percent Change: -4.00% Day Change: -0.34 | |
| Week Change: 5.15% Year-to-date Change: -10.5% | |
| GDS Links: Profile News Message Board | |
| Charts:- Daily , Weekly | |
| Add GDS to Watchlist: View: Get Complete GDS Trend Analysis ➞ | |
 | MSC Studio City International Holdings Limited |
| Sector: Services & Goods | |
| SubSector: Resorts & Casinos | |
| MarketCap: 1420.54 Millions | |
| Recent Price: 7.44 Smart Investing & Trading Score : 61 | |
| Day Percent Change: -4.00% Day Change: -0.31 | |
| Week Change: 4.57% Year-to-date Change: 14.8% | |
| MSC Links: Profile News Message Board | |
| Charts:- Daily , Weekly | |
| Add MSC to Watchlist: View: Get Complete MSC Trend Analysis ➞ | |
 | LX LexinFintech Holdings Ltd. |
| Sector: Financials | |
| SubSector: Credit Services | |
| MarketCap: 1674.18 Millions | |
| Recent Price: 1.68 Smart Investing & Trading Score : 17 | |
| Day Percent Change: -4.00% Day Change: -0.07 | |
| Week Change: -1.75% Year-to-date Change: -8.7% | |
| LX Links: Profile News Message Board | |
| Charts:- Daily , Weekly | |
| Add LX to Watchlist: View: Get Complete LX Trend Analysis ➞ | |
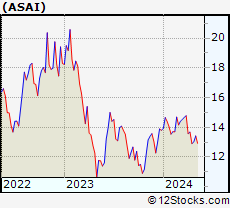 | ASAI Sendas Distribuidora S.A. |
| Sector: Consumer Staples | |
| SubSector: Grocery Stores | |
| MarketCap: 3790 Millions | |
| Recent Price: 12.73 Smart Investing & Trading Score : 0 | |
| Day Percent Change: -4.29% Day Change: -0.57 | |
| Week Change: -2.23% Year-to-date Change: -7.7% | |
| ASAI Links: Profile News Message Board | |
| Charts:- Daily , Weekly | |
| Add ASAI to Watchlist: View: Get Complete ASAI Trend Analysis ➞ | |
 | BZUN Baozun Inc. |
| Sector: Services & Goods | |
| SubSector: Catalog & Mail Order Houses | |
| MarketCap: 1668.92 Millions | |
| Recent Price: 2.60 Smart Investing & Trading Score : 58 | |
| Day Percent Change: -4.41% Day Change: -0.12 | |
| Week Change: -5.45% Year-to-date Change: -5.1% | |
| BZUN Links: Profile News Message Board | |
| Charts:- Daily , Weekly | |
| Add BZUN to Watchlist: View: Get Complete BZUN Trend Analysis ➞ | |
 | EH EHang Holdings Limited |
| Sector: Industrials | |
| SubSector: Aerospace/Defense Products & Services | |
| MarketCap: 513.401 Millions | |
| Recent Price: 17.82 Smart Investing & Trading Score : 58 | |
| Day Percent Change: -4.60% Day Change: -0.86 | |
| Week Change: -2.3% Year-to-date Change: 6.1% | |
| EH Links: Profile News Message Board | |
| Charts:- Daily , Weekly | |
| Add EH to Watchlist: View: Get Complete EH Trend Analysis ➞ | |
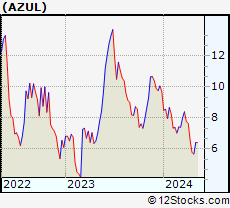 | AZUL Azul S.A. |
| Sector: Transports | |
| SubSector: Major Airlines | |
| MarketCap: 1289.85 Millions | |
| Recent Price: 5.60 Smart Investing & Trading Score : 25 | |
| Day Percent Change: -4.60% Day Change: -0.27 | |
| Week Change: -1.41% Year-to-date Change: -42.2% | |
| AZUL Links: Profile News Message Board | |
| Charts:- Daily , Weekly | |
| Add AZUL to Watchlist: View: Get Complete AZUL Trend Analysis ➞ | |
 | QD Qudian Inc. |
| Sector: Technology | |
| SubSector: Information Technology Services | |
| MarketCap: 544.968 Millions | |
| Recent Price: 2.38 Smart Investing & Trading Score : 33 | |
| Day Percent Change: -4.80% Day Change: -0.12 | |
| Week Change: -3.25% Year-to-date Change: 16.7% | |
| QD Links: Profile News Message Board | |
| Charts:- Daily , Weekly | |
| Add QD to Watchlist: View: Get Complete QD Trend Analysis ➞ | |
 | TAL TAL Education Group |
| Sector: Services & Goods | |
| SubSector: Education & Training Services | |
| MarketCap: 30103.1 Millions | |
| Recent Price: 12.04 Smart Investing & Trading Score : 58 | |
| Day Percent Change: -4.90% Day Change: -0.62 | |
| Week Change: -10.22% Year-to-date Change: -4.7% | |
| TAL Links: Profile News Message Board | |
| Charts:- Daily , Weekly | |
| Add TAL to Watchlist: View: Get Complete TAL Trend Analysis ➞ | |
 | SDA SunCar Technology Group Inc. |
| Sector: Services & Goods | |
| SubSector: Auto & Truck Dealerships | |
| MarketCap: 2680 Millions | |
| Recent Price: 7.89 Smart Investing & Trading Score : 74 | |
| Day Percent Change: -4.94% Day Change: -0.41 | |
| Week Change: 8.68% Year-to-date Change: 1.5% | |
| SDA Links: Profile News Message Board | |
| Charts:- Daily , Weekly | |
| Add SDA to Watchlist: View: Get Complete SDA Trend Analysis ➞ | |
 | BILI Bilibili Inc. |
| Sector: Technology | |
| SubSector: Internet Information Providers | |
| MarketCap: 7043.1 Millions | |
| Recent Price: 12.64 Smart Investing & Trading Score : 83 | |
| Day Percent Change: -5.32% Day Change: -0.71 | |
| Week Change: -3.66% Year-to-date Change: 3.9% | |
| BILI Links: Profile News Message Board | |
| Charts:- Daily , Weekly | |
| Add BILI to Watchlist: View: Get Complete BILI Trend Analysis ➞ | |
 | VIPS Vipshop Holdings Limited |
| Sector: Services & Goods | |
| SubSector: Catalog & Mail Order Houses | |
| MarketCap: 10496.2 Millions | |
| Recent Price: 15.04 Smart Investing & Trading Score : 0 | |
| Day Percent Change: -5.35% Day Change: -0.85 | |
| Week Change: -4.39% Year-to-date Change: -15.3% | |
| VIPS Links: Profile News Message Board | |
| Charts:- Daily , Weekly | |
| Add VIPS to Watchlist: View: Get Complete VIPS Trend Analysis ➞ | |
 | HOLI Hollysys Automation Technologies Ltd. |
| Sector: Industrials | |
| SubSector: Industrial Electrical Equipment | |
| MarketCap: 668.379 Millions | |
| Recent Price: 23.29 Smart Investing & Trading Score : 0 | |
| Day Percent Change: -5.40% Day Change: -1.33 | |
| Week Change: -5.13% Year-to-date Change: -11.6% | |
| HOLI Links: Profile News Message Board | |
| Charts:- Daily , Weekly | |
| Add HOLI to Watchlist: View: Get Complete HOLI Trend Analysis ➞ | |
 | LXEH Lixiang Education Holding Co., Ltd. |
| Sector: Consumer Staples | |
| SubSector: Education & Training Services | |
| MarketCap: 12347 Millions | |
| Recent Price: 0.50 Smart Investing & Trading Score : 59 | |
| Day Percent Change: -5.62% Day Change: -0.03 | |
| Week Change: 20.85% Year-to-date Change: -54.3% | |
| LXEH Links: Profile News Message Board | |
| Charts:- Daily , Weekly | |
| Add LXEH to Watchlist: View: Get Complete LXEH Trend Analysis ➞ | |
 | JG Aurora Mobile Limited |
| Sector: Technology | |
| SubSector: Application Software | |
| MarketCap: 268.762 Millions | |
| Recent Price: 2.95 Smart Investing & Trading Score : 5 | |
| Day Percent Change: -5.75% Day Change: -0.18 | |
| Week Change: -1.99% Year-to-date Change: 3.4% | |
| JG Links: Profile News Message Board | |
| Charts:- Daily , Weekly | |
| Add JG to Watchlist: View: Get Complete JG Trend Analysis ➞ | |
 | HMY Harmony Gold Mining Company Limited |
| Sector: Materials | |
| SubSector: Gold | |
| MarketCap: 1371.69 Millions | |
| Recent Price: 8.57 Smart Investing & Trading Score : 43 | |
| Day Percent Change: -5.93% Day Change: -0.54 | |
| Week Change: -4.46% Year-to-date Change: 39.4% | |
| HMY Links: Profile News Message Board | |
| Charts:- Daily , Weekly | |
| Add HMY to Watchlist: View: Get Complete HMY Trend Analysis ➞ | |
 | AIXI Xiao-I Corporation |
| Sector: Technology | |
| SubSector: Software - Application | |
| MarketCap: 431 Millions | |
| Recent Price: 1.22 Smart Investing & Trading Score : 20 | |
| Day Percent Change: -6.15% Day Change: -0.08 | |
| Week Change: -4.69% Year-to-date Change: -45.8% | |
| AIXI Links: Profile News Message Board | |
| Charts:- Daily , Weekly | |
| Add AIXI to Watchlist: View: Get Complete AIXI Trend Analysis ➞ | |
| For tabular summary view of above stock list: Summary View ➞ 0 - 25 , 25 - 50 , 50 - 75 , 75 - 100 , 100 - 125 , 125 - 150 , 150 - 175 , 175 - 200 | ||
| Click To Change The Sort Order: By Market Cap or Company Size Performance: Year-to-date, Week and Day | |
| Select Chart Type: | ||
|
Best Stocks Today 12Stocks.com |
© 2024 12Stocks.com Terms & Conditions Privacy Contact Us
All Information Provided Only For Education And Not To Be Used For Investing or Trading. See Terms & Conditions


One More Thing ... Get Best Stocks Delivered Daily!
Never Ever Miss A Move With Our Top Ten Stocks Lists
Find Best Stocks In Any Market - Bull or Bear Market
Take A Peek At Our Top Ten Stocks Lists: Daily, Weekly, Year-to-Date & Top Trends
Find Best Stocks In Any Market - Bull or Bear Market
Take A Peek At Our Top Ten Stocks Lists: Daily, Weekly, Year-to-Date & Top Trends
Emerging Markets Stocks With Best Up Trends [0-bearish to 100-bullish]: Smart Share[100], ATRenew [100], Grupo Aeroportuario[100], America Movil[100], GDS [100], MOGU [93], ICICI Bank[93], Niu [93], BeiGene [93], Grupo Aeroportuario[90], Kanzhun [90]
Best Emerging Markets Stocks Year-to-Date:
U Power[2891.07%], DouYu [803.16%], MicroCloud Hologram[628.06%], China Liberal[504.03%], Yatsen Holding[497.32%], Zhongchao [338.78%], Uxin [163.91%], QuantaSing [85.8%], GigaCloud [73.62%], Cheetah Mobile[71.49%], Yiren Digital[61.54%] Best Emerging Markets Stocks This Week:
Golden Heaven[22.28%], Lixiang Education[20.85%], Viomi [16.39%], Smart Share[14.54%], Lanvin [13.92%], uCloudlink [9.49%], MOGU [9.03%], Dingdong (Cayman)[8.73%], SunCar [8.68%], China Online[7.72%], 21Vianet [6.96%] Best Emerging Markets Stocks Daily:
Golden Heaven[25.92%], Lanvin [19.21%], Regencell Bioscience[13.33%], Smart Share[11.15%], MOGU [10.22%], Skillful Craftsman[7.89%], China Online[6.43%], Sunlands [6.39%], Yunji [5.43%], OneConnect Financial[5.18%], Cango [4.90%]