
 Login Sign Up


| |||||
 |  | ||||

| 12Stocks.com Market Intelligence |
Best Emerging Markets Stocks
| In a hurry? Emerging Markets Stocks Lists: Trends Table, Stock Charts
Sort Emerging Markets stocks: Daily, Weekly, Year-to-Date, Market Cap & Trends. Filter Emerging Markets stocks list by sector: Show all, Tech, Finance, Energy, Staples, Retail, Industrial, Materials, Utilities and HealthCare Filter Emerging Markets stocks list by size:All Large Medium Small |
| 12Stocks.com Emerging Markets Stocks Performances & Trends Daily | |||||||||
|
|  The overall Smart Investing & Trading Score is 56 (0-bearish to 100-bullish) which puts Emerging Markets index in short term neutral trend. The Smart Investing & Trading Score from previous trading session is 38 and hence an improvement of trend.
| ||||||||
Here are the Smart Investing & Trading Scores of the most requested Emerging Markets stocks at 12Stocks.com (click stock name for detailed review):
|


| 12Stocks.com: Top Performing Emerging Markets Index Stocks | ||||||||||||||||||||||||||||||||||||||||||||||||
 The top performing Emerging Markets Index stocks year to date are
Now, more recently, over last week, the top performing Emerging Markets Index stocks on the move are


|
||||||||||||||||||||||||||||||||||||||||||||||||
| 12Stocks.com: Investing in Emerging Markets Index with Stocks | |
|
The following table helps investors and traders sort through current performance and trends (as measured by Smart Investing & Trading Score ) of various
stocks in the Emerging Markets Index. Quick View: Move mouse or cursor over stock symbol (ticker) to view short-term technical chart and over stock name to view long term chart. Click on  to add stock symbol to your watchlist and to add stock symbol to your watchlist and  to view watchlist. Click on any ticker or stock name for detailed market intelligence report for that stock. to view watchlist. Click on any ticker or stock name for detailed market intelligence report for that stock. |
12Stocks.com Performance of Stocks in Emerging Markets Index
| Ticker | Stock Name | Watchlist | Category | Recent Price | Smart Investing & Trading Score | Change % | YTD Change% |
| CIG | Companhia Energetica |   | Utilities | 2.42 | 43 | 0.00 | 4.31% |
| IMOS | ChipMOS | | Technology | 28.88 | 53 | 0.00 | 6.14% |
| TV | Grupo Televisa | | Services & Goods | 2.90 | 10 | 0.00 | -13.17% |
| ICG | Intchains | | Technology | 8.10 | 17 | 0.00 | -34.15% |
| AMBI | Ambipar Emergency | | Industrials | 4.60 | 42 | 0.00 | -41.48% |
| IH | iHuman | | Consumer Staples | 1.75 | 25 | 0.00 | -42.62% |
| VSTA | Vasta Platform | | Consumer Staples | 3.75 | 0 | 0.00 | -14.77% |
| ZCMD | Zhongchao | | Health Care | 1.37 | 51 | 0.00 | 275.24% |
| KRKR | 36Kr | | Technology | 0.38 | 50 | 0.00 | -32.63% |
| VIOT | Viomi | | Technology | 0.54 | 18 | 0.00 | -46.00% |
| YI | 111 | | Services & Goods | 0.97 | 10 | 0.00 | -37.41% |
| YJ | Yunji | | Services & Goods | 0.79 | 31 | 0.00 | 11.06% |
| DUO | Fangdd Network | | Financials | 0.39 | 0 | 0.00 | -42.20% |
| SY | So-Young | | Technology | 1.17 | 59 | 0.00 | -9.30% |
| MSC | Studio City | | Services & Goods | 7.70 | 61 | 0.00 | 18.83% |
| FMX | Fomento Economico | | Consumer Staples | 118.93 | 17 | -0.01 | -8.76% |
| ATHM | Autohome | | Technology | 24.26 | 10 | -0.04 | -13.54% |
| BEST | BEST | | Consumer Staples | 2.08 | 10 | -0.05 | -18.48% |
| BILI | Bilibili | | Technology | 11.02 | 46 | -0.09 | -9.45% |
| ZH | Zhihu | | Services & Goods | 0.66 | 12 | -0.14 | -30.52% |
| CSAN | Cosan S.A | | Energy | 10.90 | 17 | -0.14 | -30.78% |
| GFI | Gold Fields | | Materials | 17.70 | 85 | -0.23 | 22.41% |
| JFIN | Jiayin | | Technology | 6.36 | 44 | -0.24 | 22.68% |
| EDTK | Skillful Craftsman | | Consumer Staples | 0.92 | 18 | -0.27 | -26.98% |
| BSBR | Banco Santander | | Financials | 5.12 | 17 | -0.29 | -21.91% |
| For chart view version of above stock list: Chart View ➞ 0 - 25 , 25 - 50 , 50 - 75 , 75 - 100 , 100 - 125 , 125 - 150 , 150 - 175 , 175 - 200 | ||
 | Click To Change The Sort Order: By Market Cap or Company Size Performance: Year-to-date, Week and Day |  |
|
Get the most comprehensive stock market coverage daily at 12Stocks.com ➞ Best Stocks Today ➞ Best Stocks Weekly ➞ Best Stocks Year-to-Date ➞ Best Stocks Trends ➞  Best Stocks Today 12Stocks.com Best Nasdaq Stocks ➞ Best S&P 500 Stocks ➞ Best Tech Stocks ➞ Best Biotech Stocks ➞ |
| Detailed Overview of Emerging Markets Stocks |
| Emerging Markets Technical Overview, Leaders & Laggards, Top Emerging Markets ETF Funds & Detailed Emerging Markets Stocks List, Charts, Trends & More |
| Emerging Markets: Technical Analysis, Trends & YTD Performance | |
 EEM Weekly Chart |
|
| Long Term Trend: Very Good | |
| Medium Term Trend: Not Good | |
 EEM Daily Chart |
|
| Short Term Trend: Deteriorating | |
| Overall Trend Score: 56 | |
| YTD Performance: -0.87% | |
| **Trend Scores & Views Are Only For Educational Purposes And Not For Investing | |
| 12Stocks.com: Investing in Emerging Markets Index using Exchange Traded Funds | |
|
The following table shows list of key exchange traded funds (ETF) that
help investors play Emerging Markets stock market. For detailed view, check out our ETF Funds section of our website. Quick View: Move mouse or cursor over ETF symbol (ticker) to view short-term technical chart and over ETF name to view long term chart. Click on ticker or stock name for detailed view. Click on to add stock symbol to your watchlist and to view watchlist. |
12Stocks.com List of ETFs that track Emerging Markets Index
| Ticker | ETF Name | Watchlist | Recent Price | Smart Investing & Trading Score | Change % | Week % | Year-to-date % |
| EEM | Emerging Markets | | 39.86 | 56 | 0.38 | -1.65 | -0.87% |
| VWO | Emerging Markets | | 41.00 | 61 | 0.24 | -1.44 | -0.24% |
| SCHE | Emerging Markets Equity | | 24.76 | 53 | 0.24 | -1.47 | -0.12% |
| EWX | Emerging Markets Small | | 55.48 | 36 | 0.23 | -1.03 | -1.74% |
| EET | Emerging Markets | | 48.03 | 41 | 0.17 | -3.55 | -5.56% |
| EDC | Emrg Mkts Bull | | 27.49 | 48 | 1.36 | -4.81 | -9.66% |
| EEV | Short Emerging | | 20.38 | 62 | -0.90 | 3.22 | 3.3% |
| EUM | Short Emerging | | 14.43 | 45 | -0.50 | 1.71 | 1.96% |
| EDIV | Emerging Markets Dividend | | 32.88 | 36 | 0.52 | -0.18 | 1.11% |
| EMIF | Emerging Markets Infrastructure | | 21.37 | 36 | 0.05 | -1.9 | -0.14% |
| CEW | Emerging Currency Strat | | 17.59 | 31 | 0.05 | -0.54 | -2.3% |
| EBND | Em Mkts Lcl | | 19.86 | 10 | -0.15 | -1.05 | -6.5% |
| EMCB | Emerging Markets Corp | | 63.80 | 23 | -0.27 | -0.46 | -0.16% |
| VWOB | Emerging Mkts Govt | | 62.09 | 10 | -0.14 | -0.91 | -2.6% |
| EEMA | Emerging Markets Asia | | 66.51 | 41 | 0.93 | -1.23 | 0.61% |
| EELV | Em Mkts Low | | 23.23 | 10 | 0.52 | -1.21 | -3.37% |
| DVYE | Emerging Markets Dividend | | 26.30 | 49 | -0.04 | -0.6 | -0.72% |
| SDEM | SuperDividend Em Mkts | | 25.63 | 41 | 0.20 | -0.28 | 3.36% |
| DBEM | Em Mkts Hdgd | | 23.21 | 41 | 0.61 | -1.32 | 0.61% |
| PCY | Emerging Markets Sov | | 19.74 | 25 | -0.30 | -1.4 | -4.27% |
| QEMM | Emerging Mkts StratcFacts | | 56.18 | 36 | 0.23 | -1.23 | -1.71% |
| 12Stocks.com: Charts, Trends, Fundamental Data and Performances of Emerging Markets Stocks | |
|
We now take in-depth look at all Emerging Markets stocks including charts, multi-period performances and overall trends (as measured by Smart Investing & Trading Score ). One can sort Emerging Markets stocks (click link to choose) by Daily, Weekly and by Year-to-Date performances. Also, one can sort by size of the company or by market capitalization. |
| Select Your Default Chart Type: | |||||
| |||||
| Click on stock symbol or name for detailed view. Click on to add stock symbol to your watchlist and to view watchlist. Quick View: Move mouse or cursor over "Daily" to quickly view daily technical stock chart and over "Weekly" to view weekly technical stock chart. | |||||

 | CIG Companhia Energetica de Minas Gerais |
| Sector: Utilities | |
| SubSector: Electric Utilities | |
| MarketCap: 3203.54 Millions | |
| Recent Price: 2.42 Smart Investing & Trading Score : 43 | |
| Day Percent Change: 0.00% Day Change: 0.00 | |
| Week Change: -2.02% Year-to-date Change: 4.3% | |
| CIG Links: Profile News Message Board | |
| Charts:- Daily , Weekly | |
| Add CIG to Watchlist: View: Get Complete CIG Trend Analysis ➞ | |
 | IMOS ChipMOS TECHNOLOGIES INC. |
| Sector: Technology | |
| SubSector: Semiconductor Equipment & Materials | |
| MarketCap: 658.918 Millions | |
| Recent Price: 28.88 Smart Investing & Trading Score : 53 | |
| Day Percent Change: 0.00% Day Change: 0.00 | |
| Week Change: -3.25% Year-to-date Change: 6.1% | |
| IMOS Links: Profile News Message Board | |
| Charts:- Daily , Weekly | |
| Add IMOS to Watchlist: View: Get Complete IMOS Trend Analysis ➞ | |
 | TV Grupo Televisa, S.A.B. |
| Sector: Services & Goods | |
| SubSector: Broadcasting - TV | |
| MarketCap: 3740.43 Millions | |
| Recent Price: 2.90 Smart Investing & Trading Score : 10 | |
| Day Percent Change: 0.00% Day Change: 0.00 | |
| Week Change: -10.22% Year-to-date Change: -13.2% | |
| TV Links: Profile News Message Board | |
| Charts:- Daily , Weekly | |
| Add TV to Watchlist: View: Get Complete TV Trend Analysis ➞ | |
 | ICG Intchains Group Limited |
| Sector: Technology | |
| SubSector: Semiconductors | |
| MarketCap: 450 Millions | |
| Recent Price: 8.10 Smart Investing & Trading Score : 17 | |
| Day Percent Change: 0.00% Day Change: 0.00 | |
| Week Change: -1.82% Year-to-date Change: -34.2% | |
| ICG Links: Profile News Message Board | |
| Charts:- Daily , Weekly | |
| Add ICG to Watchlist: View: Get Complete ICG Trend Analysis ➞ | |
 | AMBI Ambipar Emergency Response |
| Sector: Industrials | |
| SubSector: Waste Management | |
| MarketCap: 462 Millions | |
| Recent Price: 4.60 Smart Investing & Trading Score : 42 | |
| Day Percent Change: 0.00% Day Change: 0.00 | |
| Week Change: -9.45% Year-to-date Change: -41.5% | |
| AMBI Links: Profile News Message Board | |
| Charts:- Daily , Weekly | |
| Add AMBI to Watchlist: View: Get Complete AMBI Trend Analysis ➞ | |
 | IH iHuman Inc. |
| Sector: Consumer Staples | |
| SubSector: Education & Training Services | |
| MarketCap: 12247 Millions | |
| Recent Price: 1.75 Smart Investing & Trading Score : 25 | |
| Day Percent Change: 0.00% Day Change: 0.00 | |
| Week Change: -1.69% Year-to-date Change: -42.6% | |
| IH Links: Profile News Message Board | |
| Charts:- Daily , Weekly | |
| Add IH to Watchlist: View: Get Complete IH Trend Analysis ➞ | |
 | VSTA Vasta Platform Limited |
| Sector: Consumer Staples | |
| SubSector: Education & Training Services | |
| MarketCap: 12747 Millions | |
| Recent Price: 3.75 Smart Investing & Trading Score : 0 | |
| Day Percent Change: 0.00% Day Change: 0.00 | |
| Week Change: -1.57% Year-to-date Change: -14.8% | |
| VSTA Links: Profile News Message Board | |
| Charts:- Daily , Weekly | |
| Add VSTA to Watchlist: View: Get Complete VSTA Trend Analysis ➞ | |
 | ZCMD Zhongchao Inc. |
| Sector: Health Care | |
| SubSector: Health Information Services | |
| MarketCap: 41487 Millions | |
| Recent Price: 1.37 Smart Investing & Trading Score : 51 | |
| Day Percent Change: 0.00% Day Change: 0.00 | |
| Week Change: -16.46% Year-to-date Change: 275.2% | |
| ZCMD Links: Profile News Message Board | |
| Charts:- Daily , Weekly | |
| Add ZCMD to Watchlist: View: Get Complete ZCMD Trend Analysis ➞ | |
 | KRKR 36Kr Holdings Inc. |
| Sector: Technology | |
| SubSector: Internet Information Providers | |
| MarketCap: 173.18 Millions | |
| Recent Price: 0.38 Smart Investing & Trading Score : 50 | |
| Day Percent Change: 0.00% Day Change: 0.00 | |
| Week Change: 1.81% Year-to-date Change: -32.6% | |
| KRKR Links: Profile News Message Board | |
| Charts:- Daily , Weekly | |
| Add KRKR to Watchlist: View: Get Complete KRKR Trend Analysis ➞ | |
 | VIOT Viomi Technology Co., Ltd |
| Sector: Technology | |
| SubSector: Electronic Equipment | |
| MarketCap: 357.2 Millions | |
| Recent Price: 0.54 Smart Investing & Trading Score : 18 | |
| Day Percent Change: 0.00% Day Change: 0.00 | |
| Week Change: -1.82% Year-to-date Change: -46.0% | |
| VIOT Links: Profile News Message Board | |
| Charts:- Daily , Weekly | |
| Add VIOT to Watchlist: View: Get Complete VIOT Trend Analysis ➞ | |
 | YI 111, Inc. |
| Sector: Services & Goods | |
| SubSector: Drug Stores | |
| MarketCap: 520.351 Millions | |
| Recent Price: 0.97 Smart Investing & Trading Score : 10 | |
| Day Percent Change: 0.00% Day Change: 0.00 | |
| Week Change: -11.81% Year-to-date Change: -37.4% | |
| YI Links: Profile News Message Board | |
| Charts:- Daily , Weekly | |
| Add YI to Watchlist: View: Get Complete YI Trend Analysis ➞ | |
 | YJ Yunji Inc. |
| Sector: Services & Goods | |
| SubSector: Specialty Retail, Other | |
| MarketCap: 770.644 Millions | |
| Recent Price: 0.79 Smart Investing & Trading Score : 31 | |
| Day Percent Change: 0.00% Day Change: 0.00 | |
| Week Change: -10.28% Year-to-date Change: 11.1% | |
| YJ Links: Profile News Message Board | |
| Charts:- Daily , Weekly | |
| Add YJ to Watchlist: View: Get Complete YJ Trend Analysis ➞ | |
 | DUO Fangdd Network Group Ltd. |
| Sector: Financials | |
| SubSector: Property Management | |
| MarketCap: 783.142 Millions | |
| Recent Price: 0.39 Smart Investing & Trading Score : 0 | |
| Day Percent Change: 0.00% Day Change: 0.00 | |
| Week Change: -3.47% Year-to-date Change: -42.2% | |
| DUO Links: Profile News Message Board | |
| Charts:- Daily , Weekly | |
| Add DUO to Watchlist: View: Get Complete DUO Trend Analysis ➞ | |
 | SY So-Young International Inc. |
| Sector: Technology | |
| SubSector: Healthcare Information Services | |
| MarketCap: 1000.55 Millions | |
| Recent Price: 1.17 Smart Investing & Trading Score : 59 | |
| Day Percent Change: 0.00% Day Change: 0.00 | |
| Week Change: 0% Year-to-date Change: -9.3% | |
| SY Links: Profile News Message Board | |
| Charts:- Daily , Weekly | |
| Add SY to Watchlist: View: Get Complete SY Trend Analysis ➞ | |
 | MSC Studio City International Holdings Limited |
| Sector: Services & Goods | |
| SubSector: Resorts & Casinos | |
| MarketCap: 1420.54 Millions | |
| Recent Price: 7.70 Smart Investing & Trading Score : 61 | |
| Day Percent Change: 0.00% Day Change: 0.00 | |
| Week Change: -9.41% Year-to-date Change: 18.8% | |
| MSC Links: Profile News Message Board | |
| Charts:- Daily , Weekly | |
| Add MSC to Watchlist: View: Get Complete MSC Trend Analysis ➞ | |
 | FMX Fomento Economico Mexicano, S.A.B. de C.V. |
| Sector: Consumer Staples | |
| SubSector: Beverages - Brewers | |
| MarketCap: 22018.7 Millions | |
| Recent Price: 118.93 Smart Investing & Trading Score : 17 | |
| Day Percent Change: -0.01% Day Change: -0.02 | |
| Week Change: -4.28% Year-to-date Change: -8.8% | |
| FMX Links: Profile News Message Board | |
| Charts:- Daily , Weekly | |
| Add FMX to Watchlist: View: Get Complete FMX Trend Analysis ➞ | |
 | ATHM Autohome Inc. |
| Sector: Technology | |
| SubSector: Internet Information Providers | |
| MarketCap: 7984.2 Millions | |
| Recent Price: 24.26 Smart Investing & Trading Score : 10 | |
| Day Percent Change: -0.04% Day Change: -0.01 | |
| Week Change: -3.88% Year-to-date Change: -13.5% | |
| ATHM Links: Profile News Message Board | |
| Charts:- Daily , Weekly | |
| Add ATHM to Watchlist: View: Get Complete ATHM Trend Analysis ➞ | |
 | BEST BEST Inc. |
| Sector: Consumer Staples | |
| SubSector: Packaging & Containers | |
| MarketCap: 1981.73 Millions | |
| Recent Price: 2.08 Smart Investing & Trading Score : 10 | |
| Day Percent Change: -0.05% Day Change: 0.00 | |
| Week Change: -0.95% Year-to-date Change: -18.5% | |
| BEST Links: Profile News Message Board | |
| Charts:- Daily , Weekly | |
| Add BEST to Watchlist: View: Get Complete BEST Trend Analysis ➞ | |
 | BILI Bilibili Inc. |
| Sector: Technology | |
| SubSector: Internet Information Providers | |
| MarketCap: 7043.1 Millions | |
| Recent Price: 11.02 Smart Investing & Trading Score : 46 | |
| Day Percent Change: -0.09% Day Change: -0.01 | |
| Week Change: -4.01% Year-to-date Change: -9.5% | |
| BILI Links: Profile News Message Board | |
| Charts:- Daily , Weekly | |
| Add BILI to Watchlist: View: Get Complete BILI Trend Analysis ➞ | |
 | ZH Zhihu Inc. |
| Sector: Services & Goods | |
| SubSector: Internet Content & Information | |
| MarketCap: 741 Millions | |
| Recent Price: 0.66 Smart Investing & Trading Score : 12 | |
| Day Percent Change: -0.14% Day Change: 0.00 | |
| Week Change: -6.13% Year-to-date Change: -30.5% | |
| ZH Links: Profile News Message Board | |
| Charts:- Daily , Weekly | |
| Add ZH to Watchlist: View: Get Complete ZH Trend Analysis ➞ | |
 | CSAN Cosan S.A. |
| Sector: Energy | |
| SubSector: Oil & Gas Refining & Marketing | |
| MarketCap: 6890 Millions | |
| Recent Price: 10.90 Smart Investing & Trading Score : 17 | |
| Day Percent Change: -0.14% Day Change: -0.02 | |
| Week Change: -6.39% Year-to-date Change: -30.8% | |
| CSAN Links: Profile News Message Board | |
| Charts:- Daily , Weekly | |
| Add CSAN to Watchlist: View: Get Complete CSAN Trend Analysis ➞ | |
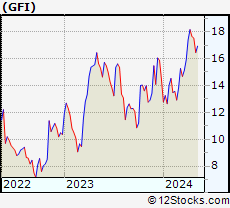 | GFI Gold Fields Limited |
| Sector: Materials | |
| SubSector: Gold | |
| MarketCap: 4908.39 Millions | |
| Recent Price: 17.70 Smart Investing & Trading Score : 85 | |
| Day Percent Change: -0.23% Day Change: -0.04 | |
| Week Change: -2.53% Year-to-date Change: 22.4% | |
| GFI Links: Profile News Message Board | |
| Charts:- Daily , Weekly | |
| Add GFI to Watchlist: View: Get Complete GFI Trend Analysis ➞ | |
 | JFIN Jiayin Group Inc. |
| Sector: Technology | |
| SubSector: Internet Information Providers | |
| MarketCap: 131.48 Millions | |
| Recent Price: 6.36 Smart Investing & Trading Score : 44 | |
| Day Percent Change: -0.24% Day Change: -0.01 | |
| Week Change: -1.63% Year-to-date Change: 22.7% | |
| JFIN Links: Profile News Message Board | |
| Charts:- Daily , Weekly | |
| Add JFIN to Watchlist: View: Get Complete JFIN Trend Analysis ➞ | |
 | EDTK Skillful Craftsman Education Technology Limited |
| Sector: Consumer Staples | |
| SubSector: Education & Training Services | |
| MarketCap: 32347 Millions | |
| Recent Price: 0.92 Smart Investing & Trading Score : 18 | |
| Day Percent Change: -0.27% Day Change: 0.00 | |
| Week Change: 0% Year-to-date Change: -27.0% | |
| EDTK Links: Profile News Message Board | |
| Charts:- Daily , Weekly | |
| Add EDTK to Watchlist: View: Get Complete EDTK Trend Analysis ➞ | |
 | BSBR Banco Santander (Brasil) S.A. |
| Sector: Financials | |
| SubSector: Foreign Regional Banks | |
| MarketCap: 21961.4 Millions | |
| Recent Price: 5.12 Smart Investing & Trading Score : 17 | |
| Day Percent Change: -0.29% Day Change: -0.01 | |
| Week Change: -4.03% Year-to-date Change: -21.9% | |
| BSBR Links: Profile News Message Board | |
| Charts:- Daily , Weekly | |
| Add BSBR to Watchlist: View: Get Complete BSBR Trend Analysis ➞ | |
| For tabular summary view of above stock list: Summary View ➞ 0 - 25 , 25 - 50 , 50 - 75 , 75 - 100 , 100 - 125 , 125 - 150 , 150 - 175 , 175 - 200 | ||
| Click To Change The Sort Order: By Market Cap or Company Size Performance: Year-to-date, Week and Day | |
| Select Chart Type: | ||
|
Best Stocks Today 12Stocks.com |
© 2024 12Stocks.com Terms & Conditions Privacy Contact Us
All Information Provided Only For Education And Not To Be Used For Investing or Trading. See Terms & Conditions


One More Thing ... Get Best Stocks Delivered Daily!
Never Ever Miss A Move With Our Top Ten Stocks Lists
Find Best Stocks In Any Market - Bull or Bear Market
Take A Peek At Our Top Ten Stocks Lists: Daily, Weekly, Year-to-Date & Top Trends
Find Best Stocks In Any Market - Bull or Bear Market
Take A Peek At Our Top Ten Stocks Lists: Daily, Weekly, Year-to-Date & Top Trends
Emerging Markets Stocks With Best Up Trends [0-bearish to 100-bullish]: GigaCloud [100], Baozun [95], HDFC Bank[93], TAL Education[90], Yatsen Holding[88], GDS [88], JOYY [88], Harmony Gold[88], DRDGOLD [88], Gold Fields[85], U Power[83]
Best Emerging Markets Stocks Year-to-Date:
U Power[2874.33%], DouYu [748.42%], MicroCloud Hologram[708.63%], China Liberal[459.28%], Yatsen Holding[403.01%], Zhongchao [275.24%], Uxin [142.51%], QuantaSing [112.65%], GigaCloud [101.28%], Yiren Digital[55.45%], Bright Scholar[50.4%] Best Emerging Markets Stocks This Week:
Regencell Bioscience[24.34%], Yatsen Holding[22.26%], TH [18.18%], Secoo Holding[11.85%], Controladora Vuela[11.35%], GigaCloud [9.05%], Smart Share[7.58%], EHang [7.22%], SunCar [7%], Quhuo [6.85%], Momo [6.79%] Best Emerging Markets Stocks Daily:
MicroCloud Hologram[26.01%], TH [25.00%], Secoo Holding[9.35%], Quhuo [8.36%], U Power[8.11%], Cheetah Mobile[6.80%], WiMi Hologram[6.52%], GigaCloud [5.51%], EHang [4.62%], Controladora Vuela[4.53%], Huize Holding[4.07%]