
 Login Sign Up


| |||||
 |  | ||||

| 12Stocks.com Market Intelligence |
Best Biotech Stocks
|
|
| Quick Read: Best Biotech Stocks List By Performances & Trends: Daily, Weekly, Year-to-Date, Market Cap (Size) & Technical Trends | |||
| Best Biotech Stocks Views: Quick Browse View, Summary & Slide Show View | |||
| 12Stocks.com Biotech Stocks Performances & Trends Daily | |||||||||
|
|  The overall market intelligence score is 33 (0-bearish to 100-bullish) which puts Biotech sector in short term bearish to neutral trend. The market intelligence score from previous trading session is 62 and hence a deterioration of trend.
| ||||||||
Here are the market intelligence trend scores of the most requested Biotech stocks at 12Stocks.com (click stock name for detailed review):
|


| 12Stocks.com: Investing in Biotech sector with Stocks | |
|
The following table helps investors and traders sort through current performance and trends (as measured by market intelligence score) of various
stocks in the Biotech sector. Quick View: Move mouse or cursor over stock symbol (ticker) to view short-term Technical chart and over stock name to view long term chart. Click on  to add stock symbol to your watchlist and to add stock symbol to your watchlist and  to view watchlist. Click on any ticker or stock name for detailed market intelligence report for that stock. to view watchlist. Click on any ticker or stock name for detailed market intelligence report for that stock. |
12Stocks.com Performance of Stocks in Biotech Sector
| Ticker | Stock Name | Watchlist | Category | Recent Price | Market Intelligence Score | Change % | Weekly Change% |
| ABUS | Arbutus Biopharma |   | Biotechnology | 2.84 | 76 | 0.00% | 4.80% |
| MNPR | Monopar | | Biotechnology | 0.76 | 62 | -1.17% | 4.79% |
| VSTM | Verastem | | Biotechnology | 11.40 | 57 | -0.18% | 4.59% |
| RLMD | Relmada | | Biotechnology | 3.85 | 47 | 0.52% | 4.48% |
| NKTR | Nektar | | Biotechnology | 1.64 | 58 | 9.33% | 4.46% |
| TNGX | Tango | | Biotechnology | 7.91 | 32 | 0.76% | 4.42% |
| VRTX | Vertex | | Biotechnology | 418.66 | 77 | 2.05% | 4.38% |
| CRNX | Crinetics | | Biotechnology | 49.25 | 95 | 3.29% | 4.34% |
| SLN | Silence | | Biotechnology | 22.62 | 49 | 1.94% | 4.31% |
| QURE | uniQure N.V | | Biotechnology | 4.89 | 60 | 1.45% | 4.26% |
| DRTS | Alpha Tau | | Biotechnology | 2.45 | 40 | 0.00% | 4.26% |
| GHRS | GH Research | | Biotechnology | 11.99 | 88 | -0.75% | 4.26% |
| ZURA | Zura Bio | | Biotechnology | 4.70 | 76 | 1.29% | 4.21% |
| SCPH | sc | | Biotechnology | 4.85 | 67 | -2.41% | 4.08% |
| KRON | Kronos Bio | | Biotechnology | 1.05 | 49 | 0.00% | 3.96% |
| VKTX | Viking | | Biotechnology | 79.98 | 75 | 0.46% | 3.91% |
| PTGX | Protagonist | | Biotechnology | 27.07 | 47 | 4.98% | 3.78% |
| OCX | OncoCyte | | Biotechnology | 2.76 | 52 | -1.08% | 3.76% |
| CLLS | Cellectis S.A | | Biotechnology | 3.10 | 78 | 0.00% | 3.68% |
| CORT | Corcept | | Biotechnology | 25.41 | 88 | 3.78% | 3.61% |
| IVA | Inventiva S.A | | Biotechnology | 3.45 | 52 | 0.00% | 3.60% |
| IKNA | Ikena Oncology | | Biotechnology | 1.38 | 40 | -2.13% | 3.37% |
| VBIV | VBI Vaccines | | Biotechnology | 0.61 | 65 | 1.16% | 3.22% |
| KYMR | Kymera | | Biotechnology | 38.55 | 57 | 0.29% | 3.21% |
| ARWR | Arrowhead | | Biotechnology | 25.21 | 57 | 0.84% | 3.15% |
| To view more stocks, click on Next / Previous arrows or select different range: 0 - 25 , 25 - 50 , 50 - 75 , 75 - 100 , 100 - 125 , 125 - 150 , 150 - 175 , 175 - 200 , 200 - 225 , 225 - 250 , 250 - 275 , 275 - 300 , 300 - 325 , 325 - 350 , 350 - 375 , 375 - 400 | ||
 | Click To Change The Sort Order: By Market Cap or Company Size Performance: Year-to-date, Week and Day |  |
|
Get the most comprehensive stock market coverage daily at 12Stocks.com ➞ Best Stocks Today ➞ Best Stocks Weekly ➞ Best Stocks Year-to-Date ➞ Best Stocks Trends ➞  Best Stocks Today 12Stocks.com Best Nasdaq Stocks ➞ Best S&P 500 Stocks ➞ Best Tech Stocks ➞ Best Biotech Stocks ➞ |
| Detailed Overview of Biotech Stocks |
| Biotech Technical Overview, Leaders & Laggards, Top Biotech ETF Funds & Detailed Biotech Stocks List, Charts, Trends & More |
| Biotech Sector: Technical Analysis, Trends & YTD Performance | |
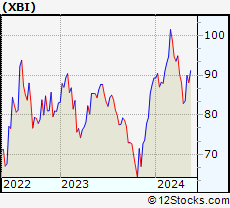
| Biotech sector, as represented by XBI, an exchange-traded fund [ETF] that holds basket of Biotech stocks (e.g, Amgen, Celgene) is down by -0.2% and is currently underperforming the overall market by -8.24% year-to-date. Below is a quick view of Technical charts and trends: | |
 XBI Weekly Chart |
|
| Long Term Trend: Not Good | |
| Medium Term Trend: Very Good | |
 XBI Daily Chart |
|
| Short Term Trend: Not Good | |
| Overall Trend Score: 33 | |
| YTD Performance: -0.2% | |
| **Trend Scores & Views Are Only For Educational Purposes And Not For Investing | |
| 12Stocks.com: Top Performing Biotech Sector Stocks | ||||||||||||||||||||||||||||||||||||||||||||||||
 The top performing Biotech sector stocks year to date are
Now, more recently, over last week, the top performing Biotech sector stocks on the move are


|
||||||||||||||||||||||||||||||||||||||||||||||||
| 12Stocks.com: Investing in Biotech Sector using Exchange Traded Funds | |
|
The following table shows list of key exchange traded funds (ETF) that
help investors track Biotech Index. For detailed view, check out our ETF Funds section of our website. Quick View: Move mouse or cursor over ETF symbol (ticker) to view short-term Technical chart and over ETF name to view long term chart. Click on ticker or stock name for detailed view. Click on to add stock symbol to your watchlist and to view watchlist. |
12Stocks.com List of ETFs that track Biotech Index
| Ticker | ETF Name | Watchlist | Recent Price | Market Intelligence Score | Change % | Week % | Year-to-date % |
| LABD | Biotech Bear 3X | | 8.53 | 68 | 4.53 | 3.02 | -11.97% |
| XBI | Biotech | | 89.11 | 33 | -1.46 | -0.97 | -0.2% |
| LABU | Biotech Bull 3X | | 105.10 | 25 | -4.67 | -3.57 | -13.83% |
| IBB | Biotechnology | | 132.62 | 50 | -0.50 | -0.26 | -2.38% |
| IYH | Healthcare | | 59.77 | 64 | -0.38 | 0.86 | 4.41% |
| IXJ | Global Healthcare | | 90.55 | 72 | -0.29 | 0.99 | 4.42% |
| IHF | Healthcare Providers | | 52.24 | 57 | -0.51 | 1.06 | -0.51% |
| CURE | Healthcare Bull 3X | | 109.92 | 64 | -0.75 | 2.83 | 8.04% |
| FBT | First NYSE | | 147.52 | 55 | -0.97 | -0.46 | -6.67% |
| BIB | Biotechnology | | 55.39 | 48 | -0.38 | -0.43 | -2.91% |
| PTH | DWA Healthcare Momentum | | 42.27 | 50 | 0.14 | 0.52 | 8% |
| PBE | Biotech & Genome | | 63.75 | 62 | -0.67 | -0.56 | -3.17% |
| BIS | Short Biotech | | 18.21 | 61 | 1.17 | 1.22 | 0.77% |
| BBH | Biotech | | 164.03 | 81 | 0.11 | -0.07 | -0.77% |
| BBC | Bio Biotechnology Clinical | | 27.61 | 37 | -1.74 | -1 | 12.91% |
| BTEC | Principal Healthcare Innovators | | 37.03 | 57 | 0.00 | 0.17 | 1.93% |
| BBP | Bio Biotechnology Products | | 55.65 | 52 | 0.34 | 0.29 | -4.2% |
| 12Stocks.com: Charts, Trends, Fundamental Data and Performances of Biotech Stocks | |
|
We now take in-depth look at all Biotech stocks including charts, multi-period performances and overall trends (as measured by market intelligence score). One can sort Biotech stocks (click link to choose) by Daily, Weekly and by Year-to-Date performances. Also, one can sort by size of the company or by market capitalization. |
| Select Your Default Chart Type: | |||||
| |||||
| Click on stock symbol or name for detailed view. Click on to add stock symbol to your watchlist and to view watchlist. Quick View: Move mouse or cursor over "Daily" to quickly view daily Technical stock chart and over "Weekly" to view weekly Technical stock chart. | |||||

 | ABUS Arbutus Biopharma Corporation |
| Sector: Health Care | |
| SubSector: Biotechnology | |
| MarketCap: 110.885 Millions | |
| Recent Price: 2.84 Market Intelligence Score: 76 | |
| Day Percent Change: 0.00% Day Change: 0.00 | |
| Week Change: 4.8% Year-to-date Change: 13.6% | |
| ABUS Links: Profile News Message Board | |
| Charts:- Daily , Weekly | |
| Add ABUS to Watchlist: View: Get Complete ABUS Trend Analysis ➞ | |
 | MNPR Monopar Therapeutics Inc. |
| Sector: Health Care | |
| SubSector: Biotechnology | |
| MarketCap: 71487 Millions | |
| Recent Price: 0.76 Market Intelligence Score: 62 | |
| Day Percent Change: -1.17% Day Change: -0.01 | |
| Week Change: 4.79% Year-to-date Change: 121.5% | |
| MNPR Links: Profile News Message Board | |
| Charts:- Daily , Weekly | |
| Add MNPR to Watchlist: View: Get Complete MNPR Trend Analysis ➞ | |
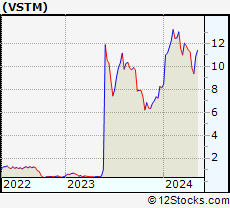 | VSTM Verastem, Inc. |
| Sector: Health Care | |
| SubSector: Biotechnology | |
| MarketCap: 184.385 Millions | |
| Recent Price: 11.40 Market Intelligence Score: 57 | |
| Day Percent Change: -0.18% Day Change: -0.02 | |
| Week Change: 4.59% Year-to-date Change: 40.1% | |
| VSTM Links: Profile News Message Board | |
| Charts:- Daily , Weekly | |
| Add VSTM to Watchlist: View: Get Complete VSTM Trend Analysis ➞ | |
 | RLMD Relmada Therapeutics, Inc. |
| Sector: Health Care | |
| SubSector: Biotechnology | |
| MarketCap: 499.685 Millions | |
| Recent Price: 3.85 Market Intelligence Score: 47 | |
| Day Percent Change: 0.52% Day Change: 0.02 | |
| Week Change: 4.48% Year-to-date Change: -7.1% | |
| RLMD Links: Profile News Message Board | |
| Charts:- Daily , Weekly | |
| Add RLMD to Watchlist: View: Get Complete RLMD Trend Analysis ➞ | |
 | NKTR Nektar Therapeutics |
| Sector: Health Care | |
| SubSector: Biotechnology | |
| MarketCap: 2953.45 Millions | |
| Recent Price: 1.64 Market Intelligence Score: 58 | |
| Day Percent Change: 9.33% Day Change: 0.14 | |
| Week Change: 4.46% Year-to-date Change: 190.3% | |
| NKTR Links: Profile News Message Board | |
| Charts:- Daily , Weekly | |
| Add NKTR to Watchlist: View: Get Complete NKTR Trend Analysis ➞ | |
 | TNGX Tango Therapeutics, Inc. |
| Sector: Health Care | |
| SubSector: Biotechnology | |
| MarketCap: 302 Millions | |
| Recent Price: 7.91 Market Intelligence Score: 32 | |
| Day Percent Change: 0.76% Day Change: 0.06 | |
| Week Change: 4.42% Year-to-date Change: -20.1% | |
| TNGX Links: Profile News Message Board | |
| Charts:- Daily , Weekly | |
| Add TNGX to Watchlist: View: Get Complete TNGX Trend Analysis ➞ | |
 | VRTX Vertex Pharmaceuticals Incorporated |
| Sector: Health Care | |
| SubSector: Biotechnology | |
| MarketCap: 57669.6 Millions | |
| Recent Price: 418.66 Market Intelligence Score: 77 | |
| Day Percent Change: 2.05% Day Change: 8.42 | |
| Week Change: 4.38% Year-to-date Change: 2.9% | |
| VRTX Links: Profile News Message Board | |
| Charts:- Daily , Weekly | |
| Add VRTX to Watchlist: View: Get Complete VRTX Trend Analysis ➞ | |
 | CRNX Crinetics Pharmaceuticals, Inc. |
| Sector: Health Care | |
| SubSector: Biotechnology | |
| MarketCap: 381.085 Millions | |
| Recent Price: 49.25 Market Intelligence Score: 95 | |
| Day Percent Change: 3.29% Day Change: 1.57 | |
| Week Change: 4.34% Year-to-date Change: 38.4% | |
| CRNX Links: Profile News Message Board | |
| Charts:- Daily , Weekly | |
| Add CRNX to Watchlist: View: Get Complete CRNX Trend Analysis ➞ | |
 | SLN Silence Therapeutics plc |
| Sector: Health Care | |
| SubSector: Biotechnology | |
| MarketCap: 198 Millions | |
| Recent Price: 22.62 Market Intelligence Score: 49 | |
| Day Percent Change: 1.94% Day Change: 0.43 | |
| Week Change: 4.31% Year-to-date Change: 28.9% | |
| SLN Links: Profile News Message Board | |
| Charts:- Daily , Weekly | |
| Add SLN to Watchlist: View: Get Complete SLN Trend Analysis ➞ | |
 | QURE uniQure N.V. |
| Sector: Health Care | |
| SubSector: Biotechnology | |
| MarketCap: 2267.25 Millions | |
| Recent Price: 4.89 Market Intelligence Score: 60 | |
| Day Percent Change: 1.45% Day Change: 0.07 | |
| Week Change: 4.26% Year-to-date Change: -27.8% | |
| QURE Links: Profile News Message Board | |
| Charts:- Daily , Weekly | |
| Add QURE to Watchlist: View: Get Complete QURE Trend Analysis ➞ | |
 | DRTS Alpha Tau Medical Ltd. |
| Sector: Health Care | |
| SubSector: Biotechnology | |
| MarketCap: 300 Millions | |
| Recent Price: 2.45 Market Intelligence Score: 40 | |
| Day Percent Change: 0.00% Day Change: 0.00 | |
| Week Change: 4.26% Year-to-date Change: -18.1% | |
| DRTS Links: Profile News Message Board | |
| Charts:- Daily , Weekly | |
| Add DRTS to Watchlist: View: Get Complete DRTS Trend Analysis ➞ | |
 | GHRS GH Research PLC |
| Sector: Health Care | |
| SubSector: Biotechnology | |
| MarketCap: 614 Millions | |
| Recent Price: 11.99 Market Intelligence Score: 88 | |
| Day Percent Change: -0.75% Day Change: -0.09 | |
| Week Change: 4.26% Year-to-date Change: 118.8% | |
| GHRS Links: Profile News Message Board | |
| Charts:- Daily , Weekly | |
| Add GHRS to Watchlist: View: Get Complete GHRS Trend Analysis ➞ | |
 | ZURA Zura Bio Limited |
| Sector: Health Care | |
| SubSector: Biotechnology | |
| MarketCap: 242 Millions | |
| Recent Price: 4.70 Market Intelligence Score: 76 | |
| Day Percent Change: 1.29% Day Change: 0.06 | |
| Week Change: 4.21% Year-to-date Change: 0.3% | |
| ZURA Links: Profile News Message Board | |
| Charts:- Daily , Weekly | |
| Add ZURA to Watchlist: View: Get Complete ZURA Trend Analysis ➞ | |
 | SCPH scPharmaceuticals Inc. |
| Sector: Health Care | |
| SubSector: Biotechnology | |
| MarketCap: 136.185 Millions | |
| Recent Price: 4.85 Market Intelligence Score: 67 | |
| Day Percent Change: -2.41% Day Change: -0.12 | |
| Week Change: 4.08% Year-to-date Change: -22.7% | |
| SCPH Links: Profile News Message Board | |
| Charts:- Daily , Weekly | |
| Add SCPH to Watchlist: View: Get Complete SCPH Trend Analysis ➞ | |
 | KRON Kronos Bio, Inc. |
| Sector: Health Care | |
| SubSector: Biotechnology | |
| MarketCap: 17287 Millions | |
| Recent Price: 1.05 Market Intelligence Score: 49 | |
| Day Percent Change: 0.00% Day Change: 0.00 | |
| Week Change: 3.96% Year-to-date Change: -16.0% | |
| KRON Links: Profile News Message Board | |
| Charts:- Daily , Weekly | |
| Add KRON to Watchlist: View: Get Complete KRON Trend Analysis ➞ | |
 | VKTX Viking Therapeutics, Inc. |
| Sector: Health Care | |
| SubSector: Biotechnology | |
| MarketCap: 388.585 Millions | |
| Recent Price: 79.98 Market Intelligence Score: 75 | |
| Day Percent Change: 0.46% Day Change: 0.37 | |
| Week Change: 3.91% Year-to-date Change: 329.8% | |
| VKTX Links: Profile News Message Board | |
| Charts:- Daily , Weekly | |
| Add VKTX to Watchlist: View: Get Complete VKTX Trend Analysis ➞ | |
 | PTGX Protagonist Therapeutics, Inc. |
| Sector: Health Care | |
| SubSector: Biotechnology | |
| MarketCap: 165.285 Millions | |
| Recent Price: 27.07 Market Intelligence Score: 47 | |
| Day Percent Change: 4.98% Day Change: 1.29 | |
| Week Change: 3.78% Year-to-date Change: 18.1% | |
| PTGX Links: Profile News Message Board | |
| Charts:- Daily , Weekly | |
| Add PTGX to Watchlist: View: Get Complete PTGX Trend Analysis ➞ | |
 | OCX OncoCyte Corporation |
| Sector: Health Care | |
| SubSector: Biotechnology | |
| MarketCap: 131.485 Millions | |
| Recent Price: 2.76 Market Intelligence Score: 52 | |
| Day Percent Change: -1.08% Day Change: -0.03 | |
| Week Change: 3.76% Year-to-date Change: 10.4% | |
| OCX Links: Profile News Message Board | |
| Charts:- Daily , Weekly | |
| Add OCX to Watchlist: View: Get Complete OCX Trend Analysis ➞ | |
 | CLLS Cellectis S.A. |
| Sector: Health Care | |
| SubSector: Biotechnology | |
| MarketCap: 398.685 Millions | |
| Recent Price: 3.10 Market Intelligence Score: 78 | |
| Day Percent Change: 0.00% Day Change: 0.00 | |
| Week Change: 3.68% Year-to-date Change: 0.7% | |
| CLLS Links: Profile News Message Board | |
| Charts:- Daily , Weekly | |
| Add CLLS to Watchlist: View: Get Complete CLLS Trend Analysis ➞ | |
 | CORT Corcept Therapeutics Incorporated |
| Sector: Health Care | |
| SubSector: Biotechnology | |
| MarketCap: 1228.45 Millions | |
| Recent Price: 25.41 Market Intelligence Score: 88 | |
| Day Percent Change: 3.78% Day Change: 0.93 | |
| Week Change: 3.61% Year-to-date Change: -21.8% | |
| CORT Links: Profile News Message Board | |
| Charts:- Daily , Weekly | |
| Add CORT to Watchlist: View: Get Complete CORT Trend Analysis ➞ | |
 | IVA Inventiva S.A. |
| Sector: Health Care | |
| SubSector: Biotechnology | |
| MarketCap: 46487 Millions | |
| Recent Price: 3.45 Market Intelligence Score: 52 | |
| Day Percent Change: 0.00% Day Change: 0.00 | |
| Week Change: 3.6% Year-to-date Change: -23.5% | |
| IVA Links: Profile News Message Board | |
| Charts:- Daily , Weekly | |
| Add IVA to Watchlist: View: Get Complete IVA Trend Analysis ➞ | |
 | IKNA Ikena Oncology, Inc. |
| Sector: Health Care | |
| SubSector: Biotechnology | |
| MarketCap: 277 Millions | |
| Recent Price: 1.38 Market Intelligence Score: 40 | |
| Day Percent Change: -2.13% Day Change: -0.03 | |
| Week Change: 3.37% Year-to-date Change: -31.0% | |
| IKNA Links: Profile News Message Board | |
| Charts:- Daily , Weekly | |
| Add IKNA to Watchlist: View: Get Complete IKNA Trend Analysis ➞ | |
 | VBIV VBI Vaccines Inc. |
| Sector: Health Care | |
| SubSector: Biotechnology | |
| MarketCap: 139.785 Millions | |
| Recent Price: 0.61 Market Intelligence Score: 65 | |
| Day Percent Change: 1.16% Day Change: 0.01 | |
| Week Change: 3.22% Year-to-date Change: 3.7% | |
| VBIV Links: Profile News Message Board | |
| Charts:- Daily , Weekly | |
| Add VBIV to Watchlist: View: Get Complete VBIV Trend Analysis ➞ | |
 | KYMR Kymera Therapeutics, Inc. |
| Sector: Health Care | |
| SubSector: Biotechnology | |
| MarketCap: 27087 Millions | |
| Recent Price: 38.55 Market Intelligence Score: 57 | |
| Day Percent Change: 0.29% Day Change: 0.11 | |
| Week Change: 3.21% Year-to-date Change: 51.7% | |
| KYMR Links: Profile News Message Board | |
| Charts:- Daily , Weekly | |
| Add KYMR to Watchlist: View: Get Complete KYMR Trend Analysis ➞ | |
 | ARWR Arrowhead Pharmaceuticals, Inc. |
| Sector: Health Care | |
| SubSector: Biotechnology | |
| MarketCap: 3226.15 Millions | |
| Recent Price: 25.21 Market Intelligence Score: 57 | |
| Day Percent Change: 0.84% Day Change: 0.21 | |
| Week Change: 3.15% Year-to-date Change: -17.6% | |
| ARWR Links: Profile News Message Board | |
| Charts:- Daily , Weekly | |
| Add ARWR to Watchlist: View: Get Complete ARWR Trend Analysis ➞ | |
| To view more stocks, click on Next / Previous arrows or select different range: 0 - 25 , 25 - 50 , 50 - 75 , 75 - 100 , 100 - 125 , 125 - 150 , 150 - 175 , 175 - 200 , 200 - 225 , 225 - 250 , 250 - 275 , 275 - 300 , 300 - 325 , 325 - 350 , 350 - 375 , 375 - 400 | ||
| Click To Change The Sort Order: By Market Cap or Company Size Performance: Year-to-date, Week and Day | |
| Select Chart Type: | ||
|
Best Stocks Today 12Stocks.com |
© 2024 12Stocks.com Terms & Conditions Privacy Contact Us
All Information Provided Only For Education And Not To Be Used For Investing or Trading. See Terms & Conditions


One More Thing ... Get Best Stocks Delivered Daily!
Never Ever Miss A Move With Our Top Ten Stocks Lists
Find Best Stocks In Any Market - Bull or Bear Market
Take A Peek At Our Top Ten Stocks Lists: Daily, Weekly, Year-to-Date & Top Trends
Find Best Stocks In Any Market - Bull or Bear Market
Take A Peek At Our Top Ten Stocks Lists: Daily, Weekly, Year-to-Date & Top Trends
Biotech Stocks With Best Up Trends [0-bearish to 100-bullish]: Vigil Neuroscience[100], Reneo [100], Halozyme [100], Anika [100], Emergent Bio[100], Milestone [100], Design [100], TG [100], PMV [100], MannKind [100], Alnylam [100]
Best Biotech Stocks Year-to-Date:
Pieris [5943.96%], Precision [2867.12%], Avenue [2688.82%], Inovio [2056.86%], Assembly [1485.17%], Agenus [1287.85%], NuCana [1235.36%], Adverum nologies[1197.82%], Affimed N.V[736.8%], Corbus [599.92%], Mesoblast [589.09%] Best Biotech Stocks This Week:
Vigil Neuroscience[39.52%], Design [23.42%], Ocean Biomedical[21.25%], Sutro Biopharma[15.8%], Cerus [15.74%], Heron [15.13%], Lineage Cell[15.09%], BioCryst [14.72%], Nanobiotix S.A[14.05%], ProKidney [13.82%], Emergent Bio[13.37%] Best Biotech Stocks Daily:
Ocean Biomedical[23.84%], Vigil Neuroscience[18.97%], Brainstorm Cell[15.46%], Repare [15.09%], Denali [12.13%], Ligand [9.67%], Nektar [9.33%], Nanobiotix S.A[6.40%], Corbus [6.30%], MediciNova [6.02%], Reneo [5.75%]