
 Login Sign Up


| |||||
 |  | ||||

| 12Stocks.com Market Intelligence |
Best Biotech Stocks
|
|
| Quick Read: Best Biotech Stocks List By Performances & Trends: Daily, Weekly, Year-to-Date, Market Cap (Size) & Technical Trends | |||
| Best Biotech Stocks Views: Quick Browse View, Summary & Slide Show View | |||
| 12Stocks.com Biotech Stocks Performances & Trends Daily | |||||||||
|
|  The overall market intelligence score is 49 (0-bearish to 100-bullish) which puts Biotech sector in short term neutral trend. The market intelligence score from previous trading session is 32 and hence an improvement of trend.
| ||||||||
Here are the market intelligence trend scores of the most requested Biotech stocks at 12Stocks.com (click stock name for detailed review):
|


| 12Stocks.com: Investing in Biotech sector with Stocks | |
|
The following table helps investors and traders sort through current performance and trends (as measured by market intelligence score) of various
stocks in the Biotech sector. Quick View: Move mouse or cursor over stock symbol (ticker) to view short-term Technical chart and over stock name to view long term chart. Click on  to add stock symbol to your watchlist and to add stock symbol to your watchlist and  to view watchlist. Click on any ticker or stock name for detailed market intelligence report for that stock. to view watchlist. Click on any ticker or stock name for detailed market intelligence report for that stock. |
12Stocks.com Performance of Stocks in Biotech Sector
| Ticker | Stock Name | Watchlist | Category | Recent Price | Market Intelligence Score | Change % | Weekly Change% |
| ADTX | ADiTx |   | Biotechnology | 2.41 | 35 | 0.00% | 0.84% |
| AVRO | AVROBIO | | Biotechnology | 1.22 | 27 | 2.52% | 0.83% |
| OPK | OPKO Health | | Biotechnology | 1.27 | 88 | 4.10% | 0.79% |
| JAZZ | Jazz | | Biotechnology | 110.31 | 67 | -0.40% | 0.78% |
| INBX | Inhibrx | | Biotechnology | 34.30 | 42 | 0.76% | 0.70% |
| PRAX | Praxis Precision | | Biotechnology | 55.16 | 56 | 0.53% | 0.66% |
| HOOK | HOOKIPA Pharma | | Biotechnology | 0.90 | 71 | 1.32% | 0.64% |
| CERS | Cerus | | Biotechnology | 1.72 | 44 | 2.99% | 0.58% |
| ALEC | Alector | | Biotechnology | 5.28 | 35 | 3.94% | 0.57% |
| ACLX | Arcellx | | Biotechnology | 52.16 | 25 | 4.25% | 0.55% |
| NVCT | Nuvectis Pharma | | Biotechnology | 6.54 | 35 | 7.48% | 0.54% |
| ABCL | AbCellera Biologics | | Biotechnology | 3.78 | 47 | 0.27% | 0.53% |
| EBS | Emergent Bio | | Biotechnology | 1.93 | 27 | 2.66% | 0.52% |
| ALXO | ALX Oncology | | Biotechnology | 16.94 | 78 | -0.47% | 0.47% |
| CERE | Cerevel | | Biotechnology | 42.63 | 83 | -0.19% | 0.38% |
| ARVN | Arvinas | | Biotechnology | 32.48 | 25 | 2.23% | 0.34% |
| GBIO | Generation Bio | | Biotechnology | 2.91 | 41 | 2.83% | 0.34% |
| MEIP | MEI Pharma | | Biotechnology | 3.06 | 27 | 0.33% | 0.33% |
| ROIV | Roivant | | Biotechnology | 11.07 | 57 | 1.51% | 0.27% |
| RPRX | Royalty Pharma | | Biotechnology | 28.07 | 17 | 1.34% | 0.25% |
| SLRN | Acelyrin | | Biotechnology | 4.25 | 27 | 1.92% | 0.24% |
| TARA | ArTara | | Biotechnology | 2.93 | 12 | -1.68% | 0.17% |
| BDTX | Black Diamond | | Biotechnology | 5.90 | 75 | 5.92% | 0.17% |
| GILD | Gilead | | Biotechnology | 65.51 | 35 | 0.48% | 0.14% |
| NAMS | NewAmsterdam Pharma | | Biotechnology | 21.97 | 44 | 0.73% | 0.09% |
| To view more stocks, click on Next / Previous arrows or select different range: 0 - 25 , 25 - 50 , 50 - 75 , 75 - 100 , 100 - 125 , 125 - 150 , 150 - 175 , 175 - 200 , 200 - 225 , 225 - 250 , 250 - 275 , 275 - 300 , 300 - 325 , 325 - 350 , 350 - 375 , 375 - 400 | ||
 | Click To Change The Sort Order: By Market Cap or Company Size Performance: Year-to-date, Week and Day |  |
|
Get the most comprehensive stock market coverage daily at 12Stocks.com ➞ Best Stocks Today ➞ Best Stocks Weekly ➞ Best Stocks Year-to-Date ➞ Best Stocks Trends ➞  Best Stocks Today 12Stocks.com Best Nasdaq Stocks ➞ Best S&P 500 Stocks ➞ Best Tech Stocks ➞ Best Biotech Stocks ➞ |
| Detailed Overview of Biotech Stocks |
| Biotech Technical Overview, Leaders & Laggards, Top Biotech ETF Funds & Detailed Biotech Stocks List, Charts, Trends & More |
| Biotech Sector: Technical Analysis, Trends & YTD Performance | |
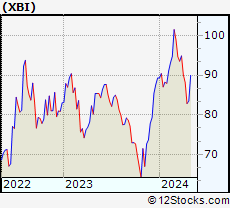
| Biotech sector, as represented by XBI, an exchange-traded fund [ETF] that holds basket of Biotech stocks (e.g, Amgen, Celgene) is down by -2.2% and is currently underperforming the overall market by -6.74% year-to-date. Below is a quick view of Technical charts and trends: | |
 XBI Weekly Chart |
|
| Long Term Trend: Not Good | |
| Medium Term Trend: Deteriorating | |
 XBI Daily Chart |
|
| Short Term Trend: Very Good | |
| Overall Trend Score: 49 | |
| YTD Performance: -2.2% | |
| **Trend Scores & Views Are Only For Educational Purposes And Not For Investing | |
| 12Stocks.com: Top Performing Biotech Sector Stocks | ||||||||||||||||||||||||||||||||||||||||||||||||
 The top performing Biotech sector stocks year to date are
Now, more recently, over last week, the top performing Biotech sector stocks on the move are


|
||||||||||||||||||||||||||||||||||||||||||||||||
| 12Stocks.com: Investing in Biotech Sector using Exchange Traded Funds | |
|
The following table shows list of key exchange traded funds (ETF) that
help investors track Biotech Index. For detailed view, check out our ETF Funds section of our website. Quick View: Move mouse or cursor over ETF symbol (ticker) to view short-term Technical chart and over ETF name to view long term chart. Click on ticker or stock name for detailed view. Click on to add stock symbol to your watchlist and to view watchlist. |
12Stocks.com List of ETFs that track Biotech Index
| Ticker | ETF Name | Watchlist | Recent Price | Market Intelligence Score | Change % | Week % | Year-to-date % |
| LABD | Biotech Bear 3X | | 9.03 | 49 | -10.24 | -14.16 | -6.81% |
| XBI | Biotech | | 87.33 | 49 | 3.20 | 4.6 | -2.2% |
| LABU | Biotech Bull 3X | | 99.81 | 49 | 9.84 | 14.06 | -18.17% |
| IBB | Biotechnology | | 129.49 | 57 | 2.02 | 2.37 | -4.68% |
| IYH | Healthcare | | 59.18 | 64 | 0.59 | 0.97 | 3.37% |
| IXJ | Global Healthcare | | 89.56 | 50 | 0.27 | 0.49 | 3.27% |
| IHF | Healthcare Providers | | 51.44 | 15 | -0.77 | -0.92 | -2.04% |
| FBT | First NYSE | | 146.02 | 49 | 1.46 | 1.65 | -7.61% |
| BIB | Biotechnology | | 52.58 | 64 | 4.43 | 5.88 | -7.84% |
| CURE | Healthcare Bull 3X | | 106.56 | 64 | 0.61 | 1.19 | 4.74% |
| PBE | Biotech & Genome | | 62.86 | 64 | 3.27 | 4.11 | -4.53% |
| PTH | DWA Healthcare Momentum | | 41.27 | 49 | 1.93 | 3.46 | 5.44% |
| BIS | Short Biotech | | 19.11 | 36 | -3.68 | -5.49 | 5.76% |
| BBH | Biotech | | 158.64 | 57 | 1.41 | 1.92 | -4.03% |
| BTEC | Principal Healthcare Innovators | | 35.90 | 62 | 3.60 | 4.81 | -1.19% |
| BBC | Bio Biotechnology Clinical | | 27.10 | 62 | 3.60 | 6.13 | 10.81% |
| BBP | Bio Biotechnology Products | | 54.35 | 64 | 2.00 | 5.56 | -6.45% |
| 12Stocks.com: Charts, Trends, Fundamental Data and Performances of Biotech Stocks | |
|
We now take in-depth look at all Biotech stocks including charts, multi-period performances and overall trends (as measured by market intelligence score). One can sort Biotech stocks (click link to choose) by Daily, Weekly and by Year-to-Date performances. Also, one can sort by size of the company or by market capitalization. |
| Select Your Default Chart Type: | |||||
| |||||
| Click on stock symbol or name for detailed view. Click on to add stock symbol to your watchlist and to view watchlist. Quick View: Move mouse or cursor over "Daily" to quickly view daily Technical stock chart and over "Weekly" to view weekly Technical stock chart. | |||||

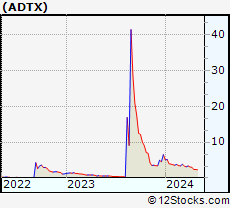 | ADTX ADiTx Therapeutics, Inc. |
| Sector: Health Care | |
| SubSector: Biotechnology | |
| MarketCap: 21487 Millions | |
| Recent Price: 2.41 Market Intelligence Score: 35 | |
| Day Percent Change: 0.00% Day Change: 0.00 | |
| Week Change: 0.84% Year-to-date Change: -63.3% | |
| ADTX Links: Profile News Message Board | |
| Charts:- Daily , Weekly | |
| Add ADTX to Watchlist: View: Get Complete ADTX Trend Analysis ➞ | |
 | AVRO AVROBIO, Inc. |
| Sector: Health Care | |
| SubSector: Biotechnology | |
| MarketCap: 626.185 Millions | |
| Recent Price: 1.22 Market Intelligence Score: 27 | |
| Day Percent Change: 2.52% Day Change: 0.03 | |
| Week Change: 0.83% Year-to-date Change: -10.3% | |
| AVRO Links: Profile News Message Board | |
| Charts:- Daily , Weekly | |
| Add AVRO to Watchlist: View: Get Complete AVRO Trend Analysis ➞ | |
 | OPK OPKO Health, Inc. |
| Sector: Health Care | |
| SubSector: Biotechnology | |
| MarketCap: 1116.05 Millions | |
| Recent Price: 1.27 Market Intelligence Score: 88 | |
| Day Percent Change: 4.10% Day Change: 0.05 | |
| Week Change: 0.79% Year-to-date Change: -15.9% | |
| OPK Links: Profile News Message Board | |
| Charts:- Daily , Weekly | |
| Add OPK to Watchlist: View: Get Complete OPK Trend Analysis ➞ | |
 | JAZZ Jazz Pharmaceuticals plc |
| Sector: Health Care | |
| SubSector: Biotechnology | |
| MarketCap: 5576.05 Millions | |
| Recent Price: 110.31 Market Intelligence Score: 67 | |
| Day Percent Change: -0.40% Day Change: -0.44 | |
| Week Change: 0.78% Year-to-date Change: -10.3% | |
| JAZZ Links: Profile News Message Board | |
| Charts:- Daily , Weekly | |
| Add JAZZ to Watchlist: View: Get Complete JAZZ Trend Analysis ➞ | |
 | INBX Inhibrx, Inc. |
| Sector: Health Care | |
| SubSector: Biotechnology | |
| MarketCap: 14187 Millions | |
| Recent Price: 34.30 Market Intelligence Score: 42 | |
| Day Percent Change: 0.76% Day Change: 0.26 | |
| Week Change: 0.7% Year-to-date Change: -9.8% | |
| INBX Links: Profile News Message Board | |
| Charts:- Daily , Weekly | |
| Add INBX to Watchlist: View: Get Complete INBX Trend Analysis ➞ | |
 | PRAX Praxis Precision Medicines, Inc. |
| Sector: Health Care | |
| SubSector: Biotechnology | |
| MarketCap: 16587 Millions | |
| Recent Price: 55.16 Market Intelligence Score: 56 | |
| Day Percent Change: 0.53% Day Change: 0.29 | |
| Week Change: 0.66% Year-to-date Change: 145.8% | |
| PRAX Links: Profile News Message Board | |
| Charts:- Daily , Weekly | |
| Add PRAX to Watchlist: View: Get Complete PRAX Trend Analysis ➞ | |
 | HOOK HOOKIPA Pharma Inc. |
| Sector: Health Care | |
| SubSector: Biotechnology | |
| MarketCap: 294.785 Millions | |
| Recent Price: 0.90 Market Intelligence Score: 71 | |
| Day Percent Change: 1.32% Day Change: 0.01 | |
| Week Change: 0.64% Year-to-date Change: 11.0% | |
| HOOK Links: Profile News Message Board | |
| Charts:- Daily , Weekly | |
| Add HOOK to Watchlist: View: Get Complete HOOK Trend Analysis ➞ | |
 | CERS Cerus Corporation |
| Sector: Health Care | |
| SubSector: Biotechnology | |
| MarketCap: 607.185 Millions | |
| Recent Price: 1.72 Market Intelligence Score: 44 | |
| Day Percent Change: 2.99% Day Change: 0.05 | |
| Week Change: 0.58% Year-to-date Change: -20.4% | |
| CERS Links: Profile News Message Board | |
| Charts:- Daily , Weekly | |
| Add CERS to Watchlist: View: Get Complete CERS Trend Analysis ➞ | |
 | ALEC Alector, Inc. |
| Sector: Health Care | |
| SubSector: Biotechnology | |
| MarketCap: 2719.35 Millions | |
| Recent Price: 5.28 Market Intelligence Score: 35 | |
| Day Percent Change: 3.94% Day Change: 0.20 | |
| Week Change: 0.57% Year-to-date Change: -33.8% | |
| ALEC Links: Profile News Message Board | |
| Charts:- Daily , Weekly | |
| Add ALEC to Watchlist: View: Get Complete ALEC Trend Analysis ➞ | |
 | ACLX Arcellx, Inc. |
| Sector: Health Care | |
| SubSector: Biotechnology | |
| MarketCap: 1530 Millions | |
| Recent Price: 52.16 Market Intelligence Score: 25 | |
| Day Percent Change: 4.25% Day Change: 2.13 | |
| Week Change: 0.55% Year-to-date Change: -6.5% | |
| ACLX Links: Profile News Message Board | |
| Charts:- Daily , Weekly | |
| Add ACLX to Watchlist: View: Get Complete ACLX Trend Analysis ➞ | |
 | NVCT Nuvectis Pharma, Inc. |
| Sector: Health Care | |
| SubSector: Biotechnology | |
| MarketCap: 258 Millions | |
| Recent Price: 6.54 Market Intelligence Score: 35 | |
| Day Percent Change: 7.48% Day Change: 0.46 | |
| Week Change: 0.54% Year-to-date Change: -21.0% | |
| NVCT Links: Profile News Message Board | |
| Charts:- Daily , Weekly | |
| Add NVCT to Watchlist: View: Get Complete NVCT Trend Analysis ➞ | |
 | ABCL AbCellera Biologics Inc. |
| Sector: Health Care | |
| SubSector: Biotechnology | |
| MarketCap: 1870 Millions | |
| Recent Price: 3.78 Market Intelligence Score: 47 | |
| Day Percent Change: 0.27% Day Change: 0.01 | |
| Week Change: 0.53% Year-to-date Change: -33.1% | |
| ABCL Links: Profile News Message Board | |
| Charts:- Daily , Weekly | |
| Add ABCL to Watchlist: View: Get Complete ABCL Trend Analysis ➞ | |
 | EBS Emergent BioSolutions Inc. |
| Sector: Health Care | |
| SubSector: Biotechnology | |
| MarketCap: 2417.65 Millions | |
| Recent Price: 1.93 Market Intelligence Score: 27 | |
| Day Percent Change: 2.66% Day Change: 0.05 | |
| Week Change: 0.52% Year-to-date Change: -19.6% | |
| EBS Links: Profile News Message Board | |
| Charts:- Daily , Weekly | |
| Add EBS to Watchlist: View: Get Complete EBS Trend Analysis ➞ | |
 | ALXO ALX Oncology Holdings Inc. |
| Sector: Health Care | |
| SubSector: Biotechnology | |
| MarketCap: 41787 Millions | |
| Recent Price: 16.94 Market Intelligence Score: 78 | |
| Day Percent Change: -0.47% Day Change: -0.08 | |
| Week Change: 0.47% Year-to-date Change: 13.8% | |
| ALXO Links: Profile News Message Board | |
| Charts:- Daily , Weekly | |
| Add ALXO to Watchlist: View: Get Complete ALXO Trend Analysis ➞ | |
 | CERE Cerevel Therapeutics Holdings, Inc. |
| Sector: Health Care | |
| SubSector: Biotechnology | |
| MarketCap: 21587 Millions | |
| Recent Price: 42.63 Market Intelligence Score: 83 | |
| Day Percent Change: -0.19% Day Change: -0.08 | |
| Week Change: 0.38% Year-to-date Change: 0.6% | |
| CERE Links: Profile News Message Board | |
| Charts:- Daily , Weekly | |
| Add CERE to Watchlist: View: Get Complete CERE Trend Analysis ➞ | |
 | ARVN Arvinas, Inc. |
| Sector: Health Care | |
| SubSector: Biotechnology | |
| MarketCap: 3469.85 Millions | |
| Recent Price: 32.48 Market Intelligence Score: 25 | |
| Day Percent Change: 2.23% Day Change: 0.71 | |
| Week Change: 0.34% Year-to-date Change: -21.1% | |
| ARVN Links: Profile News Message Board | |
| Charts:- Daily , Weekly | |
| Add ARVN to Watchlist: View: Get Complete ARVN Trend Analysis ➞ | |
 | GBIO Generation Bio Co. |
| Sector: Health Care | |
| SubSector: Biotechnology | |
| MarketCap: 17487 Millions | |
| Recent Price: 2.91 Market Intelligence Score: 41 | |
| Day Percent Change: 2.83% Day Change: 0.08 | |
| Week Change: 0.34% Year-to-date Change: 76.4% | |
| GBIO Links: Profile News Message Board | |
| Charts:- Daily , Weekly | |
| Add GBIO to Watchlist: View: Get Complete GBIO Trend Analysis ➞ | |
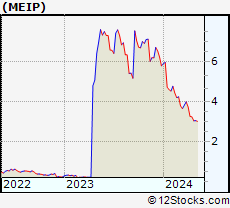 | MEIP MEI Pharma, Inc. |
| Sector: Health Care | |
| SubSector: Biotechnology | |
| MarketCap: 145.185 Millions | |
| Recent Price: 3.06 Market Intelligence Score: 27 | |
| Day Percent Change: 0.33% Day Change: 0.01 | |
| Week Change: 0.33% Year-to-date Change: -47.2% | |
| MEIP Links: Profile News Message Board | |
| Charts:- Daily , Weekly | |
| Add MEIP to Watchlist: View: Get Complete MEIP Trend Analysis ➞ | |
 | ROIV Roivant Sciences Ltd. |
| Sector: Health Care | |
| SubSector: Biotechnology | |
| MarketCap: 7780 Millions | |
| Recent Price: 11.07 Market Intelligence Score: 57 | |
| Day Percent Change: 1.51% Day Change: 0.16 | |
| Week Change: 0.27% Year-to-date Change: -0.4% | |
| ROIV Links: Profile News Message Board | |
| Charts:- Daily , Weekly | |
| Add ROIV to Watchlist: View: Get Complete ROIV Trend Analysis ➞ | |
 | RPRX Royalty Pharma plc |
| Sector: Health Care | |
| SubSector: Biotechnology | |
| MarketCap: 28457 Millions | |
| Recent Price: 28.07 Market Intelligence Score: 17 | |
| Day Percent Change: 1.34% Day Change: 0.37 | |
| Week Change: 0.25% Year-to-date Change: -0.1% | |
| RPRX Links: Profile News Message Board | |
| Charts:- Daily , Weekly | |
| Add RPRX to Watchlist: View: Get Complete RPRX Trend Analysis ➞ | |
 | SLRN Acelyrin, Inc. |
| Sector: Health Care | |
| SubSector: Biotechnology | |
| MarketCap: 2030 Millions | |
| Recent Price: 4.25 Market Intelligence Score: 27 | |
| Day Percent Change: 1.92% Day Change: 0.08 | |
| Week Change: 0.24% Year-to-date Change: -42.3% | |
| SLRN Links: Profile News Message Board | |
| Charts:- Daily , Weekly | |
| Add SLRN to Watchlist: View: Get Complete SLRN Trend Analysis ➞ | |
 | TARA ArTara Therapeutics, Inc. |
| Sector: Health Care | |
| SubSector: Biotechnology | |
| MarketCap: 140.685 Millions | |
| Recent Price: 2.93 Market Intelligence Score: 12 | |
| Day Percent Change: -1.68% Day Change: -0.05 | |
| Week Change: 0.17% Year-to-date Change: 56.3% | |
| TARA Links: Profile News Message Board | |
| Charts:- Daily , Weekly | |
| Add TARA to Watchlist: View: Get Complete TARA Trend Analysis ➞ | |
 | BDTX Black Diamond Therapeutics, Inc. |
| Sector: Health Care | |
| SubSector: Biotechnology | |
| MarketCap: 12587 Millions | |
| Recent Price: 5.90 Market Intelligence Score: 75 | |
| Day Percent Change: 5.92% Day Change: 0.33 | |
| Week Change: 0.17% Year-to-date Change: 110.0% | |
| BDTX Links: Profile News Message Board | |
| Charts:- Daily , Weekly | |
| Add BDTX to Watchlist: View: Get Complete BDTX Trend Analysis ➞ | |
 | GILD Gilead Sciences, Inc. |
| Sector: Health Care | |
| SubSector: Biotechnology | |
| MarketCap: 99485.6 Millions | |
| Recent Price: 65.51 Market Intelligence Score: 35 | |
| Day Percent Change: 0.48% Day Change: 0.31 | |
| Week Change: 0.14% Year-to-date Change: -19.1% | |
| GILD Links: Profile News Message Board | |
| Charts:- Daily , Weekly | |
| Add GILD to Watchlist: View: Get Complete GILD Trend Analysis ➞ | |
 | NAMS NewAmsterdam Pharma Company N.V. |
| Sector: Health Care | |
| SubSector: Biotechnology | |
| MarketCap: 979 Millions | |
| Recent Price: 21.97 Market Intelligence Score: 44 | |
| Day Percent Change: 0.73% Day Change: 0.16 | |
| Week Change: 0.09% Year-to-date Change: 95.5% | |
| NAMS Links: Profile News Message Board | |
| Charts:- Daily , Weekly | |
| Add NAMS to Watchlist: View: Get Complete NAMS Trend Analysis ➞ | |
| To view more stocks, click on Next / Previous arrows or select different range: 0 - 25 , 25 - 50 , 50 - 75 , 75 - 100 , 100 - 125 , 125 - 150 , 150 - 175 , 175 - 200 , 200 - 225 , 225 - 250 , 250 - 275 , 275 - 300 , 300 - 325 , 325 - 350 , 350 - 375 , 375 - 400 | ||
| Click To Change The Sort Order: By Market Cap or Company Size Performance: Year-to-date, Week and Day | |
| Select Chart Type: | ||
|
Best Stocks Today 12Stocks.com |
© 2024 12Stocks.com Terms & Conditions Privacy Contact Us
All Information Provided Only For Education And Not To Be Used For Investing or Trading. See Terms & Conditions


One More Thing ... Get Best Stocks Delivered Daily!
Never Ever Miss A Move With Our Top Ten Stocks Lists
Find Best Stocks In Any Market - Bull or Bear Market
Take A Peek At Our Top Ten Stocks Lists: Daily, Weekly, Year-to-Date & Top Trends
Find Best Stocks In Any Market - Bull or Bear Market
Take A Peek At Our Top Ten Stocks Lists: Daily, Weekly, Year-to-Date & Top Trends
Biotech Stocks With Best Up Trends [0-bearish to 100-bullish]: CytomX [100], Summit [100], Xencor [100], Humacyte [100], Mesoblast [100], United [100], Nuvation Bio[100], AnaptysBio [100], PTC [100], Revolution Medicines[100], Cullinan Oncology[100]
Best Biotech Stocks Year-to-Date:
Pieris [6317.58%], Avenue [2856.52%], Precision [2771.23%], Inovio [2172.55%], Assembly [1518.1%], Agenus [1501.64%], NuCana [1245.5%], Adverum nologies[1200.48%], Affimed N.V[756%], Mesoblast [555.45%], Corbus [516.72%] Best Biotech Stocks This Week:
CytomX [222.64%], Deciphera [73.11%], Cue Biopharma[39.56%], Seres [30.91%], Poseida [30.05%], Exscientia [27.14%], Nektar [25%], AnaptysBio [23.9%], Janux [22.62%], Personalis [22.53%], Summit [21.76%] Best Biotech Stocks Daily:
CytomX [214.72%], Ventyx [24.63%], Summit [19.59%], Cabaletta Bio[16.58%], TG [16.25%], Bio-Techne [16.22%], Brainstorm Cell[15.10%], Wave Life[15.01%], Poseida [14.46%], Xencor [14.28%], NextCure [13.22%]