
 Login Sign Up


| |||||
 |  | ||||

| 12Stocks.com Market Intelligence |
Best Biotech Stocks
|
|
| Quick Read: Best Biotech Stocks List By Performances & Trends: Daily, Weekly, Year-to-Date, Market Cap (Size) & Technical Trends | |||
| Best Biotech Stocks Views: Quick Browse View, Summary & Slide Show View | |||
| 12Stocks.com Biotech Stocks Performances & Trends Daily | |||||||||
|
|  The overall market intelligence score is 69 (0-bearish to 100-bullish) which puts Biotech sector in short term neutral to bullish trend. The market intelligence score from previous trading session is 50 and hence an improvement of trend.
| ||||||||
Here are the market intelligence trend scores of the most requested Biotech stocks at 12Stocks.com (click stock name for detailed review):
|


| 12Stocks.com: Investing in Biotech sector with Stocks | |
|
The following table helps investors and traders sort through current performance and trends (as measured by market intelligence score) of various
stocks in the Biotech sector. Quick View: Move mouse or cursor over stock symbol (ticker) to view short-term Technical chart and over stock name to view long term chart. Click on  to add stock symbol to your watchlist and to add stock symbol to your watchlist and  to view watchlist. Click on any ticker or stock name for detailed market intelligence report for that stock. to view watchlist. Click on any ticker or stock name for detailed market intelligence report for that stock. |
12Stocks.com Performance of Stocks in Biotech Sector
| Ticker | Stock Name | Watchlist | Category | Recent Price | Market Intelligence Score | Change % | Weekly Change% |
| ASND | Ascendis Pharma |   | Biotechnology | 137.20 | 0 | -2.76% | 0.96% |
| RCUS | Arcus | | Biotechnology | 15.70 | 49 | 1.29% | 0.96% |
| PROK | ProKidney | | Biotechnology | 2.13 | 71 | -2.06% | 0.95% |
| VRTX | Vertex | | Biotechnology | 401.08 | 50 | 0.23% | 0.91% |
| IONS | Ionis | | Biotechnology | 41.97 | 40 | -2.60% | 0.91% |
| AVRO | AVROBIO | | Biotechnology | 1.22 | 42 | -0.81% | 0.83% |
| PGEN | Precigen | | Biotechnology | 1.42 | 62 | 1.43% | 0.71% |
| NAMS | NewAmsterdam Pharma | | Biotechnology | 22.11 | 47 | -1.01% | 0.71% |
| MBIO | Mustang Bio | | Biotechnology | 0.32 | 42 | 8.46% | 0.54% |
| DSGN | Design | | Biotechnology | 3.80 | 83 | 3.83% | 0.53% |
| XOMAO | XOMA | | Biotechnology | 25.10 | 83 | 0.00% | 0.52% |
| JAZZ | Jazz | | Biotechnology | 110.01 | 52 | 0.66% | 0.50% |
| SLN | Silence | | Biotechnology | 21.68 | 17 | 1.76% | 0.37% |
| VIGL | Vigil Neuroscience | | Biotechnology | 2.72 | 42 | 4.82% | 0.37% |
| PRTC | PureTech Health | | Biotechnology | 27.97 | 83 | 3.40% | 0.34% |
| MEIP | MEI Pharma | | Biotechnology | 3.06 | 35 | -0.65% | 0.33% |
| RGEN | Repligen | | Biotechnology | 167.05 | 42 | 0.44% | 0.28% |
| LEGN | Legend | | Biotechnology | 45.42 | 32 | -1.10% | 0.28% |
| FENC | Fennec | | Biotechnology | 9.23 | 25 | 1.54% | 0.22% |
| INBX | Inhibrx | | Biotechnology | 34.13 | 25 | 0.35% | 0.21% |
| CERE | Cerevel | | Biotechnology | 42.55 | 71 | -0.09% | 0.19% |
| XCUR | Exicure | | Biotechnology | 0.50 | 20 | 0.00% | 0.18% |
| FUSN | Fusion | | Biotechnology | 21.45 | 70 | -0.21% | 0.12% |
| ALVR | AlloVir | | Biotechnology | 0.80 | 78 | -1.14% | 0.03% |
| SVA | Sinovac | | Biotechnology | 6.47 | 27 | 0.00% | 0.00% |
| To view more stocks, click on Next / Previous arrows or select different range: 0 - 25 , 25 - 50 , 50 - 75 , 75 - 100 , 100 - 125 , 125 - 150 , 150 - 175 , 175 - 200 , 200 - 225 , 225 - 250 , 250 - 275 , 275 - 300 , 300 - 325 , 325 - 350 , 350 - 375 , 375 - 400 | ||
 | Click To Change The Sort Order: By Market Cap or Company Size Performance: Year-to-date, Week and Day |  |
|
Get the most comprehensive stock market coverage daily at 12Stocks.com ➞ Best Stocks Today ➞ Best Stocks Weekly ➞ Best Stocks Year-to-Date ➞ Best Stocks Trends ➞  Best Stocks Today 12Stocks.com Best Nasdaq Stocks ➞ Best S&P 500 Stocks ➞ Best Tech Stocks ➞ Best Biotech Stocks ➞ |
| Detailed Overview of Biotech Stocks |
| Biotech Technical Overview, Leaders & Laggards, Top Biotech ETF Funds & Detailed Biotech Stocks List, Charts, Trends & More |
| Biotech Sector: Technical Analysis, Trends & YTD Performance | |
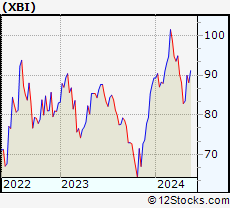
| Biotech sector, as represented by XBI, an exchange-traded fund [ETF] that holds basket of Biotech stocks (e.g, Amgen, Celgene) is up by 0.77% and is currently underperforming the overall market by -6.11% year-to-date. Below is a quick view of Technical charts and trends: | |
 XBI Weekly Chart |
|
| Long Term Trend: Not Good | |
| Medium Term Trend: Very Good | |
 XBI Daily Chart |
|
| Short Term Trend: Very Good | |
| Overall Trend Score: 69 | |
| YTD Performance: 0.77% | |
| **Trend Scores & Views Are Only For Educational Purposes And Not For Investing | |
| 12Stocks.com: Top Performing Biotech Sector Stocks | ||||||||||||||||||||||||||||||||||||||||||||||||
 The top performing Biotech sector stocks year to date are
Now, more recently, over last week, the top performing Biotech sector stocks on the move are


|
||||||||||||||||||||||||||||||||||||||||||||||||
| 12Stocks.com: Investing in Biotech Sector using Exchange Traded Funds | |
|
The following table shows list of key exchange traded funds (ETF) that
help investors track Biotech Index. For detailed view, check out our ETF Funds section of our website. Quick View: Move mouse or cursor over ETF symbol (ticker) to view short-term Technical chart and over ETF name to view long term chart. Click on ticker or stock name for detailed view. Click on to add stock symbol to your watchlist and to view watchlist. |
12Stocks.com List of ETFs that track Biotech Index
| Ticker | ETF Name | Watchlist | Recent Price | Market Intelligence Score | Change % | Week % | Year-to-date % |
| LABD | Biotech Bear 3X | | 8.28 | 36 | -5.48 | -21.29 | -14.55% |
| XBI | Biotech | | 89.98 | 69 | 1.86 | 7.77 | 0.77% |
| LABU | Biotech Bull 3X | | 108.99 | 64 | 5.83 | 24.55 | -10.64% |
| IBB | Biotechnology | | 132.96 | 69 | 1.77 | 5.12 | -2.13% |
| IYH | Healthcare | | 59.26 | 57 | 0.24 | 1.11 | 3.51% |
| IHF | Healthcare Providers | | 51.69 | 30 | 0.08 | -0.44 | -1.56% |
| BIB | Biotechnology | | 55.63 | 74 | 3.40 | 12.02 | -2.49% |
| IXJ | Global Healthcare | | 89.66 | 52 | 0.31 | 0.61 | 3.39% |
| CURE | Healthcare Bull 3X | | 106.89 | 57 | 1.02 | 1.51 | 5.06% |
| PBE | Biotech & Genome | | 64.11 | 74 | 0.85 | 6.18 | -2.63% |
| FBT | First NYSE | | 148.20 | 57 | 0.79 | 3.17 | -6.24% |
| PTH | DWA Healthcare Momentum | | 42.05 | 62 | 0.74 | 5.41 | 7.43% |
| BIS | Short Biotech | | 17.99 | 36 | -3.59 | -11.03 | -0.44% |
| BBC | Bio Biotechnology Clinical | | 27.89 | 69 | 2.05 | 9.24 | 14.06% |
| BBH | Biotech | | 164.15 | 100 | 2.27 | 5.46 | -0.7% |
| BTEC | Principal Healthcare Innovators | | 36.97 | 69 | 2.74 | 7.94 | 1.76% |
| BBP | Bio Biotechnology Products | | 55.49 | 64 | 2.10 | 7.78 | -4.48% |
| 12Stocks.com: Charts, Trends, Fundamental Data and Performances of Biotech Stocks | |
|
We now take in-depth look at all Biotech stocks including charts, multi-period performances and overall trends (as measured by market intelligence score). One can sort Biotech stocks (click link to choose) by Daily, Weekly and by Year-to-Date performances. Also, one can sort by size of the company or by market capitalization. |
| Select Your Default Chart Type: | |||||
| |||||
| Click on stock symbol or name for detailed view. Click on to add stock symbol to your watchlist and to view watchlist. Quick View: Move mouse or cursor over "Daily" to quickly view daily Technical stock chart and over "Weekly" to view weekly Technical stock chart. | |||||

 | ASND Ascendis Pharma A/S |
| Sector: Health Care | |
| SubSector: Biotechnology | |
| MarketCap: 5470.35 Millions | |
| Recent Price: 137.20 Market Intelligence Score: 0 | |
| Day Percent Change: -2.76% Day Change: -3.90 | |
| Week Change: 0.96% Year-to-date Change: 8.9% | |
| ASND Links: Profile News Message Board | |
| Charts:- Daily , Weekly | |
| Add ASND to Watchlist: View: Get Complete ASND Trend Analysis ➞ | |
 | RCUS Arcus Biosciences, Inc. |
| Sector: Health Care | |
| SubSector: Biotechnology | |
| MarketCap: 539.285 Millions | |
| Recent Price: 15.70 Market Intelligence Score: 49 | |
| Day Percent Change: 1.29% Day Change: 0.20 | |
| Week Change: 0.96% Year-to-date Change: -17.8% | |
| RCUS Links: Profile News Message Board | |
| Charts:- Daily , Weekly | |
| Add RCUS to Watchlist: View: Get Complete RCUS Trend Analysis ➞ | |
 | PROK ProKidney Corp. |
| Sector: Health Care | |
| SubSector: Biotechnology | |
| MarketCap: 2470 Millions | |
| Recent Price: 2.13 Market Intelligence Score: 71 | |
| Day Percent Change: -2.06% Day Change: -0.05 | |
| Week Change: 0.95% Year-to-date Change: 22.4% | |
| PROK Links: Profile News Message Board | |
| Charts:- Daily , Weekly | |
| Add PROK to Watchlist: View: Get Complete PROK Trend Analysis ➞ | |
 | VRTX Vertex Pharmaceuticals Incorporated |
| Sector: Health Care | |
| SubSector: Biotechnology | |
| MarketCap: 57669.6 Millions | |
| Recent Price: 401.08 Market Intelligence Score: 50 | |
| Day Percent Change: 0.23% Day Change: 0.92 | |
| Week Change: 0.91% Year-to-date Change: -1.4% | |
| VRTX Links: Profile News Message Board | |
| Charts:- Daily , Weekly | |
| Add VRTX to Watchlist: View: Get Complete VRTX Trend Analysis ➞ | |
 | IONS Ionis Pharmaceuticals, Inc. |
| Sector: Health Care | |
| SubSector: Biotechnology | |
| MarketCap: 6725.05 Millions | |
| Recent Price: 41.97 Market Intelligence Score: 40 | |
| Day Percent Change: -2.60% Day Change: -1.12 | |
| Week Change: 0.91% Year-to-date Change: -17.0% | |
| IONS Links: Profile News Message Board | |
| Charts:- Daily , Weekly | |
| Add IONS to Watchlist: View: Get Complete IONS Trend Analysis ➞ | |
 | AVRO AVROBIO, Inc. |
| Sector: Health Care | |
| SubSector: Biotechnology | |
| MarketCap: 626.185 Millions | |
| Recent Price: 1.22 Market Intelligence Score: 42 | |
| Day Percent Change: -0.81% Day Change: -0.01 | |
| Week Change: 0.83% Year-to-date Change: -10.3% | |
| AVRO Links: Profile News Message Board | |
| Charts:- Daily , Weekly | |
| Add AVRO to Watchlist: View: Get Complete AVRO Trend Analysis ➞ | |
 | PGEN Precigen, Inc. |
| Sector: Health Care | |
| SubSector: Biotechnology | |
| MarketCap: 564.785 Millions | |
| Recent Price: 1.42 Market Intelligence Score: 62 | |
| Day Percent Change: 1.43% Day Change: 0.02 | |
| Week Change: 0.71% Year-to-date Change: 6.0% | |
| PGEN Links: Profile News Message Board | |
| Charts:- Daily , Weekly | |
| Add PGEN to Watchlist: View: Get Complete PGEN Trend Analysis ➞ | |
 | NAMS NewAmsterdam Pharma Company N.V. |
| Sector: Health Care | |
| SubSector: Biotechnology | |
| MarketCap: 979 Millions | |
| Recent Price: 22.11 Market Intelligence Score: 47 | |
| Day Percent Change: -1.01% Day Change: -0.22 | |
| Week Change: 0.71% Year-to-date Change: 96.7% | |
| NAMS Links: Profile News Message Board | |
| Charts:- Daily , Weekly | |
| Add NAMS to Watchlist: View: Get Complete NAMS Trend Analysis ➞ | |
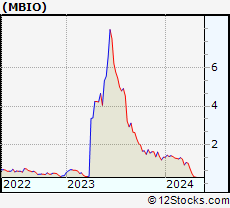 | MBIO Mustang Bio, Inc. |
| Sector: Health Care | |
| SubSector: Biotechnology | |
| MarketCap: 117.785 Millions | |
| Recent Price: 0.32 Market Intelligence Score: 42 | |
| Day Percent Change: 8.46% Day Change: 0.02 | |
| Week Change: 0.54% Year-to-date Change: -76.5% | |
| MBIO Links: Profile News Message Board | |
| Charts:- Daily , Weekly | |
| Add MBIO to Watchlist: View: Get Complete MBIO Trend Analysis ➞ | |
 | DSGN Design Therapeutics, Inc. |
| Sector: Health Care | |
| SubSector: Biotechnology | |
| MarketCap: 367 Millions | |
| Recent Price: 3.80 Market Intelligence Score: 83 | |
| Day Percent Change: 3.83% Day Change: 0.14 | |
| Week Change: 0.53% Year-to-date Change: 43.1% | |
| DSGN Links: Profile News Message Board | |
| Charts:- Daily , Weekly | |
| Add DSGN to Watchlist: View: Get Complete DSGN Trend Analysis ➞ | |
 | XOMAO XOMA Corporation |
| Sector: Health Care | |
| SubSector: Biotechnology | |
| MarketCap: 217 Millions | |
| Recent Price: 25.10 Market Intelligence Score: 83 | |
| Day Percent Change: 0.00% Day Change: 0.00 | |
| Week Change: 0.52% Year-to-date Change: 0.4% | |
| XOMAO Links: Profile News Message Board | |
| Charts:- Daily , Weekly | |
| Add XOMAO to Watchlist: View: Get Complete XOMAO Trend Analysis ➞ | |
 | JAZZ Jazz Pharmaceuticals plc |
| Sector: Health Care | |
| SubSector: Biotechnology | |
| MarketCap: 5576.05 Millions | |
| Recent Price: 110.01 Market Intelligence Score: 52 | |
| Day Percent Change: 0.66% Day Change: 0.72 | |
| Week Change: 0.5% Year-to-date Change: -10.6% | |
| JAZZ Links: Profile News Message Board | |
| Charts:- Daily , Weekly | |
| Add JAZZ to Watchlist: View: Get Complete JAZZ Trend Analysis ➞ | |
 | SLN Silence Therapeutics plc |
| Sector: Health Care | |
| SubSector: Biotechnology | |
| MarketCap: 198 Millions | |
| Recent Price: 21.68 Market Intelligence Score: 17 | |
| Day Percent Change: 1.76% Day Change: 0.38 | |
| Week Change: 0.37% Year-to-date Change: 23.5% | |
| SLN Links: Profile News Message Board | |
| Charts:- Daily , Weekly | |
| Add SLN to Watchlist: View: Get Complete SLN Trend Analysis ➞ | |
 | VIGL Vigil Neuroscience, Inc. |
| Sector: Health Care | |
| SubSector: Biotechnology | |
| MarketCap: 339 Millions | |
| Recent Price: 2.72 Market Intelligence Score: 42 | |
| Day Percent Change: 4.82% Day Change: 0.13 | |
| Week Change: 0.37% Year-to-date Change: -20.7% | |
| VIGL Links: Profile News Message Board | |
| Charts:- Daily , Weekly | |
| Add VIGL to Watchlist: View: Get Complete VIGL Trend Analysis ➞ | |
 | PRTC PureTech Health plc |
| Sector: Health Care | |
| SubSector: Biotechnology | |
| MarketCap: 819 Millions | |
| Recent Price: 27.97 Market Intelligence Score: 83 | |
| Day Percent Change: 3.40% Day Change: 0.92 | |
| Week Change: 0.34% Year-to-date Change: 17.0% | |
| PRTC Links: Profile News Message Board | |
| Charts:- Daily , Weekly | |
| Add PRTC to Watchlist: View: Get Complete PRTC Trend Analysis ➞ | |
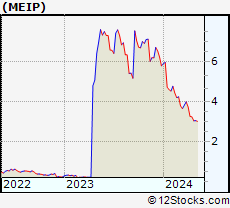 | MEIP MEI Pharma, Inc. |
| Sector: Health Care | |
| SubSector: Biotechnology | |
| MarketCap: 145.185 Millions | |
| Recent Price: 3.06 Market Intelligence Score: 35 | |
| Day Percent Change: -0.65% Day Change: -0.02 | |
| Week Change: 0.33% Year-to-date Change: -47.2% | |
| MEIP Links: Profile News Message Board | |
| Charts:- Daily , Weekly | |
| Add MEIP to Watchlist: View: Get Complete MEIP Trend Analysis ➞ | |
 | RGEN Repligen Corporation |
| Sector: Health Care | |
| SubSector: Biotechnology | |
| MarketCap: 4711.75 Millions | |
| Recent Price: 167.05 Market Intelligence Score: 42 | |
| Day Percent Change: 0.44% Day Change: 0.74 | |
| Week Change: 0.28% Year-to-date Change: -7.1% | |
| RGEN Links: Profile News Message Board | |
| Charts:- Daily , Weekly | |
| Add RGEN to Watchlist: View: Get Complete RGEN Trend Analysis ➞ | |
 | LEGN Legend Biotech Corporation |
| Sector: Health Care | |
| SubSector: Biotechnology | |
| MarketCap: 37387 Millions | |
| Recent Price: 45.42 Market Intelligence Score: 32 | |
| Day Percent Change: -1.10% Day Change: -0.51 | |
| Week Change: 0.28% Year-to-date Change: -24.7% | |
| LEGN Links: Profile News Message Board | |
| Charts:- Daily , Weekly | |
| Add LEGN to Watchlist: View: Get Complete LEGN Trend Analysis ➞ | |
 | FENC Fennec Pharmaceuticals Inc. |
| Sector: Health Care | |
| SubSector: Biotechnology | |
| MarketCap: 126.785 Millions | |
| Recent Price: 9.23 Market Intelligence Score: 25 | |
| Day Percent Change: 1.54% Day Change: 0.14 | |
| Week Change: 0.22% Year-to-date Change: -17.7% | |
| FENC Links: Profile News Message Board | |
| Charts:- Daily , Weekly | |
| Add FENC to Watchlist: View: Get Complete FENC Trend Analysis ➞ | |
 | INBX Inhibrx, Inc. |
| Sector: Health Care | |
| SubSector: Biotechnology | |
| MarketCap: 14187 Millions | |
| Recent Price: 34.13 Market Intelligence Score: 25 | |
| Day Percent Change: 0.35% Day Change: 0.12 | |
| Week Change: 0.21% Year-to-date Change: -10.2% | |
| INBX Links: Profile News Message Board | |
| Charts:- Daily , Weekly | |
| Add INBX to Watchlist: View: Get Complete INBX Trend Analysis ➞ | |
 | CERE Cerevel Therapeutics Holdings, Inc. |
| Sector: Health Care | |
| SubSector: Biotechnology | |
| MarketCap: 21587 Millions | |
| Recent Price: 42.55 Market Intelligence Score: 71 | |
| Day Percent Change: -0.09% Day Change: -0.04 | |
| Week Change: 0.19% Year-to-date Change: 0.4% | |
| CERE Links: Profile News Message Board | |
| Charts:- Daily , Weekly | |
| Add CERE to Watchlist: View: Get Complete CERE Trend Analysis ➞ | |
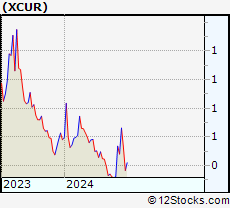 | XCUR Exicure, Inc. |
| Sector: Health Care | |
| SubSector: Biotechnology | |
| MarketCap: 113.785 Millions | |
| Recent Price: 0.50 Market Intelligence Score: 20 | |
| Day Percent Change: 0.00% Day Change: 0.00 | |
| Week Change: 0.18% Year-to-date Change: -13.7% | |
| XCUR Links: Profile News Message Board | |
| Charts:- Daily , Weekly | |
| Add XCUR to Watchlist: View: Get Complete XCUR Trend Analysis ➞ | |
 | FUSN Fusion Pharmaceuticals Inc. |
| Sector: Health Care | |
| SubSector: Biotechnology | |
| MarketCap: 52487 Millions | |
| Recent Price: 21.45 Market Intelligence Score: 70 | |
| Day Percent Change: -0.21% Day Change: -0.04 | |
| Week Change: 0.12% Year-to-date Change: 123.4% | |
| FUSN Links: Profile News Message Board | |
| Charts:- Daily , Weekly | |
| Add FUSN to Watchlist: View: Get Complete FUSN Trend Analysis ➞ | |
 | ALVR AlloVir, Inc. |
| Sector: Health Care | |
| SubSector: Biotechnology | |
| MarketCap: 25787 Millions | |
| Recent Price: 0.80 Market Intelligence Score: 78 | |
| Day Percent Change: -1.14% Day Change: -0.01 | |
| Week Change: 0.03% Year-to-date Change: 17.3% | |
| ALVR Links: Profile News Message Board | |
| Charts:- Daily , Weekly | |
| Add ALVR to Watchlist: View: Get Complete ALVR Trend Analysis ➞ | |
 | SVA Sinovac Biotech Ltd. |
| Sector: Health Care | |
| SubSector: Biotechnology | |
| MarketCap: 336.88 Millions | |
| Recent Price: 6.47 Market Intelligence Score: 27 | |
| Day Percent Change: 0.00% Day Change: 0.00 | |
| Week Change: 0% Year-to-date Change: 0.0% | |
| SVA Links: Profile News Message Board | |
| Charts:- Daily , Weekly | |
| Add SVA to Watchlist: View: Get Complete SVA Trend Analysis ➞ | |
| To view more stocks, click on Next / Previous arrows or select different range: 0 - 25 , 25 - 50 , 50 - 75 , 75 - 100 , 100 - 125 , 125 - 150 , 150 - 175 , 175 - 200 , 200 - 225 , 225 - 250 , 250 - 275 , 275 - 300 , 300 - 325 , 325 - 350 , 350 - 375 , 375 - 400 | ||
| Click To Change The Sort Order: By Market Cap or Company Size Performance: Year-to-date, Week and Day | |
| Select Chart Type: | ||
|
Best Stocks Today 12Stocks.com |
© 2024 12Stocks.com Terms & Conditions Privacy Contact Us
All Information Provided Only For Education And Not To Be Used For Investing or Trading. See Terms & Conditions


One More Thing ... Get Best Stocks Delivered Daily!
Never Ever Miss A Move With Our Top Ten Stocks Lists
Find Best Stocks In Any Market - Bull or Bear Market
Take A Peek At Our Top Ten Stocks Lists: Daily, Weekly, Year-to-Date & Top Trends
Find Best Stocks In Any Market - Bull or Bear Market
Take A Peek At Our Top Ten Stocks Lists: Daily, Weekly, Year-to-Date & Top Trends
Biotech Stocks With Best Up Trends [0-bearish to 100-bullish]: Emergent Bio[100], Amgen [100], Quantum-Si [100], Janux [100], SIGA Technologies[100], Verrica [100], Genmab A/S[100], Black Diamond[100], PMV [100], Wave Life[100], Voyager [100]
Best Biotech Stocks Year-to-Date:
Pieris [5987.91%], Avenue [2868.94%], Precision [2782.19%], Inovio [2272.55%], Assembly [1503.46%], Agenus [1478.69%], Adverum nologies[1285.49%], NuCana [1252.27%], Affimed N.V[767.2%], Mesoblast [581.82%], Corbus [541.89%] Best Biotech Stocks This Week:
CytomX [178.62%], Emergent Bio[102.6%], Deciphera [73.24%], Cue Biopharma[56.04%], Codexis [47.37%], Abeona [41.1%], Seres [40.61%], Ardelyx [35.83%], Poseida [35.21%], CureVac N.V[33.91%], Janux [31.95%] Best Biotech Stocks Daily:
Ardelyx [28.42%], Emergent Bio[17.88%], Codexis [17.37%], Vaxxinity [17.27%], Cue Biopharma[13.30%], Vir nology[13.18%], Lantern Pharma[13.11%], Abeona [13.02%], CureVac N.V[12.64%], Ginkgo Bioworks[12.33%], Rani [12.13%]