
 Login Sign Up


| |||||
 |  | ||||

| 12Stocks.com Market Intelligence |
Best Biotech Stocks
|
|
| Quick Read: Best Biotech Stocks List By Performances & Trends: Daily, Weekly, Year-to-Date, Market Cap (Size) & Technical Trends | |||
| Best Biotech Stocks Views: Quick Browse View, Summary & Slide Show View | |||
| 12Stocks.com Biotech Stocks Performances & Trends Daily | |||||||||
|
|  The overall market intelligence score is 69 (0-bearish to 100-bullish) which puts Biotech sector in short term neutral to bullish trend. The market intelligence score from previous trading session is 50 and hence an improvement of trend.
| ||||||||
Here are the market intelligence trend scores of the most requested Biotech stocks at 12Stocks.com (click stock name for detailed review):
|


| 12Stocks.com: Investing in Biotech sector with Stocks | |
|
The following table helps investors and traders sort through current performance and trends (as measured by market intelligence score) of various
stocks in the Biotech sector. Quick View: Move mouse or cursor over stock symbol (ticker) to view short-term Technical chart and over stock name to view long term chart. Click on  to add stock symbol to your watchlist and to add stock symbol to your watchlist and  to view watchlist. Click on any ticker or stock name for detailed market intelligence report for that stock. to view watchlist. Click on any ticker or stock name for detailed market intelligence report for that stock. |
12Stocks.com Performance of Stocks in Biotech Sector
| Ticker | Stock Name | Watchlist | Category | Recent Price | Market Intelligence Score | Change % | Weekly Change% |
| SGMO | Sangamo |   | Biotechnology | 0.56 | 52 | 6.48% | 7.34% |
| UBX | Unity nology | | Biotechnology | 1.61 | 64 | -1.23% | 7.33% |
| ACRV | Acrivon | | Biotechnology | 9.08 | 60 | 7.14% | 7.33% |
| IPSC | Century | | Biotechnology | 3.09 | 44 | 4.22% | 7.29% |
| OCX | OncoCyte | | Biotechnology | 2.66 | 49 | -4.28% | 7.26% |
| SPRB | Spruce | | Biotechnology | 0.75 | 59 | 1.19% | 7.20% |
| OLMA | Olema | | Biotechnology | 10.66 | 49 | 5.86% | 7.14% |
| IGMS | IGM | | Biotechnology | 10.07 | 74 | 6.79% | 7.13% |
| OCEA | Ocean Biomedical | | Biotechnology | 1.44 | 42 | 3.24% | 7.09% |
| INZY | Inozyme Pharma | | Biotechnology | 4.75 | 39 | 2.15% | 6.98% |
| BCRX | BioCryst | | Biotechnology | 4.45 | 59 | -0.67% | 6.97% |
| FATE | Fate | | Biotechnology | 4.06 | 37 | -0.98% | 6.84% |
| RCKT | Rocket | | Biotechnology | 23.47 | 42 | 3.07% | 6.78% |
| AVIR | Atea | | Biotechnology | 3.96 | 54 | 3.39% | 6.74% |
| CNTA | Centessa | | Biotechnology | 9.53 | 32 | 0.95% | 6.66% |
| KPTI | Karyopharm | | Biotechnology | 1.13 | 42 | 4.63% | 6.60% |
| RANI | Rani | | Biotechnology | 7.12 | 93 | 12.13% | 6.59% |
| EDIT | Editas Medicine | | Biotechnology | 5.67 | 49 | 0.89% | 6.58% |
| HRTX | Heron | | Biotechnology | 2.61 | 32 | 2.35% | 6.53% |
| KZR | Kezar Life | | Biotechnology | 0.86 | 32 | 0.32% | 6.52% |
| MORF | Morphic Holding | | Biotechnology | 29.90 | 74 | 4.14% | 6.52% |
| GLSI | Greenwich Life | | Biotechnology | 13.98 | 70 | -0.11% | 6.52% |
| VERV | Verve | | Biotechnology | 6.53 | 42 | 8.11% | 6.35% |
| BNTX | BioNTech SE | | Biotechnology | 92.72 | 100 | 0.52% | 6.32% |
| NVCT | Nuvectis Pharma | | Biotechnology | 6.91 | 42 | 4.38% | 6.31% |
| To view more stocks, click on Next / Previous arrows or select different range: 0 - 25 , 25 - 50 , 50 - 75 , 75 - 100 , 100 - 125 , 125 - 150 , 150 - 175 , 175 - 200 , 200 - 225 , 225 - 250 , 250 - 275 , 275 - 300 , 300 - 325 , 325 - 350 , 350 - 375 , 375 - 400 | ||
 | Click To Change The Sort Order: By Market Cap or Company Size Performance: Year-to-date, Week and Day |  |
|
Get the most comprehensive stock market coverage daily at 12Stocks.com ➞ Best Stocks Today ➞ Best Stocks Weekly ➞ Best Stocks Year-to-Date ➞ Best Stocks Trends ➞  Best Stocks Today 12Stocks.com Best Nasdaq Stocks ➞ Best S&P 500 Stocks ➞ Best Tech Stocks ➞ Best Biotech Stocks ➞ |
| Detailed Overview of Biotech Stocks |
| Biotech Technical Overview, Leaders & Laggards, Top Biotech ETF Funds & Detailed Biotech Stocks List, Charts, Trends & More |
| Biotech Sector: Technical Analysis, Trends & YTD Performance | |
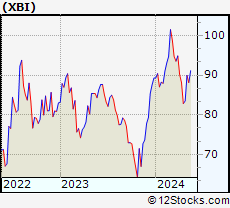
| Biotech sector, as represented by XBI, an exchange-traded fund [ETF] that holds basket of Biotech stocks (e.g, Amgen, Celgene) is up by 0.77% and is currently underperforming the overall market by -6.11% year-to-date. Below is a quick view of Technical charts and trends: | |
 XBI Weekly Chart |
|
| Long Term Trend: Not Good | |
| Medium Term Trend: Very Good | |
 XBI Daily Chart |
|
| Short Term Trend: Very Good | |
| Overall Trend Score: 69 | |
| YTD Performance: 0.77% | |
| **Trend Scores & Views Are Only For Educational Purposes And Not For Investing | |
| 12Stocks.com: Top Performing Biotech Sector Stocks | ||||||||||||||||||||||||||||||||||||||||||||||||
 The top performing Biotech sector stocks year to date are
Now, more recently, over last week, the top performing Biotech sector stocks on the move are


|
||||||||||||||||||||||||||||||||||||||||||||||||
| 12Stocks.com: Investing in Biotech Sector using Exchange Traded Funds | |
|
The following table shows list of key exchange traded funds (ETF) that
help investors track Biotech Index. For detailed view, check out our ETF Funds section of our website. Quick View: Move mouse or cursor over ETF symbol (ticker) to view short-term Technical chart and over ETF name to view long term chart. Click on ticker or stock name for detailed view. Click on to add stock symbol to your watchlist and to view watchlist. |
12Stocks.com List of ETFs that track Biotech Index
| Ticker | ETF Name | Watchlist | Recent Price | Market Intelligence Score | Change % | Week % | Year-to-date % |
| LABD | Biotech Bear 3X | | 8.28 | 36 | -5.48 | -21.29 | -14.55% |
| XBI | Biotech | | 89.98 | 69 | 1.86 | 7.77 | 0.77% |
| LABU | Biotech Bull 3X | | 108.99 | 64 | 5.83 | 24.55 | -10.64% |
| IBB | Biotechnology | | 132.96 | 69 | 1.77 | 5.12 | -2.13% |
| IYH | Healthcare | | 59.26 | 57 | 0.24 | 1.11 | 3.51% |
| IHF | Healthcare Providers | | 51.69 | 30 | 0.08 | -0.44 | -1.56% |
| BIB | Biotechnology | | 55.63 | 74 | 3.40 | 12.02 | -2.49% |
| IXJ | Global Healthcare | | 89.66 | 52 | 0.31 | 0.61 | 3.39% |
| CURE | Healthcare Bull 3X | | 106.89 | 57 | 1.02 | 1.51 | 5.06% |
| PBE | Biotech & Genome | | 64.11 | 74 | 0.85 | 6.18 | -2.63% |
| FBT | First NYSE | | 148.20 | 57 | 0.79 | 3.17 | -6.24% |
| PTH | DWA Healthcare Momentum | | 42.05 | 62 | 0.74 | 5.41 | 7.43% |
| BIS | Short Biotech | | 17.99 | 36 | -3.59 | -11.03 | -0.44% |
| BBC | Bio Biotechnology Clinical | | 27.89 | 69 | 2.05 | 9.24 | 14.06% |
| BBH | Biotech | | 164.15 | 100 | 2.27 | 5.46 | -0.7% |
| BTEC | Principal Healthcare Innovators | | 36.97 | 69 | 2.74 | 7.94 | 1.76% |
| BBP | Bio Biotechnology Products | | 55.49 | 64 | 2.10 | 7.78 | -4.48% |
| 12Stocks.com: Charts, Trends, Fundamental Data and Performances of Biotech Stocks | |
|
We now take in-depth look at all Biotech stocks including charts, multi-period performances and overall trends (as measured by market intelligence score). One can sort Biotech stocks (click link to choose) by Daily, Weekly and by Year-to-Date performances. Also, one can sort by size of the company or by market capitalization. |
| Select Your Default Chart Type: | |||||
| |||||
| Click on stock symbol or name for detailed view. Click on to add stock symbol to your watchlist and to view watchlist. Quick View: Move mouse or cursor over "Daily" to quickly view daily Technical stock chart and over "Weekly" to view weekly Technical stock chart. | |||||

 | SGMO Sangamo Therapeutics, Inc. |
| Sector: Health Care | |
| SubSector: Biotechnology | |
| MarketCap: 779.285 Millions | |
| Recent Price: 0.56 Market Intelligence Score: 52 | |
| Day Percent Change: 6.48% Day Change: 0.03 | |
| Week Change: 7.34% Year-to-date Change: 2.3% | |
| SGMO Links: Profile News Message Board | |
| Charts:- Daily , Weekly | |
| Add SGMO to Watchlist: View: Get Complete SGMO Trend Analysis ➞ | |
 | UBX Unity Biotechnology, Inc. |
| Sector: Health Care | |
| SubSector: Biotechnology | |
| MarketCap: 254.985 Millions | |
| Recent Price: 1.61 Market Intelligence Score: 64 | |
| Day Percent Change: -1.23% Day Change: -0.02 | |
| Week Change: 7.33% Year-to-date Change: -16.6% | |
| UBX Links: Profile News Message Board | |
| Charts:- Daily , Weekly | |
| Add UBX to Watchlist: View: Get Complete UBX Trend Analysis ➞ | |
 | ACRV Acrivon Therapeutics, Inc. |
| Sector: Health Care | |
| SubSector: Biotechnology | |
| MarketCap: 286 Millions | |
| Recent Price: 9.08 Market Intelligence Score: 60 | |
| Day Percent Change: 7.14% Day Change: 0.61 | |
| Week Change: 7.33% Year-to-date Change: 82.7% | |
| ACRV Links: Profile News Message Board | |
| Charts:- Daily , Weekly | |
| Add ACRV to Watchlist: View: Get Complete ACRV Trend Analysis ➞ | |
 | IPSC Century Therapeutics, Inc. |
| Sector: Health Care | |
| SubSector: Biotechnology | |
| MarketCap: 187 Millions | |
| Recent Price: 3.09 Market Intelligence Score: 44 | |
| Day Percent Change: 4.22% Day Change: 0.13 | |
| Week Change: 7.29% Year-to-date Change: -6.4% | |
| IPSC Links: Profile News Message Board | |
| Charts:- Daily , Weekly | |
| Add IPSC to Watchlist: View: Get Complete IPSC Trend Analysis ➞ | |
 | OCX OncoCyte Corporation |
| Sector: Health Care | |
| SubSector: Biotechnology | |
| MarketCap: 131.485 Millions | |
| Recent Price: 2.66 Market Intelligence Score: 49 | |
| Day Percent Change: -4.28% Day Change: -0.12 | |
| Week Change: 7.26% Year-to-date Change: 6.4% | |
| OCX Links: Profile News Message Board | |
| Charts:- Daily , Weekly | |
| Add OCX to Watchlist: View: Get Complete OCX Trend Analysis ➞ | |
 | SPRB Spruce Biosciences, Inc. |
| Sector: Health Care | |
| SubSector: Biotechnology | |
| MarketCap: 49487 Millions | |
| Recent Price: 0.75 Market Intelligence Score: 59 | |
| Day Percent Change: 1.19% Day Change: 0.01 | |
| Week Change: 7.2% Year-to-date Change: -74.3% | |
| SPRB Links: Profile News Message Board | |
| Charts:- Daily , Weekly | |
| Add SPRB to Watchlist: View: Get Complete SPRB Trend Analysis ➞ | |
 | OLMA Olema Pharmaceuticals, Inc. |
| Sector: Health Care | |
| SubSector: Biotechnology | |
| MarketCap: 17687 Millions | |
| Recent Price: 10.66 Market Intelligence Score: 49 | |
| Day Percent Change: 5.86% Day Change: 0.59 | |
| Week Change: 7.14% Year-to-date Change: -24.2% | |
| OLMA Links: Profile News Message Board | |
| Charts:- Daily , Weekly | |
| Add OLMA to Watchlist: View: Get Complete OLMA Trend Analysis ➞ | |
 | IGMS IGM Biosciences, Inc. |
| Sector: Health Care | |
| SubSector: Biotechnology | |
| MarketCap: 2000.05 Millions | |
| Recent Price: 10.07 Market Intelligence Score: 74 | |
| Day Percent Change: 6.79% Day Change: 0.64 | |
| Week Change: 7.13% Year-to-date Change: 21.2% | |
| IGMS Links: Profile News Message Board | |
| Charts:- Daily , Weekly | |
| Add IGMS to Watchlist: View: Get Complete IGMS Trend Analysis ➞ | |
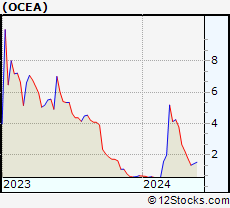 | OCEA Ocean Biomedical, Inc. |
| Sector: Health Care | |
| SubSector: Biotechnology | |
| MarketCap: 203 Millions | |
| Recent Price: 1.44 Market Intelligence Score: 42 | |
| Day Percent Change: 3.24% Day Change: 0.05 | |
| Week Change: 7.09% Year-to-date Change: 115.7% | |
| OCEA Links: Profile News Message Board | |
| Charts:- Daily , Weekly | |
| Add OCEA to Watchlist: View: Get Complete OCEA Trend Analysis ➞ | |
 | INZY Inozyme Pharma, Inc. |
| Sector: Health Care | |
| SubSector: Biotechnology | |
| MarketCap: 53487 Millions | |
| Recent Price: 4.75 Market Intelligence Score: 39 | |
| Day Percent Change: 2.15% Day Change: 0.10 | |
| Week Change: 6.98% Year-to-date Change: 11.6% | |
| INZY Links: Profile News Message Board | |
| Charts:- Daily , Weekly | |
| Add INZY to Watchlist: View: Get Complete INZY Trend Analysis ➞ | |
 | BCRX BioCryst Pharmaceuticals, Inc. |
| Sector: Health Care | |
| SubSector: Biotechnology | |
| MarketCap: 369.385 Millions | |
| Recent Price: 4.45 Market Intelligence Score: 59 | |
| Day Percent Change: -0.67% Day Change: -0.03 | |
| Week Change: 6.97% Year-to-date Change: -25.7% | |
| BCRX Links: Profile News Message Board | |
| Charts:- Daily , Weekly | |
| Add BCRX to Watchlist: View: Get Complete BCRX Trend Analysis ➞ | |
 | FATE Fate Therapeutics, Inc. |
| Sector: Health Care | |
| SubSector: Biotechnology | |
| MarketCap: 2022.45 Millions | |
| Recent Price: 4.06 Market Intelligence Score: 37 | |
| Day Percent Change: -0.98% Day Change: -0.04 | |
| Week Change: 6.84% Year-to-date Change: 8.6% | |
| FATE Links: Profile News Message Board | |
| Charts:- Daily , Weekly | |
| Add FATE to Watchlist: View: Get Complete FATE Trend Analysis ➞ | |
 | RCKT Rocket Pharmaceuticals, Inc. |
| Sector: Health Care | |
| SubSector: Biotechnology | |
| MarketCap: 899.585 Millions | |
| Recent Price: 23.47 Market Intelligence Score: 42 | |
| Day Percent Change: 3.07% Day Change: 0.70 | |
| Week Change: 6.78% Year-to-date Change: -21.7% | |
| RCKT Links: Profile News Message Board | |
| Charts:- Daily , Weekly | |
| Add RCKT to Watchlist: View: Get Complete RCKT Trend Analysis ➞ | |
 | AVIR Atea Pharmaceuticals, Inc. |
| Sector: Health Care | |
| SubSector: Biotechnology | |
| MarketCap: 22587 Millions | |
| Recent Price: 3.96 Market Intelligence Score: 54 | |
| Day Percent Change: 3.39% Day Change: 0.13 | |
| Week Change: 6.74% Year-to-date Change: 29.8% | |
| AVIR Links: Profile News Message Board | |
| Charts:- Daily , Weekly | |
| Add AVIR to Watchlist: View: Get Complete AVIR Trend Analysis ➞ | |
 | CNTA Centessa Pharmaceuticals plc |
| Sector: Health Care | |
| SubSector: Biotechnology | |
| MarketCap: 616 Millions | |
| Recent Price: 9.53 Market Intelligence Score: 32 | |
| Day Percent Change: 0.95% Day Change: 0.09 | |
| Week Change: 6.66% Year-to-date Change: 18.0% | |
| CNTA Links: Profile News Message Board | |
| Charts:- Daily , Weekly | |
| Add CNTA to Watchlist: View: Get Complete CNTA Trend Analysis ➞ | |
 | KPTI Karyopharm Therapeutics Inc. |
| Sector: Health Care | |
| SubSector: Biotechnology | |
| MarketCap: 1471.85 Millions | |
| Recent Price: 1.13 Market Intelligence Score: 42 | |
| Day Percent Change: 4.63% Day Change: 0.05 | |
| Week Change: 6.6% Year-to-date Change: 30.6% | |
| KPTI Links: Profile News Message Board | |
| Charts:- Daily , Weekly | |
| Add KPTI to Watchlist: View: Get Complete KPTI Trend Analysis ➞ | |
 | RANI Rani Therapeutics Holdings, Inc. |
| Sector: Health Care | |
| SubSector: Biotechnology | |
| MarketCap: 202 Millions | |
| Recent Price: 7.12 Market Intelligence Score: 93 | |
| Day Percent Change: 12.13% Day Change: 0.77 | |
| Week Change: 6.59% Year-to-date Change: 115.8% | |
| RANI Links: Profile News Message Board | |
| Charts:- Daily , Weekly | |
| Add RANI to Watchlist: View: Get Complete RANI Trend Analysis ➞ | |
 | EDIT Editas Medicine, Inc. |
| Sector: Health Care | |
| SubSector: Biotechnology | |
| MarketCap: 1194.95 Millions | |
| Recent Price: 5.67 Market Intelligence Score: 49 | |
| Day Percent Change: 0.89% Day Change: 0.05 | |
| Week Change: 6.58% Year-to-date Change: -44.0% | |
| EDIT Links: Profile News Message Board | |
| Charts:- Daily , Weekly | |
| Add EDIT to Watchlist: View: Get Complete EDIT Trend Analysis ➞ | |
 | HRTX Heron Therapeutics, Inc. |
| Sector: Health Care | |
| SubSector: Biotechnology | |
| MarketCap: 1172.75 Millions | |
| Recent Price: 2.61 Market Intelligence Score: 32 | |
| Day Percent Change: 2.35% Day Change: 0.06 | |
| Week Change: 6.53% Year-to-date Change: 53.5% | |
| HRTX Links: Profile News Message Board | |
| Charts:- Daily , Weekly | |
| Add HRTX to Watchlist: View: Get Complete HRTX Trend Analysis ➞ | |
 | KZR Kezar Life Sciences, Inc. |
| Sector: Health Care | |
| SubSector: Biotechnology | |
| MarketCap: 174.885 Millions | |
| Recent Price: 0.86 Market Intelligence Score: 32 | |
| Day Percent Change: 0.32% Day Change: 0.00 | |
| Week Change: 6.52% Year-to-date Change: -9.5% | |
| KZR Links: Profile News Message Board | |
| Charts:- Daily , Weekly | |
| Add KZR to Watchlist: View: Get Complete KZR Trend Analysis ➞ | |
 | MORF Morphic Holding, Inc. |
| Sector: Health Care | |
| SubSector: Biotechnology | |
| MarketCap: 484.885 Millions | |
| Recent Price: 29.90 Market Intelligence Score: 74 | |
| Day Percent Change: 4.14% Day Change: 1.19 | |
| Week Change: 6.52% Year-to-date Change: 3.5% | |
| MORF Links: Profile News Message Board | |
| Charts:- Daily , Weekly | |
| Add MORF to Watchlist: View: Get Complete MORF Trend Analysis ➞ | |
 | GLSI Greenwich LifeSciences, Inc. |
| Sector: Health Care | |
| SubSector: Biotechnology | |
| MarketCap: 86487 Millions | |
| Recent Price: 13.98 Market Intelligence Score: 70 | |
| Day Percent Change: -0.11% Day Change: -0.02 | |
| Week Change: 6.52% Year-to-date Change: 31.8% | |
| GLSI Links: Profile News Message Board | |
| Charts:- Daily , Weekly | |
| Add GLSI to Watchlist: View: Get Complete GLSI Trend Analysis ➞ | |
 | VERV Verve Therapeutics, Inc. |
| Sector: Health Care | |
| SubSector: Biotechnology | |
| MarketCap: 1200 Millions | |
| Recent Price: 6.53 Market Intelligence Score: 42 | |
| Day Percent Change: 8.11% Day Change: 0.49 | |
| Week Change: 6.35% Year-to-date Change: -53.2% | |
| VERV Links: Profile News Message Board | |
| Charts:- Daily , Weekly | |
| Add VERV to Watchlist: View: Get Complete VERV Trend Analysis ➞ | |
 | BNTX BioNTech SE |
| Sector: Health Care | |
| SubSector: Biotechnology | |
| MarketCap: 11933.7 Millions | |
| Recent Price: 92.72 Market Intelligence Score: 100 | |
| Day Percent Change: 0.52% Day Change: 0.48 | |
| Week Change: 6.32% Year-to-date Change: -12.2% | |
| BNTX Links: Profile News Message Board | |
| Charts:- Daily , Weekly | |
| Add BNTX to Watchlist: View: Get Complete BNTX Trend Analysis ➞ | |
 | NVCT Nuvectis Pharma, Inc. |
| Sector: Health Care | |
| SubSector: Biotechnology | |
| MarketCap: 258 Millions | |
| Recent Price: 6.91 Market Intelligence Score: 42 | |
| Day Percent Change: 4.38% Day Change: 0.29 | |
| Week Change: 6.31% Year-to-date Change: -16.4% | |
| NVCT Links: Profile News Message Board | |
| Charts:- Daily , Weekly | |
| Add NVCT to Watchlist: View: Get Complete NVCT Trend Analysis ➞ | |
| To view more stocks, click on Next / Previous arrows or select different range: 0 - 25 , 25 - 50 , 50 - 75 , 75 - 100 , 100 - 125 , 125 - 150 , 150 - 175 , 175 - 200 , 200 - 225 , 225 - 250 , 250 - 275 , 275 - 300 , 300 - 325 , 325 - 350 , 350 - 375 , 375 - 400 | ||
| Click To Change The Sort Order: By Market Cap or Company Size Performance: Year-to-date, Week and Day | |
| Select Chart Type: | ||
|
Best Stocks Today 12Stocks.com |
© 2024 12Stocks.com Terms & Conditions Privacy Contact Us
All Information Provided Only For Education And Not To Be Used For Investing or Trading. See Terms & Conditions


One More Thing ... Get Best Stocks Delivered Daily!
Never Ever Miss A Move With Our Top Ten Stocks Lists
Find Best Stocks In Any Market - Bull or Bear Market
Take A Peek At Our Top Ten Stocks Lists: Daily, Weekly, Year-to-Date & Top Trends
Find Best Stocks In Any Market - Bull or Bear Market
Take A Peek At Our Top Ten Stocks Lists: Daily, Weekly, Year-to-Date & Top Trends
Biotech Stocks With Best Up Trends [0-bearish to 100-bullish]: Emergent Bio[100], Amgen [100], Quantum-Si [100], Janux [100], SIGA Technologies[100], Verrica [100], Genmab A/S[100], Black Diamond[100], PMV [100], Wave Life[100], Voyager [100]
Best Biotech Stocks Year-to-Date:
Pieris [5987.91%], Avenue [2868.94%], Precision [2782.19%], Inovio [2272.55%], Assembly [1503.46%], Agenus [1478.69%], Adverum nologies[1285.49%], NuCana [1252.27%], Affimed N.V[767.2%], Mesoblast [581.82%], Corbus [541.89%] Best Biotech Stocks This Week:
CytomX [178.62%], Emergent Bio[102.6%], Deciphera [73.24%], Cue Biopharma[56.04%], Codexis [47.37%], Abeona [41.1%], Seres [40.61%], Ardelyx [35.83%], Poseida [35.21%], CureVac N.V[33.91%], Janux [31.95%] Best Biotech Stocks Daily:
Ardelyx [28.42%], Emergent Bio[17.88%], Codexis [17.37%], Vaxxinity [17.27%], Cue Biopharma[13.30%], Vir nology[13.18%], Lantern Pharma[13.11%], Abeona [13.02%], CureVac N.V[12.64%], Ginkgo Bioworks[12.33%], Rani [12.13%]