
 Login Sign Up


| |||||
 |  | ||||

| 12Stocks.com Market Intelligence |
Best Biotech Stocks
|
|
| Quick Read: Best Biotech Stocks List By Performances & Trends: Daily, Weekly, Year-to-Date, Market Cap (Size) & Technical Trends | |||
| Best Biotech Stocks Views: Quick Browse View, Summary & Slide Show View | |||
| 12Stocks.com Biotech Stocks Performances & Trends Daily | |||||||||
|
|  The overall market intelligence score is 49 (0-bearish to 100-bullish) which puts Biotech sector in short term neutral trend. The market intelligence score from previous trading session is 32 and hence an improvement of trend.
| ||||||||
Here are the market intelligence trend scores of the most requested Biotech stocks at 12Stocks.com (click stock name for detailed review):
|


| 12Stocks.com: Investing in Biotech sector with Stocks | |
|
The following table helps investors and traders sort through current performance and trends (as measured by market intelligence score) of various
stocks in the Biotech sector. Quick View: Move mouse or cursor over stock symbol (ticker) to view short-term Technical chart and over stock name to view long term chart. Click on  to add stock symbol to your watchlist and to add stock symbol to your watchlist and  to view watchlist. Click on any ticker or stock name for detailed market intelligence report for that stock. to view watchlist. Click on any ticker or stock name for detailed market intelligence report for that stock. |
12Stocks.com Performance of Stocks in Biotech Sector
| Ticker | Stock Name | Watchlist | Category | Recent Price | Market Intelligence Score | Change % | Weekly Change% |
| KNSA | Kiniksa |   | Biotechnology | 19.40 | 64 | 3.63% | 8.50% |
| QSI | Quantum-Si | | Biotechnology | 1.79 | 95 | 11.18% | 8.48% |
| NTLA | Intellia | | Biotechnology | 22.50 | 59 | 5.14% | 8.38% |
| CMPX | Compass | | Biotechnology | 1.57 | 49 | 9.03% | 8.28% |
| RYTM | Rhythm | | Biotechnology | 41.43 | 64 | 4.20% | 8.23% |
| KALA | Kala | | Biotechnology | 6.81 | 42 | -0.15% | 8.10% |
| RVMD | Revolution Medicines | | Biotechnology | 38.82 | 100 | 4.13% | 7.95% |
| OMER | Omeros | | Biotechnology | 3.40 | 54 | 7.94% | 7.94% |
| SYRS | Syros | | Biotechnology | 5.44 | 64 | 0.74% | 7.94% |
| NBTX | Nanobiotix S.A | | Biotechnology | 6.19 | 64 | 3.34% | 7.84% |
| EYPT | EyePoint | | Biotechnology | 18.04 | 49 | 2.50% | 7.70% |
| GERN | Geron | | Biotechnology | 4.08 | 95 | 3.82% | 7.65% |
| FATE | Fate | | Biotechnology | 4.09 | 37 | 3.54% | 7.63% |
| KOD | Kodiak | | Biotechnology | 3.53 | 44 | 9.97% | 7.62% |
| LYEL | Lyell Immunopharma | | Biotechnology | 2.33 | 37 | 7.37% | 7.62% |
| TSVT | 2seventy bio | | Biotechnology | 4.58 | 49 | 0.44% | 7.51% |
| GRTS | Gritstone Oncology | | Biotechnology | 0.87 | 64 | 9.21% | 7.41% |
| IOVA | Iovance Bio | | Biotechnology | 12.50 | 59 | 6.11% | 7.39% |
| ESPR | Esperion | | Biotechnology | 2.04 | 44 | 3.55% | 7.37% |
| BMEA | Biomea Fusion | | Biotechnology | 11.56 | 49 | 7.84% | 7.34% |
| ADPT | Adaptive nologies | | Biotechnology | 2.79 | 54 | 6.49% | 7.31% |
| AVXL | Anavex Life | | Biotechnology | 3.69 | 52 | 1.10% | 7.27% |
| OCS | Oculis Holding | | Biotechnology | 12.89 | 90 | -1.38% | 7.24% |
| PLRX | Pliant | | Biotechnology | 12.66 | 52 | 7.11% | 7.20% |
| IMNM | Immunome | | Biotechnology | 14.69 | 32 | 4.48% | 6.99% |
| To view more stocks, click on Next / Previous arrows or select different range: 0 - 25 , 25 - 50 , 50 - 75 , 75 - 100 , 100 - 125 , 125 - 150 , 150 - 175 , 175 - 200 , 200 - 225 , 225 - 250 , 250 - 275 , 275 - 300 , 300 - 325 , 325 - 350 , 350 - 375 , 375 - 400 | ||
 | Click To Change The Sort Order: By Market Cap or Company Size Performance: Year-to-date, Week and Day |  |
|
Get the most comprehensive stock market coverage daily at 12Stocks.com ➞ Best Stocks Today ➞ Best Stocks Weekly ➞ Best Stocks Year-to-Date ➞ Best Stocks Trends ➞  Best Stocks Today 12Stocks.com Best Nasdaq Stocks ➞ Best S&P 500 Stocks ➞ Best Tech Stocks ➞ Best Biotech Stocks ➞ |
| Detailed Overview of Biotech Stocks |
| Biotech Technical Overview, Leaders & Laggards, Top Biotech ETF Funds & Detailed Biotech Stocks List, Charts, Trends & More |
| Biotech Sector: Technical Analysis, Trends & YTD Performance | |
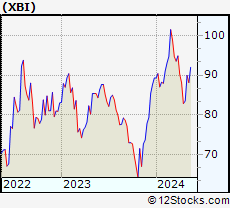
| Biotech sector, as represented by XBI, an exchange-traded fund [ETF] that holds basket of Biotech stocks (e.g, Amgen, Celgene) is down by -2.2% and is currently underperforming the overall market by -6.74% year-to-date. Below is a quick view of Technical charts and trends: | |
 XBI Weekly Chart |
|
| Long Term Trend: Not Good | |
| Medium Term Trend: Deteriorating | |
 XBI Daily Chart |
|
| Short Term Trend: Very Good | |
| Overall Trend Score: 49 | |
| YTD Performance: -2.2% | |
| **Trend Scores & Views Are Only For Educational Purposes And Not For Investing | |
| 12Stocks.com: Top Performing Biotech Sector Stocks | ||||||||||||||||||||||||||||||||||||||||||||||||
 The top performing Biotech sector stocks year to date are
Now, more recently, over last week, the top performing Biotech sector stocks on the move are


|
||||||||||||||||||||||||||||||||||||||||||||||||
| 12Stocks.com: Investing in Biotech Sector using Exchange Traded Funds | |
|
The following table shows list of key exchange traded funds (ETF) that
help investors track Biotech Index. For detailed view, check out our ETF Funds section of our website. Quick View: Move mouse or cursor over ETF symbol (ticker) to view short-term Technical chart and over ETF name to view long term chart. Click on ticker or stock name for detailed view. Click on to add stock symbol to your watchlist and to view watchlist. |
12Stocks.com List of ETFs that track Biotech Index
| Ticker | ETF Name | Watchlist | Recent Price | Market Intelligence Score | Change % | Week % | Year-to-date % |
| LABD | Biotech Bear 3X | | 9.03 | 49 | -10.24 | -14.16 | -6.81% |
| XBI | Biotech | | 87.33 | 49 | 3.20 | 4.6 | -2.2% |
| LABU | Biotech Bull 3X | | 99.81 | 49 | 9.84 | 14.06 | -18.17% |
| IBB | Biotechnology | | 129.49 | 57 | 2.02 | 2.37 | -4.68% |
| IYH | Healthcare | | 59.18 | 64 | 0.59 | 0.97 | 3.37% |
| IXJ | Global Healthcare | | 89.56 | 50 | 0.27 | 0.49 | 3.27% |
| IHF | Healthcare Providers | | 51.44 | 15 | -0.77 | -0.92 | -2.04% |
| FBT | First NYSE | | 146.02 | 49 | 1.46 | 1.65 | -7.61% |
| BIB | Biotechnology | | 52.58 | 64 | 4.43 | 5.88 | -7.84% |
| CURE | Healthcare Bull 3X | | 106.56 | 64 | 0.61 | 1.19 | 4.74% |
| PBE | Biotech & Genome | | 62.86 | 64 | 3.27 | 4.11 | -4.53% |
| PTH | DWA Healthcare Momentum | | 41.27 | 49 | 1.93 | 3.46 | 5.44% |
| BIS | Short Biotech | | 19.11 | 36 | -3.68 | -5.49 | 5.76% |
| BBH | Biotech | | 158.64 | 57 | 1.41 | 1.92 | -4.03% |
| BTEC | Principal Healthcare Innovators | | 35.90 | 62 | 3.60 | 4.81 | -1.19% |
| BBC | Bio Biotechnology Clinical | | 27.10 | 62 | 3.60 | 6.13 | 10.81% |
| BBP | Bio Biotechnology Products | | 54.35 | 64 | 2.00 | 5.56 | -6.45% |
| 12Stocks.com: Charts, Trends, Fundamental Data and Performances of Biotech Stocks | |
|
We now take in-depth look at all Biotech stocks including charts, multi-period performances and overall trends (as measured by market intelligence score). One can sort Biotech stocks (click link to choose) by Daily, Weekly and by Year-to-Date performances. Also, one can sort by size of the company or by market capitalization. |
| Select Your Default Chart Type: | |||||
| |||||
| Click on stock symbol or name for detailed view. Click on to add stock symbol to your watchlist and to view watchlist. Quick View: Move mouse or cursor over "Daily" to quickly view daily Technical stock chart and over "Weekly" to view weekly Technical stock chart. | |||||

 | KNSA Kiniksa Pharmaceuticals, Ltd. |
| Sector: Health Care | |
| SubSector: Biotechnology | |
| MarketCap: 780.285 Millions | |
| Recent Price: 19.40 Market Intelligence Score: 64 | |
| Day Percent Change: 3.63% Day Change: 0.68 | |
| Week Change: 8.5% Year-to-date Change: 10.6% | |
| KNSA Links: Profile News Message Board | |
| Charts:- Daily , Weekly | |
| Add KNSA to Watchlist: View: Get Complete KNSA Trend Analysis ➞ | |
 | QSI Quantum-Si incorporated |
| Sector: Health Care | |
| SubSector: Biotechnology | |
| MarketCap: 256 Millions | |
| Recent Price: 1.79 Market Intelligence Score: 95 | |
| Day Percent Change: 11.18% Day Change: 0.18 | |
| Week Change: 8.48% Year-to-date Change: -11.0% | |
| QSI Links: Profile News Message Board | |
| Charts:- Daily , Weekly | |
| Add QSI to Watchlist: View: Get Complete QSI Trend Analysis ➞ | |
 | NTLA Intellia Therapeutics, Inc. |
| Sector: Health Care | |
| SubSector: Biotechnology | |
| MarketCap: 707.185 Millions | |
| Recent Price: 22.50 Market Intelligence Score: 59 | |
| Day Percent Change: 5.14% Day Change: 1.10 | |
| Week Change: 8.38% Year-to-date Change: -26.2% | |
| NTLA Links: Profile News Message Board | |
| Charts:- Daily , Weekly | |
| Add NTLA to Watchlist: View: Get Complete NTLA Trend Analysis ➞ | |
 | CMPX Compass Therapeutics, Inc. |
| Sector: Health Care | |
| SubSector: Biotechnology | |
| MarketCap: 406 Millions | |
| Recent Price: 1.57 Market Intelligence Score: 49 | |
| Day Percent Change: 9.03% Day Change: 0.13 | |
| Week Change: 8.28% Year-to-date Change: 2.3% | |
| CMPX Links: Profile News Message Board | |
| Charts:- Daily , Weekly | |
| Add CMPX to Watchlist: View: Get Complete CMPX Trend Analysis ➞ | |
 | RYTM Rhythm Pharmaceuticals, Inc. |
| Sector: Health Care | |
| SubSector: Biotechnology | |
| MarketCap: 643.685 Millions | |
| Recent Price: 41.43 Market Intelligence Score: 64 | |
| Day Percent Change: 4.20% Day Change: 1.67 | |
| Week Change: 8.23% Year-to-date Change: -9.9% | |
| RYTM Links: Profile News Message Board | |
| Charts:- Daily , Weekly | |
| Add RYTM to Watchlist: View: Get Complete RYTM Trend Analysis ➞ | |
 | KALA Kala Pharmaceuticals, Inc. |
| Sector: Health Care | |
| SubSector: Biotechnology | |
| MarketCap: 276.485 Millions | |
| Recent Price: 6.81 Market Intelligence Score: 42 | |
| Day Percent Change: -0.15% Day Change: -0.01 | |
| Week Change: 8.1% Year-to-date Change: -2.7% | |
| KALA Links: Profile News Message Board | |
| Charts:- Daily , Weekly | |
| Add KALA to Watchlist: View: Get Complete KALA Trend Analysis ➞ | |
 | RVMD Revolution Medicines, Inc. |
| Sector: Health Care | |
| SubSector: Biotechnology | |
| MarketCap: 28087 Millions | |
| Recent Price: 38.82 Market Intelligence Score: 100 | |
| Day Percent Change: 4.13% Day Change: 1.54 | |
| Week Change: 7.95% Year-to-date Change: 35.4% | |
| RVMD Links: Profile News Message Board | |
| Charts:- Daily , Weekly | |
| Add RVMD to Watchlist: View: Get Complete RVMD Trend Analysis ➞ | |
 | OMER Omeros Corporation |
| Sector: Health Care | |
| SubSector: Biotechnology | |
| MarketCap: 759.585 Millions | |
| Recent Price: 3.40 Market Intelligence Score: 54 | |
| Day Percent Change: 7.94% Day Change: 0.25 | |
| Week Change: 7.94% Year-to-date Change: 4.0% | |
| OMER Links: Profile News Message Board | |
| Charts:- Daily , Weekly | |
| Add OMER to Watchlist: View: Get Complete OMER Trend Analysis ➞ | |
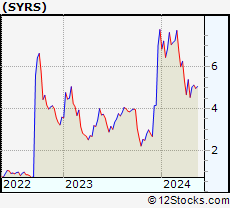 | SYRS Syros Pharmaceuticals, Inc. |
| Sector: Health Care | |
| SubSector: Biotechnology | |
| MarketCap: 275.485 Millions | |
| Recent Price: 5.44 Market Intelligence Score: 64 | |
| Day Percent Change: 0.74% Day Change: 0.04 | |
| Week Change: 7.94% Year-to-date Change: -30.2% | |
| SYRS Links: Profile News Message Board | |
| Charts:- Daily , Weekly | |
| Add SYRS to Watchlist: View: Get Complete SYRS Trend Analysis ➞ | |
 | NBTX Nanobiotix S.A. |
| Sector: Health Care | |
| SubSector: Biotechnology | |
| MarketCap: 177 Millions | |
| Recent Price: 6.19 Market Intelligence Score: 64 | |
| Day Percent Change: 3.34% Day Change: 0.20 | |
| Week Change: 7.84% Year-to-date Change: -16.6% | |
| NBTX Links: Profile News Message Board | |
| Charts:- Daily , Weekly | |
| Add NBTX to Watchlist: View: Get Complete NBTX Trend Analysis ➞ | |
 | EYPT EyePoint Pharmaceuticals, Inc. |
| Sector: Health Care | |
| SubSector: Biotechnology | |
| MarketCap: 125.085 Millions | |
| Recent Price: 18.04 Market Intelligence Score: 49 | |
| Day Percent Change: 2.50% Day Change: 0.44 | |
| Week Change: 7.7% Year-to-date Change: -21.9% | |
| EYPT Links: Profile News Message Board | |
| Charts:- Daily , Weekly | |
| Add EYPT to Watchlist: View: Get Complete EYPT Trend Analysis ➞ | |
 | GERN Geron Corporation |
| Sector: Health Care | |
| SubSector: Biotechnology | |
| MarketCap: 228.685 Millions | |
| Recent Price: 4.08 Market Intelligence Score: 95 | |
| Day Percent Change: 3.82% Day Change: 0.15 | |
| Week Change: 7.65% Year-to-date Change: 93.4% | |
| GERN Links: Profile News Message Board | |
| Charts:- Daily , Weekly | |
| Add GERN to Watchlist: View: Get Complete GERN Trend Analysis ➞ | |
 | FATE Fate Therapeutics, Inc. |
| Sector: Health Care | |
| SubSector: Biotechnology | |
| MarketCap: 2022.45 Millions | |
| Recent Price: 4.09 Market Intelligence Score: 37 | |
| Day Percent Change: 3.54% Day Change: 0.14 | |
| Week Change: 7.63% Year-to-date Change: 9.4% | |
| FATE Links: Profile News Message Board | |
| Charts:- Daily , Weekly | |
| Add FATE to Watchlist: View: Get Complete FATE Trend Analysis ➞ | |
 | KOD Kodiak Sciences Inc. |
| Sector: Health Care | |
| SubSector: Biotechnology | |
| MarketCap: 2132.15 Millions | |
| Recent Price: 3.53 Market Intelligence Score: 44 | |
| Day Percent Change: 9.97% Day Change: 0.32 | |
| Week Change: 7.62% Year-to-date Change: 16.1% | |
| KOD Links: Profile News Message Board | |
| Charts:- Daily , Weekly | |
| Add KOD to Watchlist: View: Get Complete KOD Trend Analysis ➞ | |
 | LYEL Lyell Immunopharma, Inc. |
| Sector: Health Care | |
| SubSector: Biotechnology | |
| MarketCap: 809 Millions | |
| Recent Price: 2.33 Market Intelligence Score: 37 | |
| Day Percent Change: 7.37% Day Change: 0.16 | |
| Week Change: 7.62% Year-to-date Change: 18.6% | |
| LYEL Links: Profile News Message Board | |
| Charts:- Daily , Weekly | |
| Add LYEL to Watchlist: View: Get Complete LYEL Trend Analysis ➞ | |
 | TSVT 2seventy bio, Inc. |
| Sector: Health Care | |
| SubSector: Biotechnology | |
| MarketCap: 504 Millions | |
| Recent Price: 4.58 Market Intelligence Score: 49 | |
| Day Percent Change: 0.44% Day Change: 0.02 | |
| Week Change: 7.51% Year-to-date Change: 5.9% | |
| TSVT Links: Profile News Message Board | |
| Charts:- Daily , Weekly | |
| Add TSVT to Watchlist: View: Get Complete TSVT Trend Analysis ➞ | |
 | GRTS Gritstone Oncology, Inc. |
| Sector: Health Care | |
| SubSector: Biotechnology | |
| MarketCap: 240.085 Millions | |
| Recent Price: 0.87 Market Intelligence Score: 64 | |
| Day Percent Change: 9.21% Day Change: 0.07 | |
| Week Change: 7.41% Year-to-date Change: -57.2% | |
| GRTS Links: Profile News Message Board | |
| Charts:- Daily , Weekly | |
| Add GRTS to Watchlist: View: Get Complete GRTS Trend Analysis ➞ | |
 | IOVA Iovance Biotherapeutics, Inc. |
| Sector: Health Care | |
| SubSector: Biotechnology | |
| MarketCap: 3533.35 Millions | |
| Recent Price: 12.50 Market Intelligence Score: 59 | |
| Day Percent Change: 6.11% Day Change: 0.72 | |
| Week Change: 7.39% Year-to-date Change: 53.8% | |
| IOVA Links: Profile News Message Board | |
| Charts:- Daily , Weekly | |
| Add IOVA to Watchlist: View: Get Complete IOVA Trend Analysis ➞ | |
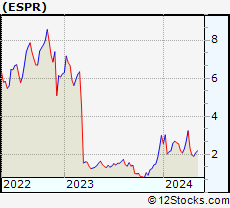 | ESPR Esperion Therapeutics, Inc. |
| Sector: Health Care | |
| SubSector: Biotechnology | |
| MarketCap: 1153.55 Millions | |
| Recent Price: 2.04 Market Intelligence Score: 44 | |
| Day Percent Change: 3.55% Day Change: 0.07 | |
| Week Change: 7.37% Year-to-date Change: -31.8% | |
| ESPR Links: Profile News Message Board | |
| Charts:- Daily , Weekly | |
| Add ESPR to Watchlist: View: Get Complete ESPR Trend Analysis ➞ | |
 | BMEA Biomea Fusion, Inc. |
| Sector: Health Care | |
| SubSector: Biotechnology | |
| MarketCap: 818 Millions | |
| Recent Price: 11.56 Market Intelligence Score: 49 | |
| Day Percent Change: 7.84% Day Change: 0.84 | |
| Week Change: 7.34% Year-to-date Change: -21.0% | |
| BMEA Links: Profile News Message Board | |
| Charts:- Daily , Weekly | |
| Add BMEA to Watchlist: View: Get Complete BMEA Trend Analysis ➞ | |
 | ADPT Adaptive Biotechnologies Corporation |
| Sector: Health Care | |
| SubSector: Biotechnology | |
| MarketCap: 3525.75 Millions | |
| Recent Price: 2.79 Market Intelligence Score: 54 | |
| Day Percent Change: 6.49% Day Change: 0.17 | |
| Week Change: 7.31% Year-to-date Change: -43.1% | |
| ADPT Links: Profile News Message Board | |
| Charts:- Daily , Weekly | |
| Add ADPT to Watchlist: View: Get Complete ADPT Trend Analysis ➞ | |
 | AVXL Anavex Life Sciences Corp. |
| Sector: Health Care | |
| SubSector: Biotechnology | |
| MarketCap: 175.985 Millions | |
| Recent Price: 3.69 Market Intelligence Score: 52 | |
| Day Percent Change: 1.10% Day Change: 0.04 | |
| Week Change: 7.27% Year-to-date Change: -60.4% | |
| AVXL Links: Profile News Message Board | |
| Charts:- Daily , Weekly | |
| Add AVXL to Watchlist: View: Get Complete AVXL Trend Analysis ➞ | |
 | OCS Oculis Holding AG |
| Sector: Health Care | |
| SubSector: Biotechnology | |
| MarketCap: 460 Millions | |
| Recent Price: 12.89 Market Intelligence Score: 90 | |
| Day Percent Change: -1.38% Day Change: -0.18 | |
| Week Change: 7.24% Year-to-date Change: 16.1% | |
| OCS Links: Profile News Message Board | |
| Charts:- Daily , Weekly | |
| Add OCS to Watchlist: View: Get Complete OCS Trend Analysis ➞ | |
 | PLRX Pliant Therapeutics, Inc. |
| Sector: Health Care | |
| SubSector: Biotechnology | |
| MarketCap: 96487 Millions | |
| Recent Price: 12.66 Market Intelligence Score: 52 | |
| Day Percent Change: 7.11% Day Change: 0.84 | |
| Week Change: 7.2% Year-to-date Change: -30.1% | |
| PLRX Links: Profile News Message Board | |
| Charts:- Daily , Weekly | |
| Add PLRX to Watchlist: View: Get Complete PLRX Trend Analysis ➞ | |
 | IMNM Immunome, Inc. |
| Sector: Health Care | |
| SubSector: Biotechnology | |
| MarketCap: 12487 Millions | |
| Recent Price: 14.69 Market Intelligence Score: 32 | |
| Day Percent Change: 4.48% Day Change: 0.63 | |
| Week Change: 6.99% Year-to-date Change: 37.4% | |
| IMNM Links: Profile News Message Board | |
| Charts:- Daily , Weekly | |
| Add IMNM to Watchlist: View: Get Complete IMNM Trend Analysis ➞ | |
| To view more stocks, click on Next / Previous arrows or select different range: 0 - 25 , 25 - 50 , 50 - 75 , 75 - 100 , 100 - 125 , 125 - 150 , 150 - 175 , 175 - 200 , 200 - 225 , 225 - 250 , 250 - 275 , 275 - 300 , 300 - 325 , 325 - 350 , 350 - 375 , 375 - 400 | ||
| Click To Change The Sort Order: By Market Cap or Company Size Performance: Year-to-date, Week and Day | |
| Select Chart Type: | ||
|
Best Stocks Today 12Stocks.com |
© 2024 12Stocks.com Terms & Conditions Privacy Contact Us
All Information Provided Only For Education And Not To Be Used For Investing or Trading. See Terms & Conditions


One More Thing ... Get Best Stocks Delivered Daily!
Never Ever Miss A Move With Our Top Ten Stocks Lists
Find Best Stocks In Any Market - Bull or Bear Market
Take A Peek At Our Top Ten Stocks Lists: Daily, Weekly, Year-to-Date & Top Trends
Find Best Stocks In Any Market - Bull or Bear Market
Take A Peek At Our Top Ten Stocks Lists: Daily, Weekly, Year-to-Date & Top Trends
Biotech Stocks With Best Up Trends [0-bearish to 100-bullish]: CytomX [100], Summit [100], Xencor [100], Humacyte [100], Mesoblast [100], United [100], Nuvation Bio[100], AnaptysBio [100], PTC [100], Revolution Medicines[100], Cullinan Oncology[100]
Best Biotech Stocks Year-to-Date:
Pieris [6317.58%], Avenue [2856.52%], Precision [2771.23%], Inovio [2172.55%], Assembly [1518.1%], Agenus [1501.64%], NuCana [1245.5%], Adverum nologies[1200.48%], Affimed N.V[756%], Mesoblast [555.45%], Corbus [516.72%] Best Biotech Stocks This Week:
CytomX [222.64%], Deciphera [73.11%], Cue Biopharma[39.56%], Seres [30.91%], Poseida [30.05%], Exscientia [27.14%], Nektar [25%], AnaptysBio [23.9%], Janux [22.62%], Personalis [22.53%], Summit [21.76%] Best Biotech Stocks Daily:
CytomX [214.72%], Ventyx [24.63%], Summit [19.59%], Cabaletta Bio[16.58%], TG [16.25%], Bio-Techne [16.22%], Brainstorm Cell[15.10%], Wave Life[15.01%], Poseida [14.46%], Xencor [14.28%], NextCure [13.22%]