
 Login Sign Up


| |||||
 |  | ||||

| 12Stocks.com Market Intelligence |
Best Biotech Stocks
|
|
| Quick Read: Best Biotech Stocks List By Performances & Trends: Daily, Weekly, Year-to-Date, Market Cap (Size) & Technical Trends | |||
| Best Biotech Stocks Views: Quick Browse View, Summary & Slide Show View | |||
| 12Stocks.com Biotech Stocks Performances & Trends Daily | |||||||||
|
|  The overall market intelligence score is 69 (0-bearish to 100-bullish) which puts Biotech sector in short term neutral to bullish trend. The market intelligence score from previous trading session is 50 and hence an improvement of trend.
| ||||||||
Here are the market intelligence trend scores of the most requested Biotech stocks at 12Stocks.com (click stock name for detailed review):
|


| 12Stocks.com: Investing in Biotech sector with Stocks | |
|
The following table helps investors and traders sort through current performance and trends (as measured by market intelligence score) of various
stocks in the Biotech sector. Quick View: Move mouse or cursor over stock symbol (ticker) to view short-term Technical chart and over stock name to view long term chart. Click on  to add stock symbol to your watchlist and to add stock symbol to your watchlist and  to view watchlist. Click on any ticker or stock name for detailed market intelligence report for that stock. to view watchlist. Click on any ticker or stock name for detailed market intelligence report for that stock. |
12Stocks.com Performance of Stocks in Biotech Sector
| Ticker | Stock Name | Watchlist | Category | Recent Price | Market Intelligence Score | Change % | Weekly Change% |
| IMCR | Immunocore |   | Biotechnology | 60.03 | 64 | 0.95% | 2.60% |
| GPCR | Structure | | Biotechnology | 39.91 | 64 | 2.78% | 2.58% |
| SLRN | Acelyrin | | Biotechnology | 4.34 | 42 | 2.36% | 2.48% |
| IVA | Inventiva S.A | | Biotechnology | 3.33 | 42 | 4.06% | 2.46% |
| ATHA | Athira Pharma | | Biotechnology | 1.97 | 18 | 0.26% | 2.34% |
| ZURA | Zura Bio | | Biotechnology | 4.51 | 95 | 3.92% | 2.27% |
| AKBA | Akebia | | Biotechnology | 1.37 | 32 | 5.38% | 2.24% |
| ZLAB | Zai Lab | | Biotechnology | 16.25 | 57 | -2.05% | 2.14% |
| ACAD | ACADIA | | Biotechnology | 17.05 | 52 | -0.18% | 2.03% |
| BLTE | Belite Bio | | Biotechnology | 40.52 | 47 | 0.11% | 1.95% |
| BMRN | BioMarin | | Biotechnology | 82.44 | 32 | -1.62% | 1.89% |
| SAGE | Sage | | Biotechnology | 13.94 | 37 | 6.37% | 1.83% |
| TNGX | Tango | | Biotechnology | 7.58 | 44 | 1.13% | 1.81% |
| SYRS | Syros | | Biotechnology | 5.13 | 17 | -1.35% | 1.79% |
| FBIO | Fortress | | Biotechnology | 1.75 | 10 | -2.78% | 1.74% |
| GLTO | Galecto | | Biotechnology | 0.72 | 49 | 0.00% | 1.73% |
| ACIU | AC Immune | | Biotechnology | 2.39 | 17 | -2.05% | 1.70% |
| STTK | Shattuck Labs | | Biotechnology | 10.77 | 85 | -2.97% | 1.70% |
| RPRX | Royalty Pharma | | Biotechnology | 28.41 | 17 | -1.22% | 1.46% |
| ARVN | Arvinas | | Biotechnology | 32.82 | 32 | 1.20% | 1.39% |
| FOLD | Amicus | | Biotechnology | 10.40 | 42 | -0.29% | 1.17% |
| GLPG | Galapagos NV | | Biotechnology | 29.09 | 35 | -1.22% | 1.15% |
| URGN | UroGen Pharma | | Biotechnology | 14.30 | 30 | 0.28% | 1.06% |
| KRON | Kronos Bio | | Biotechnology | 1.01 | 29 | -1.94% | 1.00% |
| PYPD | PolyPid | | Biotechnology | 4.80 | 47 | 0.00% | 0.99% |
| To view more stocks, click on Next / Previous arrows or select different range: 0 - 25 , 25 - 50 , 50 - 75 , 75 - 100 , 100 - 125 , 125 - 150 , 150 - 175 , 175 - 200 , 200 - 225 , 225 - 250 , 250 - 275 , 275 - 300 , 300 - 325 , 325 - 350 , 350 - 375 , 375 - 400 | ||
 | Click To Change The Sort Order: By Market Cap or Company Size Performance: Year-to-date, Week and Day |  |
|
Get the most comprehensive stock market coverage daily at 12Stocks.com ➞ Best Stocks Today ➞ Best Stocks Weekly ➞ Best Stocks Year-to-Date ➞ Best Stocks Trends ➞  Best Stocks Today 12Stocks.com Best Nasdaq Stocks ➞ Best S&P 500 Stocks ➞ Best Tech Stocks ➞ Best Biotech Stocks ➞ |
| Detailed Overview of Biotech Stocks |
| Biotech Technical Overview, Leaders & Laggards, Top Biotech ETF Funds & Detailed Biotech Stocks List, Charts, Trends & More |
| Biotech Sector: Technical Analysis, Trends & YTD Performance | |
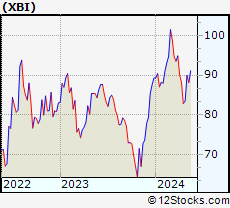
| Biotech sector, as represented by XBI, an exchange-traded fund [ETF] that holds basket of Biotech stocks (e.g, Amgen, Celgene) is up by 0.77% and is currently underperforming the overall market by -6.11% year-to-date. Below is a quick view of Technical charts and trends: | |
 XBI Weekly Chart |
|
| Long Term Trend: Not Good | |
| Medium Term Trend: Very Good | |
 XBI Daily Chart |
|
| Short Term Trend: Very Good | |
| Overall Trend Score: 69 | |
| YTD Performance: 0.77% | |
| **Trend Scores & Views Are Only For Educational Purposes And Not For Investing | |
| 12Stocks.com: Top Performing Biotech Sector Stocks | ||||||||||||||||||||||||||||||||||||||||||||||||
 The top performing Biotech sector stocks year to date are
Now, more recently, over last week, the top performing Biotech sector stocks on the move are


|
||||||||||||||||||||||||||||||||||||||||||||||||
| 12Stocks.com: Investing in Biotech Sector using Exchange Traded Funds | |
|
The following table shows list of key exchange traded funds (ETF) that
help investors track Biotech Index. For detailed view, check out our ETF Funds section of our website. Quick View: Move mouse or cursor over ETF symbol (ticker) to view short-term Technical chart and over ETF name to view long term chart. Click on ticker or stock name for detailed view. Click on to add stock symbol to your watchlist and to view watchlist. |
12Stocks.com List of ETFs that track Biotech Index
| Ticker | ETF Name | Watchlist | Recent Price | Market Intelligence Score | Change % | Week % | Year-to-date % |
| LABD | Biotech Bear 3X | | 8.28 | 36 | -5.48 | -21.29 | -14.55% |
| XBI | Biotech | | 89.98 | 69 | 1.86 | 7.77 | 0.77% |
| LABU | Biotech Bull 3X | | 108.99 | 64 | 5.83 | 24.55 | -10.64% |
| IBB | Biotechnology | | 132.96 | 69 | 1.77 | 5.12 | -2.13% |
| IYH | Healthcare | | 59.26 | 57 | 0.24 | 1.11 | 3.51% |
| IHF | Healthcare Providers | | 51.69 | 30 | 0.08 | -0.44 | -1.56% |
| BIB | Biotechnology | | 55.63 | 74 | 3.40 | 12.02 | -2.49% |
| IXJ | Global Healthcare | | 89.66 | 52 | 0.31 | 0.61 | 3.39% |
| CURE | Healthcare Bull 3X | | 106.89 | 57 | 1.02 | 1.51 | 5.06% |
| PBE | Biotech & Genome | | 64.11 | 74 | 0.85 | 6.18 | -2.63% |
| FBT | First NYSE | | 148.20 | 57 | 0.79 | 3.17 | -6.24% |
| PTH | DWA Healthcare Momentum | | 42.05 | 62 | 0.74 | 5.41 | 7.43% |
| BIS | Short Biotech | | 17.99 | 36 | -3.59 | -11.03 | -0.44% |
| BBC | Bio Biotechnology Clinical | | 27.89 | 69 | 2.05 | 9.24 | 14.06% |
| BBH | Biotech | | 164.15 | 100 | 2.27 | 5.46 | -0.7% |
| BTEC | Principal Healthcare Innovators | | 36.97 | 69 | 2.74 | 7.94 | 1.76% |
| BBP | Bio Biotechnology Products | | 55.49 | 64 | 2.10 | 7.78 | -4.48% |
| 12Stocks.com: Charts, Trends, Fundamental Data and Performances of Biotech Stocks | |
|
We now take in-depth look at all Biotech stocks including charts, multi-period performances and overall trends (as measured by market intelligence score). One can sort Biotech stocks (click link to choose) by Daily, Weekly and by Year-to-Date performances. Also, one can sort by size of the company or by market capitalization. |
| Select Your Default Chart Type: | |||||
| |||||
| Click on stock symbol or name for detailed view. Click on to add stock symbol to your watchlist and to view watchlist. Quick View: Move mouse or cursor over "Daily" to quickly view daily Technical stock chart and over "Weekly" to view weekly Technical stock chart. | |||||

 | IMCR Immunocore Holdings plc |
| Sector: Health Care | |
| SubSector: Biotechnology | |
| MarketCap: 2830 Millions | |
| Recent Price: 60.03 Market Intelligence Score: 64 | |
| Day Percent Change: 0.95% Day Change: 0.56 | |
| Week Change: 2.6% Year-to-date Change: -11.6% | |
| IMCR Links: Profile News Message Board | |
| Charts:- Daily , Weekly | |
| Add IMCR to Watchlist: View: Get Complete IMCR Trend Analysis ➞ | |
 | GPCR Structure Therapeutics Inc. |
| Sector: Health Care | |
| SubSector: Biotechnology | |
| MarketCap: 1530 Millions | |
| Recent Price: 39.91 Market Intelligence Score: 64 | |
| Day Percent Change: 2.78% Day Change: 1.08 | |
| Week Change: 2.58% Year-to-date Change: 4.8% | |
| GPCR Links: Profile News Message Board | |
| Charts:- Daily , Weekly | |
| Add GPCR to Watchlist: View: Get Complete GPCR Trend Analysis ➞ | |
 | SLRN Acelyrin, Inc. |
| Sector: Health Care | |
| SubSector: Biotechnology | |
| MarketCap: 2030 Millions | |
| Recent Price: 4.34 Market Intelligence Score: 42 | |
| Day Percent Change: 2.36% Day Change: 0.10 | |
| Week Change: 2.48% Year-to-date Change: -41.0% | |
| SLRN Links: Profile News Message Board | |
| Charts:- Daily , Weekly | |
| Add SLRN to Watchlist: View: Get Complete SLRN Trend Analysis ➞ | |
 | IVA Inventiva S.A. |
| Sector: Health Care | |
| SubSector: Biotechnology | |
| MarketCap: 46487 Millions | |
| Recent Price: 3.33 Market Intelligence Score: 42 | |
| Day Percent Change: 4.06% Day Change: 0.13 | |
| Week Change: 2.46% Year-to-date Change: -26.2% | |
| IVA Links: Profile News Message Board | |
| Charts:- Daily , Weekly | |
| Add IVA to Watchlist: View: Get Complete IVA Trend Analysis ➞ | |
 | ATHA Athira Pharma, Inc. |
| Sector: Health Care | |
| SubSector: Biotechnology | |
| MarketCap: 92487 Millions | |
| Recent Price: 1.97 Market Intelligence Score: 18 | |
| Day Percent Change: 0.26% Day Change: 0.01 | |
| Week Change: 2.34% Year-to-date Change: -19.5% | |
| ATHA Links: Profile News Message Board | |
| Charts:- Daily , Weekly | |
| Add ATHA to Watchlist: View: Get Complete ATHA Trend Analysis ➞ | |
 | ZURA Zura Bio Limited |
| Sector: Health Care | |
| SubSector: Biotechnology | |
| MarketCap: 242 Millions | |
| Recent Price: 4.51 Market Intelligence Score: 95 | |
| Day Percent Change: 3.92% Day Change: 0.17 | |
| Week Change: 2.27% Year-to-date Change: -3.7% | |
| ZURA Links: Profile News Message Board | |
| Charts:- Daily , Weekly | |
| Add ZURA to Watchlist: View: Get Complete ZURA Trend Analysis ➞ | |
 | AKBA Akebia Therapeutics, Inc. |
| Sector: Health Care | |
| SubSector: Biotechnology | |
| MarketCap: 794.285 Millions | |
| Recent Price: 1.37 Market Intelligence Score: 32 | |
| Day Percent Change: 5.38% Day Change: 0.07 | |
| Week Change: 2.24% Year-to-date Change: 10.5% | |
| AKBA Links: Profile News Message Board | |
| Charts:- Daily , Weekly | |
| Add AKBA to Watchlist: View: Get Complete AKBA Trend Analysis ➞ | |
 | ZLAB Zai Lab Limited |
| Sector: Health Care | |
| SubSector: Biotechnology | |
| MarketCap: 3970.35 Millions | |
| Recent Price: 16.25 Market Intelligence Score: 57 | |
| Day Percent Change: -2.05% Day Change: -0.34 | |
| Week Change: 2.14% Year-to-date Change: -40.5% | |
| ZLAB Links: Profile News Message Board | |
| Charts:- Daily , Weekly | |
| Add ZLAB to Watchlist: View: Get Complete ZLAB Trend Analysis ➞ | |
 | ACAD ACADIA Pharmaceuticals Inc. |
| Sector: Health Care | |
| SubSector: Biotechnology | |
| MarketCap: 5400.35 Millions | |
| Recent Price: 17.05 Market Intelligence Score: 52 | |
| Day Percent Change: -0.18% Day Change: -0.03 | |
| Week Change: 2.03% Year-to-date Change: -45.5% | |
| ACAD Links: Profile News Message Board | |
| Charts:- Daily , Weekly | |
| Add ACAD to Watchlist: View: Get Complete ACAD Trend Analysis ➞ | |
 | BLTE Belite Bio, Inc |
| Sector: Health Care | |
| SubSector: Biotechnology | |
| MarketCap: 404 Millions | |
| Recent Price: 40.52 Market Intelligence Score: 47 | |
| Day Percent Change: 0.11% Day Change: 0.05 | |
| Week Change: 1.95% Year-to-date Change: -11.0% | |
| BLTE Links: Profile News Message Board | |
| Charts:- Daily , Weekly | |
| Add BLTE to Watchlist: View: Get Complete BLTE Trend Analysis ➞ | |
 | BMRN BioMarin Pharmaceutical Inc. |
| Sector: Health Care | |
| SubSector: Biotechnology | |
| MarketCap: 14887.5 Millions | |
| Recent Price: 82.44 Market Intelligence Score: 32 | |
| Day Percent Change: -1.62% Day Change: -1.36 | |
| Week Change: 1.89% Year-to-date Change: -14.5% | |
| BMRN Links: Profile News Message Board | |
| Charts:- Daily , Weekly | |
| Add BMRN to Watchlist: View: Get Complete BMRN Trend Analysis ➞ | |
 | SAGE Sage Therapeutics, Inc. |
| Sector: Health Care | |
| SubSector: Biotechnology | |
| MarketCap: 1683.75 Millions | |
| Recent Price: 13.94 Market Intelligence Score: 37 | |
| Day Percent Change: 6.37% Day Change: 0.83 | |
| Week Change: 1.83% Year-to-date Change: -35.7% | |
| SAGE Links: Profile News Message Board | |
| Charts:- Daily , Weekly | |
| Add SAGE to Watchlist: View: Get Complete SAGE Trend Analysis ➞ | |
 | TNGX Tango Therapeutics, Inc. |
| Sector: Health Care | |
| SubSector: Biotechnology | |
| MarketCap: 302 Millions | |
| Recent Price: 7.58 Market Intelligence Score: 44 | |
| Day Percent Change: 1.13% Day Change: 0.08 | |
| Week Change: 1.81% Year-to-date Change: -23.5% | |
| TNGX Links: Profile News Message Board | |
| Charts:- Daily , Weekly | |
| Add TNGX to Watchlist: View: Get Complete TNGX Trend Analysis ➞ | |
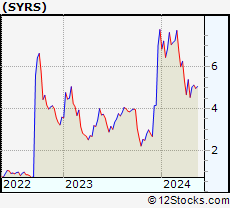 | SYRS Syros Pharmaceuticals, Inc. |
| Sector: Health Care | |
| SubSector: Biotechnology | |
| MarketCap: 275.485 Millions | |
| Recent Price: 5.13 Market Intelligence Score: 17 | |
| Day Percent Change: -1.35% Day Change: -0.07 | |
| Week Change: 1.79% Year-to-date Change: -34.2% | |
| SYRS Links: Profile News Message Board | |
| Charts:- Daily , Weekly | |
| Add SYRS to Watchlist: View: Get Complete SYRS Trend Analysis ➞ | |
 | FBIO Fortress Biotech, Inc. |
| Sector: Health Care | |
| SubSector: Biotechnology | |
| MarketCap: 116.885 Millions | |
| Recent Price: 1.75 Market Intelligence Score: 10 | |
| Day Percent Change: -2.78% Day Change: -0.05 | |
| Week Change: 1.74% Year-to-date Change: -41.9% | |
| FBIO Links: Profile News Message Board | |
| Charts:- Daily , Weekly | |
| Add FBIO to Watchlist: View: Get Complete FBIO Trend Analysis ➞ | |
 | GLTO Galecto, Inc. |
| Sector: Health Care | |
| SubSector: Biotechnology | |
| MarketCap: 34487 Millions | |
| Recent Price: 0.72 Market Intelligence Score: 49 | |
| Day Percent Change: 0.00% Day Change: 0.00 | |
| Week Change: 1.73% Year-to-date Change: -0.4% | |
| GLTO Links: Profile News Message Board | |
| Charts:- Daily , Weekly | |
| Add GLTO to Watchlist: View: Get Complete GLTO Trend Analysis ➞ | |
 | ACIU AC Immune SA |
| Sector: Health Care | |
| SubSector: Biotechnology | |
| MarketCap: 356.585 Millions | |
| Recent Price: 2.39 Market Intelligence Score: 17 | |
| Day Percent Change: -2.05% Day Change: -0.05 | |
| Week Change: 1.7% Year-to-date Change: -52.2% | |
| ACIU Links: Profile News Message Board | |
| Charts:- Daily , Weekly | |
| Add ACIU to Watchlist: View: Get Complete ACIU Trend Analysis ➞ | |
 | STTK Shattuck Labs, Inc. |
| Sector: Health Care | |
| SubSector: Biotechnology | |
| MarketCap: 16987 Millions | |
| Recent Price: 10.77 Market Intelligence Score: 85 | |
| Day Percent Change: -2.97% Day Change: -0.33 | |
| Week Change: 1.7% Year-to-date Change: 51.7% | |
| STTK Links: Profile News Message Board | |
| Charts:- Daily , Weekly | |
| Add STTK to Watchlist: View: Get Complete STTK Trend Analysis ➞ | |
 | RPRX Royalty Pharma plc |
| Sector: Health Care | |
| SubSector: Biotechnology | |
| MarketCap: 28457 Millions | |
| Recent Price: 28.41 Market Intelligence Score: 17 | |
| Day Percent Change: -1.22% Day Change: -0.35 | |
| Week Change: 1.46% Year-to-date Change: 1.1% | |
| RPRX Links: Profile News Message Board | |
| Charts:- Daily , Weekly | |
| Add RPRX to Watchlist: View: Get Complete RPRX Trend Analysis ➞ | |
 | ARVN Arvinas, Inc. |
| Sector: Health Care | |
| SubSector: Biotechnology | |
| MarketCap: 3469.85 Millions | |
| Recent Price: 32.82 Market Intelligence Score: 32 | |
| Day Percent Change: 1.20% Day Change: 0.39 | |
| Week Change: 1.39% Year-to-date Change: -20.3% | |
| ARVN Links: Profile News Message Board | |
| Charts:- Daily , Weekly | |
| Add ARVN to Watchlist: View: Get Complete ARVN Trend Analysis ➞ | |
 | FOLD Amicus Therapeutics, Inc. |
| Sector: Health Care | |
| SubSector: Biotechnology | |
| MarketCap: 2676.75 Millions | |
| Recent Price: 10.40 Market Intelligence Score: 42 | |
| Day Percent Change: -0.29% Day Change: -0.03 | |
| Week Change: 1.17% Year-to-date Change: -26.7% | |
| FOLD Links: Profile News Message Board | |
| Charts:- Daily , Weekly | |
| Add FOLD to Watchlist: View: Get Complete FOLD Trend Analysis ➞ | |
 | GLPG Galapagos NV |
| Sector: Health Care | |
| SubSector: Biotechnology | |
| MarketCap: 9541.55 Millions | |
| Recent Price: 29.09 Market Intelligence Score: 35 | |
| Day Percent Change: -1.22% Day Change: -0.36 | |
| Week Change: 1.15% Year-to-date Change: -28.4% | |
| GLPG Links: Profile News Message Board | |
| Charts:- Daily , Weekly | |
| Add GLPG to Watchlist: View: Get Complete GLPG Trend Analysis ➞ | |
 | URGN UroGen Pharma Ltd. |
| Sector: Health Care | |
| SubSector: Biotechnology | |
| MarketCap: 373.485 Millions | |
| Recent Price: 14.30 Market Intelligence Score: 30 | |
| Day Percent Change: 0.28% Day Change: 0.04 | |
| Week Change: 1.06% Year-to-date Change: -4.7% | |
| URGN Links: Profile News Message Board | |
| Charts:- Daily , Weekly | |
| Add URGN to Watchlist: View: Get Complete URGN Trend Analysis ➞ | |
 | KRON Kronos Bio, Inc. |
| Sector: Health Care | |
| SubSector: Biotechnology | |
| MarketCap: 17287 Millions | |
| Recent Price: 1.01 Market Intelligence Score: 29 | |
| Day Percent Change: -1.94% Day Change: -0.02 | |
| Week Change: 1% Year-to-date Change: -19.2% | |
| KRON Links: Profile News Message Board | |
| Charts:- Daily , Weekly | |
| Add KRON to Watchlist: View: Get Complete KRON Trend Analysis ➞ | |
 | PYPD PolyPid Ltd. |
| Sector: Health Care | |
| SubSector: Biotechnology | |
| MarketCap: 20487 Millions | |
| Recent Price: 4.80 Market Intelligence Score: 47 | |
| Day Percent Change: 0.00% Day Change: 0.00 | |
| Week Change: 0.99% Year-to-date Change: 30.8% | |
| PYPD Links: Profile News Message Board | |
| Charts:- Daily , Weekly | |
| Add PYPD to Watchlist: View: Get Complete PYPD Trend Analysis ➞ | |
| To view more stocks, click on Next / Previous arrows or select different range: 0 - 25 , 25 - 50 , 50 - 75 , 75 - 100 , 100 - 125 , 125 - 150 , 150 - 175 , 175 - 200 , 200 - 225 , 225 - 250 , 250 - 275 , 275 - 300 , 300 - 325 , 325 - 350 , 350 - 375 , 375 - 400 | ||
| Click To Change The Sort Order: By Market Cap or Company Size Performance: Year-to-date, Week and Day | |
| Select Chart Type: | ||
|
Best Stocks Today 12Stocks.com |
© 2024 12Stocks.com Terms & Conditions Privacy Contact Us
All Information Provided Only For Education And Not To Be Used For Investing or Trading. See Terms & Conditions


One More Thing ... Get Best Stocks Delivered Daily!
Never Ever Miss A Move With Our Top Ten Stocks Lists
Find Best Stocks In Any Market - Bull or Bear Market
Take A Peek At Our Top Ten Stocks Lists: Daily, Weekly, Year-to-Date & Top Trends
Find Best Stocks In Any Market - Bull or Bear Market
Take A Peek At Our Top Ten Stocks Lists: Daily, Weekly, Year-to-Date & Top Trends
Biotech Stocks With Best Up Trends [0-bearish to 100-bullish]: Emergent Bio[100], Amgen [100], Quantum-Si [100], Janux [100], SIGA Technologies[100], Verrica [100], Genmab A/S[100], Black Diamond[100], PMV [100], Wave Life[100], Voyager [100]
Best Biotech Stocks Year-to-Date:
Pieris [5987.91%], Avenue [2868.94%], Precision [2782.19%], Inovio [2272.55%], Assembly [1503.46%], Agenus [1478.69%], Adverum nologies[1285.49%], NuCana [1252.27%], Affimed N.V[767.2%], Mesoblast [581.82%], Corbus [541.89%] Best Biotech Stocks This Week:
CytomX [178.62%], Emergent Bio[102.6%], Deciphera [73.24%], Cue Biopharma[56.04%], Codexis [47.37%], Abeona [41.1%], Seres [40.61%], Ardelyx [35.83%], Poseida [35.21%], CureVac N.V[33.91%], Janux [31.95%] Best Biotech Stocks Daily:
Ardelyx [28.42%], Emergent Bio[17.88%], Codexis [17.37%], Vaxxinity [17.27%], Cue Biopharma[13.30%], Vir nology[13.18%], Lantern Pharma[13.11%], Abeona [13.02%], CureVac N.V[12.64%], Ginkgo Bioworks[12.33%], Rani [12.13%]