
 Login Sign Up


| |||||
 |  | ||||

| 12Stocks.com Market Intelligence |
Best Biotech Stocks
|
|
| Quick Read: Best Biotech Stocks List By Performances & Trends: Daily, Weekly, Year-to-Date, Market Cap (Size) & Technical Trends | |||
| Best Biotech Stocks Views: Quick Browse View, Summary & Slide Show View | |||
| 12Stocks.com Biotech Stocks Performances & Trends Daily | |||||||||
|
|  The overall market intelligence score is 25 (0-bearish to 100-bullish) which puts Biotech sector in short term bearish to neutral trend. The market intelligence score from previous trading session is 32 and a deterioration of trend continues.
| ||||||||
Here are the market intelligence trend scores of the most requested Biotech stocks at 12Stocks.com (click stock name for detailed review):
|


| 12Stocks.com: Investing in Biotech sector with Stocks | |
|
The following table helps investors and traders sort through current performance and trends (as measured by market intelligence score) of various
stocks in the Biotech sector. Quick View: Move mouse or cursor over stock symbol (ticker) to view short-term Technical chart and over stock name to view long term chart. Click on  to add stock symbol to your watchlist and to add stock symbol to your watchlist and  to view watchlist. Click on any ticker or stock name for detailed market intelligence report for that stock. to view watchlist. Click on any ticker or stock name for detailed market intelligence report for that stock. |
12Stocks.com Performance of Stocks in Biotech Sector
| Ticker | Stock Name | Watchlist | Category | Recent Price | Market Intelligence Score | Change % | Weekly Change% |
| KZR | Kezar Life |   | Biotechnology | 0.78 | 50 | -2.72% | -1.00% |
| ANIK | Anika | | Biotechnology | 25.58 | 76 | -1.24% | -1.01% |
| VYGR | Voyager | | Biotechnology | 7.42 | 51 | -1.98% | -1.07% |
| SNDX | Syndax | | Biotechnology | 20.57 | 54 | -1.06% | -1.11% |
| INBX | Inhibrx | | Biotechnology | 34.07 | 18 | -0.92% | -1.13% |
| BHVN | Biohaven | | Biotechnology | 38.54 | 10 | -0.46% | -1.15% |
| AVRO | AVROBIO | | Biotechnology | 1.19 | 0 | 0.00% | -1.24% |
| UBX | Unity nology | | Biotechnology | 1.48 | 10 | 0.68% | -1.33% |
| LYEL | Lyell Immunopharma | | Biotechnology | 2.20 | 76 | -10.57% | -1.35% |
| OCX | OncoCyte | | Biotechnology | 2.46 | 10 | 0.00% | -1.40% |
| QTRX | Quanterix | | Biotechnology | 15.61 | 10 | -2.68% | -1.45% |
| IKNA | Ikena Oncology | | Biotechnology | 1.31 | 34 | 0.00% | -1.50% |
| PRQR | ProQR | | Biotechnology | 1.96 | 32 | -2.49% | -1.51% |
| AURA | Aura | | Biotechnology | 7.08 | 20 | -0.56% | -1.53% |
| GLPG | Galapagos NV | | Biotechnology | 28.63 | 20 | -0.49% | -1.55% |
| BBIO | BridgeBio Pharma | | Biotechnology | 24.35 | 20 | -2.72% | -1.58% |
| IMVT | Immunovant | | Biotechnology | 27.79 | 35 | -3.51% | -1.59% |
| CRNX | Crinetics | | Biotechnology | 42.28 | 56 | -2.40% | -1.63% |
| SGMO | Sangamo | | Biotechnology | 0.50 | 44 | 2.03% | -1.66% |
| OLMA | Olema | | Biotechnology | 9.70 | 35 | -4.48% | -1.67% |
| CRBU | Caribou | | Biotechnology | 3.79 | 10 | -1.94% | -1.69% |
| FBIO | Fortress | | Biotechnology | 1.72 | 35 | -3.91% | -1.71% |
| RAPT | RAPT | | Biotechnology | 7.82 | 10 | -1.01% | -1.76% |
| KRYS | Krystal | | Biotechnology | 155.74 | 41 | -2.08% | -1.83% |
| ABOS | Acumen | | Biotechnology | 3.09 | 25 | -2.52% | -1.90% |
| To view more stocks, click on Next / Previous arrows or select different range: 0 - 25 , 25 - 50 , 50 - 75 , 75 - 100 , 100 - 125 , 125 - 150 , 150 - 175 , 175 - 200 , 200 - 225 , 225 - 250 , 250 - 275 , 275 - 300 , 300 - 325 , 325 - 350 , 350 - 375 , 375 - 400 | ||
 | Click To Change The Sort Order: By Market Cap or Company Size Performance: Year-to-date, Week and Day |  |
|
Get the most comprehensive stock market coverage daily at 12Stocks.com ➞ Best Stocks Today ➞ Best Stocks Weekly ➞ Best Stocks Year-to-Date ➞ Best Stocks Trends ➞  Best Stocks Today 12Stocks.com Best Nasdaq Stocks ➞ Best S&P 500 Stocks ➞ Best Tech Stocks ➞ Best Biotech Stocks ➞ |
| Detailed Overview of Biotech Stocks |
| Biotech Technical Overview, Leaders & Laggards, Top Biotech ETF Funds & Detailed Biotech Stocks List, Charts, Trends & More |
| Biotech Sector: Technical Analysis, Trends & YTD Performance | |
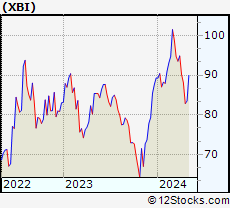
| Biotech sector, as represented by XBI, an exchange-traded fund [ETF] that holds basket of Biotech stocks (e.g, Amgen, Celgene) is down by -7.92% and is currently underperforming the overall market by -13.08% year-to-date. Below is a quick view of Technical charts and trends: | |
 XBI Weekly Chart |
|
| Long Term Trend: Not Good | |
| Medium Term Trend: Not Good | |
 XBI Daily Chart |
|
| Short Term Trend: Very Good | |
| Overall Trend Score: 25 | |
| YTD Performance: -7.92% | |
| **Trend Scores & Views Are Only For Educational Purposes And Not For Investing | |
| 12Stocks.com: Top Performing Biotech Sector Stocks | ||||||||||||||||||||||||||||||||||||||||||||||||
 The top performing Biotech sector stocks year to date are
Now, more recently, over last week, the top performing Biotech sector stocks on the move are


|
||||||||||||||||||||||||||||||||||||||||||||||||
| 12Stocks.com: Investing in Biotech Sector using Exchange Traded Funds | |
|
The following table shows list of key exchange traded funds (ETF) that
help investors track Biotech Index. For detailed view, check out our ETF Funds section of our website. Quick View: Move mouse or cursor over ETF symbol (ticker) to view short-term Technical chart and over ETF name to view long term chart. Click on ticker or stock name for detailed view. Click on to add stock symbol to your watchlist and to view watchlist. |
12Stocks.com List of ETFs that track Biotech Index
| Ticker | ETF Name | Watchlist | Recent Price | Market Intelligence Score | Change % | Week % | Year-to-date % |
| LABD | Biotech Bear 3X | | 11.03 | 75 | 6.36 | 2.13 | 13.83% |
| XBI | Biotech | | 82.22 | 25 | -2.05 | -0.74 | -7.92% |
| LABU | Biotech Bull 3X | | 83.72 | 25 | -6.35 | -2.71 | -31.36% |
| IBB | Biotechnology | | 125.67 | 18 | -1.64 | 0.76 | -7.49% |
| IYH | Healthcare | | 58.68 | 45 | -0.69 | 0.89 | 2.5% |
| IHF | Healthcare Providers | | 52.11 | 55 | -0.29 | -0.19 | -0.76% |
| IXJ | Global Healthcare | | 88.91 | 25 | -0.45 | 1.32 | 2.53% |
| BBH | Biotech | | 154.61 | 49 | -1.73 | 1.48 | -6.47% |
| FBT | First NYSE | | 142.59 | 25 | -1.93 | 0.64 | -9.78% |
| CURE | Healthcare Bull 3X | | 105.32 | 25 | -2.35 | 1.92 | 3.52% |
| BIB | Biotechnology | | 48.83 | 32 | -2.69 | 1.31 | -14.41% |
| BIS | Short Biotech | | 20.59 | 61 | 2.49 | -1.46 | 13.95% |
| PTH | DWA Healthcare Momentum | | 39.60 | 46 | -0.08 | 0.18 | 1.18% |
| PBE | Biotech & Genome | | 59.85 | 32 | -1.69 | 0 | -9.1% |
| BBC | Bio Biotechnology Clinical | | 24.70 | 36 | -3.62 | -0.04 | 1.01% |
| BTEC | Principal Healthcare Innovators | | 34.21 | 32 | 0.02 | 1.04 | -5.83% |
| BBP | Bio Biotechnology Products | | 51.14 | 35 | -2.40 | 1.41 | -11.96% |
| 12Stocks.com: Charts, Trends, Fundamental Data and Performances of Biotech Stocks | |
|
We now take in-depth look at all Biotech stocks including charts, multi-period performances and overall trends (as measured by market intelligence score). One can sort Biotech stocks (click link to choose) by Daily, Weekly and by Year-to-Date performances. Also, one can sort by size of the company or by market capitalization. |
| Select Your Default Chart Type: | |||||
| |||||
| Click on stock symbol or name for detailed view. Click on to add stock symbol to your watchlist and to view watchlist. Quick View: Move mouse or cursor over "Daily" to quickly view daily Technical stock chart and over "Weekly" to view weekly Technical stock chart. | |||||

 | KZR Kezar Life Sciences, Inc. |
| Sector: Health Care | |
| SubSector: Biotechnology | |
| MarketCap: 174.885 Millions | |
| Recent Price: 0.78 Market Intelligence Score: 50 | |
| Day Percent Change: -2.72% Day Change: -0.02 | |
| Week Change: -1% Year-to-date Change: -17.7% | |
| KZR Links: Profile News Message Board | |
| Charts:- Daily , Weekly | |
| Add KZR to Watchlist: View: Get Complete KZR Trend Analysis ➞ | |
 | ANIK Anika Therapeutics, Inc. |
| Sector: Health Care | |
| SubSector: Biotechnology | |
| MarketCap: 438.385 Millions | |
| Recent Price: 25.58 Market Intelligence Score: 76 | |
| Day Percent Change: -1.24% Day Change: -0.32 | |
| Week Change: -1.01% Year-to-date Change: 12.9% | |
| ANIK Links: Profile News Message Board | |
| Charts:- Daily , Weekly | |
| Add ANIK to Watchlist: View: Get Complete ANIK Trend Analysis ➞ | |
 | VYGR Voyager Therapeutics, Inc. |
| Sector: Health Care | |
| SubSector: Biotechnology | |
| MarketCap: 321.085 Millions | |
| Recent Price: 7.42 Market Intelligence Score: 51 | |
| Day Percent Change: -1.98% Day Change: -0.15 | |
| Week Change: -1.07% Year-to-date Change: -12.1% | |
| VYGR Links: Profile News Message Board | |
| Charts:- Daily , Weekly | |
| Add VYGR to Watchlist: View: Get Complete VYGR Trend Analysis ➞ | |
 | SNDX Syndax Pharmaceuticals, Inc. |
| Sector: Health Care | |
| SubSector: Biotechnology | |
| MarketCap: 365.985 Millions | |
| Recent Price: 20.57 Market Intelligence Score: 54 | |
| Day Percent Change: -1.06% Day Change: -0.22 | |
| Week Change: -1.11% Year-to-date Change: -4.8% | |
| SNDX Links: Profile News Message Board | |
| Charts:- Daily , Weekly | |
| Add SNDX to Watchlist: View: Get Complete SNDX Trend Analysis ➞ | |
 | INBX Inhibrx, Inc. |
| Sector: Health Care | |
| SubSector: Biotechnology | |
| MarketCap: 14187 Millions | |
| Recent Price: 34.07 Market Intelligence Score: 18 | |
| Day Percent Change: -0.92% Day Change: -0.31 | |
| Week Change: -1.13% Year-to-date Change: -10.4% | |
| INBX Links: Profile News Message Board | |
| Charts:- Daily , Weekly | |
| Add INBX to Watchlist: View: Get Complete INBX Trend Analysis ➞ | |
 | BHVN Biohaven Pharmaceutical Holding Company Ltd. |
| Sector: Health Care | |
| SubSector: Biotechnology | |
| MarketCap: 2024.25 Millions | |
| Recent Price: 38.54 Market Intelligence Score: 10 | |
| Day Percent Change: -0.46% Day Change: -0.18 | |
| Week Change: -1.15% Year-to-date Change: -10.0% | |
| BHVN Links: Profile News Message Board | |
| Charts:- Daily , Weekly | |
| Add BHVN to Watchlist: View: Get Complete BHVN Trend Analysis ➞ | |
 | AVRO AVROBIO, Inc. |
| Sector: Health Care | |
| SubSector: Biotechnology | |
| MarketCap: 626.185 Millions | |
| Recent Price: 1.19 Market Intelligence Score: 0 | |
| Day Percent Change: 0.00% Day Change: 0.00 | |
| Week Change: -1.24% Year-to-date Change: -12.5% | |
| AVRO Links: Profile News Message Board | |
| Charts:- Daily , Weekly | |
| Add AVRO to Watchlist: View: Get Complete AVRO Trend Analysis ➞ | |
 | UBX Unity Biotechnology, Inc. |
| Sector: Health Care | |
| SubSector: Biotechnology | |
| MarketCap: 254.985 Millions | |
| Recent Price: 1.48 Market Intelligence Score: 10 | |
| Day Percent Change: 0.68% Day Change: 0.01 | |
| Week Change: -1.33% Year-to-date Change: -23.3% | |
| UBX Links: Profile News Message Board | |
| Charts:- Daily , Weekly | |
| Add UBX to Watchlist: View: Get Complete UBX Trend Analysis ➞ | |
 | LYEL Lyell Immunopharma, Inc. |
| Sector: Health Care | |
| SubSector: Biotechnology | |
| MarketCap: 809 Millions | |
| Recent Price: 2.20 Market Intelligence Score: 76 | |
| Day Percent Change: -10.57% Day Change: -0.26 | |
| Week Change: -1.35% Year-to-date Change: 12.0% | |
| LYEL Links: Profile News Message Board | |
| Charts:- Daily , Weekly | |
| Add LYEL to Watchlist: View: Get Complete LYEL Trend Analysis ➞ | |
 | OCX OncoCyte Corporation |
| Sector: Health Care | |
| SubSector: Biotechnology | |
| MarketCap: 131.485 Millions | |
| Recent Price: 2.46 Market Intelligence Score: 10 | |
| Day Percent Change: 0.00% Day Change: 0.00 | |
| Week Change: -1.4% Year-to-date Change: -1.6% | |
| OCX Links: Profile News Message Board | |
| Charts:- Daily , Weekly | |
| Add OCX to Watchlist: View: Get Complete OCX Trend Analysis ➞ | |
 | QTRX Quanterix Corporation |
| Sector: Health Care | |
| SubSector: Biotechnology | |
| MarketCap: 448.685 Millions | |
| Recent Price: 15.61 Market Intelligence Score: 10 | |
| Day Percent Change: -2.68% Day Change: -0.43 | |
| Week Change: -1.45% Year-to-date Change: -42.9% | |
| QTRX Links: Profile News Message Board | |
| Charts:- Daily , Weekly | |
| Add QTRX to Watchlist: View: Get Complete QTRX Trend Analysis ➞ | |
 | IKNA Ikena Oncology, Inc. |
| Sector: Health Care | |
| SubSector: Biotechnology | |
| MarketCap: 277 Millions | |
| Recent Price: 1.31 Market Intelligence Score: 34 | |
| Day Percent Change: 0.00% Day Change: 0.00 | |
| Week Change: -1.5% Year-to-date Change: -34.5% | |
| IKNA Links: Profile News Message Board | |
| Charts:- Daily , Weekly | |
| Add IKNA to Watchlist: View: Get Complete IKNA Trend Analysis ➞ | |
 | PRQR ProQR Therapeutics N.V. |
| Sector: Health Care | |
| SubSector: Biotechnology | |
| MarketCap: 324.385 Millions | |
| Recent Price: 1.96 Market Intelligence Score: 32 | |
| Day Percent Change: -2.49% Day Change: -0.05 | |
| Week Change: -1.51% Year-to-date Change: -1.0% | |
| PRQR Links: Profile News Message Board | |
| Charts:- Daily , Weekly | |
| Add PRQR to Watchlist: View: Get Complete PRQR Trend Analysis ➞ | |
 | AURA Aura Biosciences, Inc. |
| Sector: Health Care | |
| SubSector: Biotechnology | |
| MarketCap: 469 Millions | |
| Recent Price: 7.08 Market Intelligence Score: 20 | |
| Day Percent Change: -0.56% Day Change: -0.04 | |
| Week Change: -1.53% Year-to-date Change: -20.0% | |
| AURA Links: Profile News Message Board | |
| Charts:- Daily , Weekly | |
| Add AURA to Watchlist: View: Get Complete AURA Trend Analysis ➞ | |
 | GLPG Galapagos NV |
| Sector: Health Care | |
| SubSector: Biotechnology | |
| MarketCap: 9541.55 Millions | |
| Recent Price: 28.63 Market Intelligence Score: 20 | |
| Day Percent Change: -0.49% Day Change: -0.14 | |
| Week Change: -1.55% Year-to-date Change: -29.6% | |
| GLPG Links: Profile News Message Board | |
| Charts:- Daily , Weekly | |
| Add GLPG to Watchlist: View: Get Complete GLPG Trend Analysis ➞ | |
 | BBIO BridgeBio Pharma, Inc. |
| Sector: Health Care | |
| SubSector: Biotechnology | |
| MarketCap: 3879.35 Millions | |
| Recent Price: 24.35 Market Intelligence Score: 20 | |
| Day Percent Change: -2.72% Day Change: -0.68 | |
| Week Change: -1.58% Year-to-date Change: -39.7% | |
| BBIO Links: Profile News Message Board | |
| Charts:- Daily , Weekly | |
| Add BBIO to Watchlist: View: Get Complete BBIO Trend Analysis ➞ | |
 | IMVT Immunovant, Inc. |
| Sector: Health Care | |
| SubSector: Biotechnology | |
| MarketCap: 552.885 Millions | |
| Recent Price: 27.79 Market Intelligence Score: 35 | |
| Day Percent Change: -3.51% Day Change: -1.01 | |
| Week Change: -1.59% Year-to-date Change: -34.0% | |
| IMVT Links: Profile News Message Board | |
| Charts:- Daily , Weekly | |
| Add IMVT to Watchlist: View: Get Complete IMVT Trend Analysis ➞ | |
 | CRNX Crinetics Pharmaceuticals, Inc. |
| Sector: Health Care | |
| SubSector: Biotechnology | |
| MarketCap: 381.085 Millions | |
| Recent Price: 42.28 Market Intelligence Score: 56 | |
| Day Percent Change: -2.40% Day Change: -1.04 | |
| Week Change: -1.63% Year-to-date Change: 18.8% | |
| CRNX Links: Profile News Message Board | |
| Charts:- Daily , Weekly | |
| Add CRNX to Watchlist: View: Get Complete CRNX Trend Analysis ➞ | |
 | SGMO Sangamo Therapeutics, Inc. |
| Sector: Health Care | |
| SubSector: Biotechnology | |
| MarketCap: 779.285 Millions | |
| Recent Price: 0.50 Market Intelligence Score: 44 | |
| Day Percent Change: 2.03% Day Change: 0.01 | |
| Week Change: -1.66% Year-to-date Change: -7.4% | |
| SGMO Links: Profile News Message Board | |
| Charts:- Daily , Weekly | |
| Add SGMO to Watchlist: View: Get Complete SGMO Trend Analysis ➞ | |
 | OLMA Olema Pharmaceuticals, Inc. |
| Sector: Health Care | |
| SubSector: Biotechnology | |
| MarketCap: 17687 Millions | |
| Recent Price: 9.70 Market Intelligence Score: 35 | |
| Day Percent Change: -4.48% Day Change: -0.46 | |
| Week Change: -1.67% Year-to-date Change: -31.1% | |
| OLMA Links: Profile News Message Board | |
| Charts:- Daily , Weekly | |
| Add OLMA to Watchlist: View: Get Complete OLMA Trend Analysis ➞ | |
 | CRBU Caribou Biosciences, Inc. |
| Sector: Health Care | |
| SubSector: Biotechnology | |
| MarketCap: 258 Millions | |
| Recent Price: 3.79 Market Intelligence Score: 10 | |
| Day Percent Change: -1.94% Day Change: -0.07 | |
| Week Change: -1.69% Year-to-date Change: -33.7% | |
| CRBU Links: Profile News Message Board | |
| Charts:- Daily , Weekly | |
| Add CRBU to Watchlist: View: Get Complete CRBU Trend Analysis ➞ | |
 | FBIO Fortress Biotech, Inc. |
| Sector: Health Care | |
| SubSector: Biotechnology | |
| MarketCap: 116.885 Millions | |
| Recent Price: 1.72 Market Intelligence Score: 35 | |
| Day Percent Change: -3.91% Day Change: -0.07 | |
| Week Change: -1.71% Year-to-date Change: -42.9% | |
| FBIO Links: Profile News Message Board | |
| Charts:- Daily , Weekly | |
| Add FBIO to Watchlist: View: Get Complete FBIO Trend Analysis ➞ | |
 | RAPT RAPT Therapeutics, Inc. |
| Sector: Health Care | |
| SubSector: Biotechnology | |
| MarketCap: 368.785 Millions | |
| Recent Price: 7.82 Market Intelligence Score: 10 | |
| Day Percent Change: -1.01% Day Change: -0.08 | |
| Week Change: -1.76% Year-to-date Change: -68.5% | |
| RAPT Links: Profile News Message Board | |
| Charts:- Daily , Weekly | |
| Add RAPT to Watchlist: View: Get Complete RAPT Trend Analysis ➞ | |
 | KRYS Krystal Biotech, Inc. |
| Sector: Health Care | |
| SubSector: Biotechnology | |
| MarketCap: 874.085 Millions | |
| Recent Price: 155.74 Market Intelligence Score: 41 | |
| Day Percent Change: -2.08% Day Change: -3.31 | |
| Week Change: -1.83% Year-to-date Change: 25.5% | |
| KRYS Links: Profile News Message Board | |
| Charts:- Daily , Weekly | |
| Add KRYS to Watchlist: View: Get Complete KRYS Trend Analysis ➞ | |
 | ABOS Acumen Pharmaceuticals, Inc. |
| Sector: Health Care | |
| SubSector: Biotechnology | |
| MarketCap: 199 Millions | |
| Recent Price: 3.09 Market Intelligence Score: 25 | |
| Day Percent Change: -2.52% Day Change: -0.08 | |
| Week Change: -1.9% Year-to-date Change: -19.5% | |
| ABOS Links: Profile News Message Board | |
| Charts:- Daily , Weekly | |
| Add ABOS to Watchlist: View: Get Complete ABOS Trend Analysis ➞ | |
| To view more stocks, click on Next / Previous arrows or select different range: 0 - 25 , 25 - 50 , 50 - 75 , 75 - 100 , 100 - 125 , 125 - 150 , 150 - 175 , 175 - 200 , 200 - 225 , 225 - 250 , 250 - 275 , 275 - 300 , 300 - 325 , 325 - 350 , 350 - 375 , 375 - 400 | ||
| Click To Change The Sort Order: By Market Cap or Company Size Performance: Year-to-date, Week and Day | |
| Select Chart Type: | ||
|
Best Stocks Today 12Stocks.com |
© 2024 12Stocks.com Terms & Conditions Privacy Contact Us
All Information Provided Only For Education And Not To Be Used For Investing or Trading. See Terms & Conditions


One More Thing ... Get Best Stocks Delivered Daily!
Never Ever Miss A Move With Our Top Ten Stocks Lists
Find Best Stocks In Any Market - Bull or Bear Market
Take A Peek At Our Top Ten Stocks Lists: Daily, Weekly, Year-to-Date & Top Trends
Find Best Stocks In Any Market - Bull or Bear Market
Take A Peek At Our Top Ten Stocks Lists: Daily, Weekly, Year-to-Date & Top Trends
Biotech Stocks With Best Up Trends [0-bearish to 100-bullish]: Annovis Bio[100], Agios [100], Agenus [95], Mesoblast [95], Cullinan Oncology[93], Avadel [93], Pieris [93], NewAmsterdam Pharma[93], PureTech Health[93], Exelixis [90], ALX Oncology[88]
Best Biotech Stocks Year-to-Date:
Pieris [6273.63%], Precision [2590.41%], Inovio [1885.29%], Assembly [1529.07%], NuCana [1198.17%], Adverum nologies[1147.34%], Agenus [902.54%], Affimed N.V[680.8%], Mesoblast [459.09%], Corbus [454.64%], Janux [338.34%] Best Biotech Stocks This Week:
Pieris [7900%], Agenus [56.31%], ProKidney [32.84%], Seres [32.65%], Annovis Bio[30%], BeyondSpring [26.11%], Cullinan Oncology[22.92%], Pharvaris N.V[18.84%], Mesoblast [18.04%], BeiGene [14.7%], Avid Bioservices[14.2%] Best Biotech Stocks Daily:
Galera [13.74%], Agenus [11.86%], ADiTx [10.57%], Apollomics [9.94%], Pharming [9.06%], Structure [8.13%], Pharvaris N.V[7.91%], ProKidney [7.75%], Avid Bioservices[7.17%], Merus N.V[7.05%], Zura Bio[6.75%]