
 Login Sign Up


| |||||
 |  | ||||

| 12Stocks.com Market Intelligence |
Best Biotech Stocks
|
|
| Quick Read: Best Biotech Stocks List By Performances & Trends: Daily, Weekly, Year-to-Date, Market Cap (Size) & Technical Trends | |||
| Best Biotech Stocks Views: Quick Browse View, Summary & Slide Show View | |||
| 12Stocks.com Biotech Stocks Performances & Trends Daily | |||||||||
|
|  The overall market intelligence score is 49 (0-bearish to 100-bullish) which puts Biotech sector in short term neutral trend. The market intelligence score from previous trading session is 32 and hence an improvement of trend.
| ||||||||
Here are the market intelligence trend scores of the most requested Biotech stocks at 12Stocks.com (click stock name for detailed review):
|


| 12Stocks.com: Investing in Biotech sector with Stocks | |
|
The following table helps investors and traders sort through current performance and trends (as measured by market intelligence score) of various
stocks in the Biotech sector. Quick View: Move mouse or cursor over stock symbol (ticker) to view short-term Technical chart and over stock name to view long term chart. Click on  to add stock symbol to your watchlist and to add stock symbol to your watchlist and  to view watchlist. Click on any ticker or stock name for detailed market intelligence report for that stock. to view watchlist. Click on any ticker or stock name for detailed market intelligence report for that stock. |
12Stocks.com Performance of Stocks in Biotech Sector
| Ticker | Stock Name | Watchlist | Category | Recent Price | Market Intelligence Score | Change % | Weekly Change% |
| OABI | OmniAb |   | Biotechnology | 4.54 | 42 | 2.14% | 1.57% |
| MNOV | MediciNova | | Biotechnology | 1.33 | 27 | 3.10% | 1.53% |
| NXTC | NextCure | | Biotechnology | 1.37 | 32 | 13.22% | 1.48% |
| FOLD | Amicus | | Biotechnology | 10.43 | 42 | 4.40% | 1.46% |
| GALT | Galectin | | Biotechnology | 3.50 | 61 | -0.28% | 1.45% |
| GBIO | Generation Bio | | Biotechnology | 2.94 | 56 | 3.89% | 1.38% |
| TARS | Tarsus | | Biotechnology | 32.48 | 32 | 3.34% | 1.37% |
| TSHA | Taysha Gene | | Biotechnology | 2.42 | 32 | -0.41% | 1.26% |
| LGND | Ligand | | Biotechnology | 71.42 | 37 | 2.19% | 1.20% |
| CLLS | Cellectis S.A | | Biotechnology | 2.54 | 42 | -0.94% | 1.20% |
| VRTX | Vertex | | Biotechnology | 402.14 | 57 | 2.38% | 1.17% |
| FBIO | Fortress | | Biotechnology | 1.74 | 35 | -1.14% | 1.16% |
| SCPH | sc | | Biotechnology | 4.54 | 52 | 1.57% | 1.11% |
| AXON | Axovant | | Biotechnology | 311.57 | 73 | -0.67% | 1.08% |
| ALLO | Allogene | | Biotechnology | 2.92 | 37 | 5.80% | 1.04% |
| GPCR | Structure | | Biotechnology | 39.31 | 42 | -0.03% | 1.04% |
| RAPT | RAPT | | Biotechnology | 8.18 | 59 | 6.23% | 0.99% |
| MLTX | MoonLake Immuno | | Biotechnology | 42.89 | 42 | 4.58% | 0.99% |
| CHRS | Coherus | | Biotechnology | 2.06 | 35 | 5.10% | 0.98% |
| APRE | Aprea | | Biotechnology | 5.25 | 17 | 2.94% | 0.96% |
| REPL | Replimune | | Biotechnology | 6.48 | 35 | 2.05% | 0.93% |
| QURE | uniQure N.V | | Biotechnology | 4.57 | 40 | 3.51% | 0.88% |
| PHAT | Phathom | | Biotechnology | 9.26 | 30 | 2.55% | 0.87% |
| IMCR | Immunocore | | Biotechnology | 59.02 | 64 | 0.19% | 0.87% |
| IGMS | IGM | | Biotechnology | 9.48 | 57 | -1.56% | 0.85% |
| To view more stocks, click on Next / Previous arrows or select different range: 0 - 25 , 25 - 50 , 50 - 75 , 75 - 100 , 100 - 125 , 125 - 150 , 150 - 175 , 175 - 200 , 200 - 225 , 225 - 250 , 250 - 275 , 275 - 300 , 300 - 325 , 325 - 350 , 350 - 375 , 375 - 400 | ||
 | Click To Change The Sort Order: By Market Cap or Company Size Performance: Year-to-date, Week and Day |  |
|
Get the most comprehensive stock market coverage daily at 12Stocks.com ➞ Best Stocks Today ➞ Best Stocks Weekly ➞ Best Stocks Year-to-Date ➞ Best Stocks Trends ➞  Best Stocks Today 12Stocks.com Best Nasdaq Stocks ➞ Best S&P 500 Stocks ➞ Best Tech Stocks ➞ Best Biotech Stocks ➞ |
| Detailed Overview of Biotech Stocks |
| Biotech Technical Overview, Leaders & Laggards, Top Biotech ETF Funds & Detailed Biotech Stocks List, Charts, Trends & More |
| Biotech Sector: Technical Analysis, Trends & YTD Performance | |
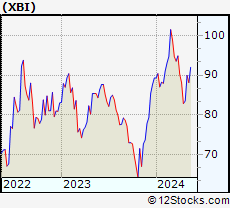
| Biotech sector, as represented by XBI, an exchange-traded fund [ETF] that holds basket of Biotech stocks (e.g, Amgen, Celgene) is down by -2.2% and is currently underperforming the overall market by -6.74% year-to-date. Below is a quick view of Technical charts and trends: | |
 XBI Weekly Chart |
|
| Long Term Trend: Not Good | |
| Medium Term Trend: Not Good | |
 XBI Daily Chart |
|
| Short Term Trend: Very Good | |
| Overall Trend Score: 49 | |
| YTD Performance: -2.2% | |
| **Trend Scores & Views Are Only For Educational Purposes And Not For Investing | |
| 12Stocks.com: Top Performing Biotech Sector Stocks | ||||||||||||||||||||||||||||||||||||||||||||||||
 The top performing Biotech sector stocks year to date are
Now, more recently, over last week, the top performing Biotech sector stocks on the move are


|
||||||||||||||||||||||||||||||||||||||||||||||||
| 12Stocks.com: Investing in Biotech Sector using Exchange Traded Funds | |
|
The following table shows list of key exchange traded funds (ETF) that
help investors track Biotech Index. For detailed view, check out our ETF Funds section of our website. Quick View: Move mouse or cursor over ETF symbol (ticker) to view short-term Technical chart and over ETF name to view long term chart. Click on ticker or stock name for detailed view. Click on to add stock symbol to your watchlist and to view watchlist. |
12Stocks.com List of ETFs that track Biotech Index
| Ticker | ETF Name | Watchlist | Recent Price | Market Intelligence Score | Change % | Week % | Year-to-date % |
| LABD | Biotech Bear 3X | | 9.03 | 56 | -10.24 | -14.16 | -6.81% |
| XBI | Biotech | | 87.33 | 49 | 3.20 | 4.6 | -2.2% |
| LABU | Biotech Bull 3X | | 99.81 | 49 | 9.84 | 14.06 | -18.17% |
| IBB | Biotechnology | | 129.49 | 57 | 2.02 | 2.37 | -4.68% |
| IYH | Healthcare | | 59.18 | 57 | 0.59 | 0.97 | 3.37% |
| IXJ | Global Healthcare | | 89.56 | 50 | 0.27 | 0.49 | 3.27% |
| IHF | Healthcare Providers | | 51.44 | 15 | -0.77 | -0.92 | -2.04% |
| FBT | First NYSE | | 146.02 | 42 | 1.46 | 1.65 | -7.61% |
| BIB | Biotechnology | | 52.58 | 64 | 4.43 | 5.88 | -7.84% |
| CURE | Healthcare Bull 3X | | 106.56 | 64 | 0.61 | 1.19 | 4.74% |
| PBE | Biotech & Genome | | 62.87 | 64 | 3.29 | 4.12 | -4.51% |
| PTH | DWA Healthcare Momentum | | 41.30 | 49 | 2.00 | 3.53 | 5.52% |
| BIS | Short Biotech | | 19.05 | 36 | -3.98 | -5.79 | 5.42% |
| BBH | Biotech | | 158.86 | 64 | 1.55 | 2.06 | -3.9% |
| BTEC | Principal Healthcare Innovators | | 36.34 | 39 | 4.88 | 6.1 | 0.03% |
| BBC | Bio Biotechnology Clinical | | 27.47 | 27 | 5.01 | 7.58 | 12.32% |
| BBP | Bio Biotechnology Products | | 53.47 | 64 | 0.35 | 3.85 | -7.96% |
| 12Stocks.com: Charts, Trends, Fundamental Data and Performances of Biotech Stocks | |
|
We now take in-depth look at all Biotech stocks including charts, multi-period performances and overall trends (as measured by market intelligence score). One can sort Biotech stocks (click link to choose) by Daily, Weekly and by Year-to-Date performances. Also, one can sort by size of the company or by market capitalization. |
| Select Your Default Chart Type: | |||||
| |||||
| Click on stock symbol or name for detailed view. Click on to add stock symbol to your watchlist and to view watchlist. Quick View: Move mouse or cursor over "Daily" to quickly view daily Technical stock chart and over "Weekly" to view weekly Technical stock chart. | |||||

 | OABI OmniAb, Inc. |
| Sector: Health Care | |
| SubSector: Biotechnology | |
| MarketCap: 570 Millions | |
| Recent Price: 4.54 Market Intelligence Score: 42 | |
| Day Percent Change: 2.14% Day Change: 0.09 | |
| Week Change: 1.57% Year-to-date Change: -25.1% | |
| OABI Links: Profile News Message Board | |
| Charts:- Daily , Weekly | |
| Add OABI to Watchlist: View: Get Complete OABI Trend Analysis ➞ | |
 | MNOV MediciNova, Inc. |
| Sector: Health Care | |
| SubSector: Biotechnology | |
| MarketCap: 137.685 Millions | |
| Recent Price: 1.33 Market Intelligence Score: 27 | |
| Day Percent Change: 3.10% Day Change: 0.04 | |
| Week Change: 1.53% Year-to-date Change: -11.3% | |
| MNOV Links: Profile News Message Board | |
| Charts:- Daily , Weekly | |
| Add MNOV to Watchlist: View: Get Complete MNOV Trend Analysis ➞ | |
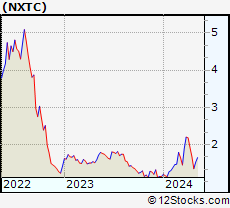 | NXTC NextCure, Inc. |
| Sector: Health Care | |
| SubSector: Biotechnology | |
| MarketCap: 1040.95 Millions | |
| Recent Price: 1.37 Market Intelligence Score: 32 | |
| Day Percent Change: 13.22% Day Change: 0.16 | |
| Week Change: 1.48% Year-to-date Change: 20.2% | |
| NXTC Links: Profile News Message Board | |
| Charts:- Daily , Weekly | |
| Add NXTC to Watchlist: View: Get Complete NXTC Trend Analysis ➞ | |
 | FOLD Amicus Therapeutics, Inc. |
| Sector: Health Care | |
| SubSector: Biotechnology | |
| MarketCap: 2676.75 Millions | |
| Recent Price: 10.43 Market Intelligence Score: 42 | |
| Day Percent Change: 4.40% Day Change: 0.44 | |
| Week Change: 1.46% Year-to-date Change: -26.5% | |
| FOLD Links: Profile News Message Board | |
| Charts:- Daily , Weekly | |
| Add FOLD to Watchlist: View: Get Complete FOLD Trend Analysis ➞ | |
 | GALT Galectin Therapeutics, Inc. |
| Sector: Health Care | |
| SubSector: Biotechnology | |
| MarketCap: 114.185 Millions | |
| Recent Price: 3.50 Market Intelligence Score: 61 | |
| Day Percent Change: -0.28% Day Change: -0.01 | |
| Week Change: 1.45% Year-to-date Change: 110.8% | |
| GALT Links: Profile News Message Board | |
| Charts:- Daily , Weekly | |
| Add GALT to Watchlist: View: Get Complete GALT Trend Analysis ➞ | |
 | GBIO Generation Bio Co. |
| Sector: Health Care | |
| SubSector: Biotechnology | |
| MarketCap: 17487 Millions | |
| Recent Price: 2.94 Market Intelligence Score: 56 | |
| Day Percent Change: 3.89% Day Change: 0.11 | |
| Week Change: 1.38% Year-to-date Change: 78.2% | |
| GBIO Links: Profile News Message Board | |
| Charts:- Daily , Weekly | |
| Add GBIO to Watchlist: View: Get Complete GBIO Trend Analysis ➞ | |
 | TARS Tarsus Pharmaceuticals, Inc. |
| Sector: Health Care | |
| SubSector: Biotechnology | |
| MarketCap: 74487 Millions | |
| Recent Price: 32.48 Market Intelligence Score: 32 | |
| Day Percent Change: 3.34% Day Change: 1.05 | |
| Week Change: 1.37% Year-to-date Change: 60.2% | |
| TARS Links: Profile News Message Board | |
| Charts:- Daily , Weekly | |
| Add TARS to Watchlist: View: Get Complete TARS Trend Analysis ➞ | |
 | TSHA Taysha Gene Therapies, Inc. |
| Sector: Health Care | |
| SubSector: Biotechnology | |
| MarketCap: 76487 Millions | |
| Recent Price: 2.42 Market Intelligence Score: 32 | |
| Day Percent Change: -0.41% Day Change: -0.01 | |
| Week Change: 1.26% Year-to-date Change: 36.0% | |
| TSHA Links: Profile News Message Board | |
| Charts:- Daily , Weekly | |
| Add TSHA to Watchlist: View: Get Complete TSHA Trend Analysis ➞ | |
 | LGND Ligand Pharmaceuticals Incorporated |
| Sector: Health Care | |
| SubSector: Biotechnology | |
| MarketCap: 1344.45 Millions | |
| Recent Price: 71.42 Market Intelligence Score: 37 | |
| Day Percent Change: 2.19% Day Change: 1.53 | |
| Week Change: 1.2% Year-to-date Change: 0.0% | |
| LGND Links: Profile News Message Board | |
| Charts:- Daily , Weekly | |
| Add LGND to Watchlist: View: Get Complete LGND Trend Analysis ➞ | |
 | CLLS Cellectis S.A. |
| Sector: Health Care | |
| SubSector: Biotechnology | |
| MarketCap: 398.685 Millions | |
| Recent Price: 2.54 Market Intelligence Score: 42 | |
| Day Percent Change: -0.94% Day Change: -0.02 | |
| Week Change: 1.2% Year-to-date Change: -17.7% | |
| CLLS Links: Profile News Message Board | |
| Charts:- Daily , Weekly | |
| Add CLLS to Watchlist: View: Get Complete CLLS Trend Analysis ➞ | |
 | VRTX Vertex Pharmaceuticals Incorporated |
| Sector: Health Care | |
| SubSector: Biotechnology | |
| MarketCap: 57669.6 Millions | |
| Recent Price: 402.14 Market Intelligence Score: 57 | |
| Day Percent Change: 2.38% Day Change: 9.33 | |
| Week Change: 1.17% Year-to-date Change: -1.2% | |
| VRTX Links: Profile News Message Board | |
| Charts:- Daily , Weekly | |
| Add VRTX to Watchlist: View: Get Complete VRTX Trend Analysis ➞ | |
 | FBIO Fortress Biotech, Inc. |
| Sector: Health Care | |
| SubSector: Biotechnology | |
| MarketCap: 116.885 Millions | |
| Recent Price: 1.74 Market Intelligence Score: 35 | |
| Day Percent Change: -1.14% Day Change: -0.02 | |
| Week Change: 1.16% Year-to-date Change: -42.2% | |
| FBIO Links: Profile News Message Board | |
| Charts:- Daily , Weekly | |
| Add FBIO to Watchlist: View: Get Complete FBIO Trend Analysis ➞ | |
 | SCPH scPharmaceuticals Inc. |
| Sector: Health Care | |
| SubSector: Biotechnology | |
| MarketCap: 136.185 Millions | |
| Recent Price: 4.54 Market Intelligence Score: 52 | |
| Day Percent Change: 1.57% Day Change: 0.07 | |
| Week Change: 1.11% Year-to-date Change: -27.6% | |
| SCPH Links: Profile News Message Board | |
| Charts:- Daily , Weekly | |
| Add SCPH to Watchlist: View: Get Complete SCPH Trend Analysis ➞ | |
 | AXON Axovant Sciences Ltd. |
| Sector: Health Care | |
| SubSector: Biotechnology | |
| MarketCap: 1492.04 Millions | |
| Recent Price: 311.57 Market Intelligence Score: 73 | |
| Day Percent Change: -0.67% Day Change: -2.09 | |
| Week Change: 1.08% Year-to-date Change: 20.6% | |
| AXON Links: Profile News Message Board | |
| Charts:- Daily , Weekly | |
| Add AXON to Watchlist: View: Get Complete AXON Trend Analysis ➞ | |
 | ALLO Allogene Therapeutics, Inc. |
| Sector: Health Care | |
| SubSector: Biotechnology | |
| MarketCap: 2858.65 Millions | |
| Recent Price: 2.92 Market Intelligence Score: 37 | |
| Day Percent Change: 5.80% Day Change: 0.16 | |
| Week Change: 1.04% Year-to-date Change: -9.0% | |
| ALLO Links: Profile News Message Board | |
| Charts:- Daily , Weekly | |
| Add ALLO to Watchlist: View: Get Complete ALLO Trend Analysis ➞ | |
 | GPCR Structure Therapeutics Inc. |
| Sector: Health Care | |
| SubSector: Biotechnology | |
| MarketCap: 1530 Millions | |
| Recent Price: 39.31 Market Intelligence Score: 42 | |
| Day Percent Change: -0.03% Day Change: -0.01 | |
| Week Change: 1.04% Year-to-date Change: 3.2% | |
| GPCR Links: Profile News Message Board | |
| Charts:- Daily , Weekly | |
| Add GPCR to Watchlist: View: Get Complete GPCR Trend Analysis ➞ | |
 | RAPT RAPT Therapeutics, Inc. |
| Sector: Health Care | |
| SubSector: Biotechnology | |
| MarketCap: 368.785 Millions | |
| Recent Price: 8.18 Market Intelligence Score: 59 | |
| Day Percent Change: 6.23% Day Change: 0.48 | |
| Week Change: 0.99% Year-to-date Change: -67.1% | |
| RAPT Links: Profile News Message Board | |
| Charts:- Daily , Weekly | |
| Add RAPT to Watchlist: View: Get Complete RAPT Trend Analysis ➞ | |
 | MLTX MoonLake Immunotherapeutics |
| Sector: Health Care | |
| SubSector: Biotechnology | |
| MarketCap: 2670 Millions | |
| Recent Price: 42.89 Market Intelligence Score: 42 | |
| Day Percent Change: 4.58% Day Change: 1.88 | |
| Week Change: 0.99% Year-to-date Change: -31.7% | |
| MLTX Links: Profile News Message Board | |
| Charts:- Daily , Weekly | |
| Add MLTX to Watchlist: View: Get Complete MLTX Trend Analysis ➞ | |
 | CHRS Coherus BioSciences, Inc. |
| Sector: Health Care | |
| SubSector: Biotechnology | |
| MarketCap: 1073.45 Millions | |
| Recent Price: 2.06 Market Intelligence Score: 35 | |
| Day Percent Change: 5.10% Day Change: 0.10 | |
| Week Change: 0.98% Year-to-date Change: -38.1% | |
| CHRS Links: Profile News Message Board | |
| Charts:- Daily , Weekly | |
| Add CHRS to Watchlist: View: Get Complete CHRS Trend Analysis ➞ | |
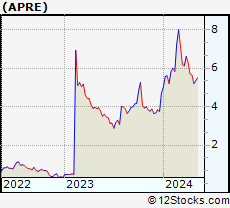 | APRE Aprea Therapeutics, Inc. |
| Sector: Health Care | |
| SubSector: Biotechnology | |
| MarketCap: 699.285 Millions | |
| Recent Price: 5.25 Market Intelligence Score: 17 | |
| Day Percent Change: 2.94% Day Change: 0.15 | |
| Week Change: 0.96% Year-to-date Change: 11.7% | |
| APRE Links: Profile News Message Board | |
| Charts:- Daily , Weekly | |
| Add APRE to Watchlist: View: Get Complete APRE Trend Analysis ➞ | |
 | REPL Replimune Group, Inc. |
| Sector: Health Care | |
| SubSector: Biotechnology | |
| MarketCap: 367.885 Millions | |
| Recent Price: 6.48 Market Intelligence Score: 35 | |
| Day Percent Change: 2.05% Day Change: 0.13 | |
| Week Change: 0.93% Year-to-date Change: -23.1% | |
| REPL Links: Profile News Message Board | |
| Charts:- Daily , Weekly | |
| Add REPL to Watchlist: View: Get Complete REPL Trend Analysis ➞ | |
 | QURE uniQure N.V. |
| Sector: Health Care | |
| SubSector: Biotechnology | |
| MarketCap: 2267.25 Millions | |
| Recent Price: 4.57 Market Intelligence Score: 40 | |
| Day Percent Change: 3.51% Day Change: 0.16 | |
| Week Change: 0.88% Year-to-date Change: -32.5% | |
| QURE Links: Profile News Message Board | |
| Charts:- Daily , Weekly | |
| Add QURE to Watchlist: View: Get Complete QURE Trend Analysis ➞ | |
 | PHAT Phathom Pharmaceuticals, Inc. |
| Sector: Health Care | |
| SubSector: Biotechnology | |
| MarketCap: 728.785 Millions | |
| Recent Price: 9.26 Market Intelligence Score: 30 | |
| Day Percent Change: 2.55% Day Change: 0.23 | |
| Week Change: 0.87% Year-to-date Change: 1.4% | |
| PHAT Links: Profile News Message Board | |
| Charts:- Daily , Weekly | |
| Add PHAT to Watchlist: View: Get Complete PHAT Trend Analysis ➞ | |
 | IMCR Immunocore Holdings plc |
| Sector: Health Care | |
| SubSector: Biotechnology | |
| MarketCap: 2830 Millions | |
| Recent Price: 59.02 Market Intelligence Score: 64 | |
| Day Percent Change: 0.19% Day Change: 0.11 | |
| Week Change: 0.87% Year-to-date Change: -13.1% | |
| IMCR Links: Profile News Message Board | |
| Charts:- Daily , Weekly | |
| Add IMCR to Watchlist: View: Get Complete IMCR Trend Analysis ➞ | |
 | IGMS IGM Biosciences, Inc. |
| Sector: Health Care | |
| SubSector: Biotechnology | |
| MarketCap: 2000.05 Millions | |
| Recent Price: 9.48 Market Intelligence Score: 57 | |
| Day Percent Change: -1.56% Day Change: -0.15 | |
| Week Change: 0.85% Year-to-date Change: 14.1% | |
| IGMS Links: Profile News Message Board | |
| Charts:- Daily , Weekly | |
| Add IGMS to Watchlist: View: Get Complete IGMS Trend Analysis ➞ | |
| To view more stocks, click on Next / Previous arrows or select different range: 0 - 25 , 25 - 50 , 50 - 75 , 75 - 100 , 100 - 125 , 125 - 150 , 150 - 175 , 175 - 200 , 200 - 225 , 225 - 250 , 250 - 275 , 275 - 300 , 300 - 325 , 325 - 350 , 350 - 375 , 375 - 400 | ||
| Click To Change The Sort Order: By Market Cap or Company Size Performance: Year-to-date, Week and Day | |
| Select Chart Type: | ||
|
Best Stocks Today 12Stocks.com |
© 2024 12Stocks.com Terms & Conditions Privacy Contact Us
All Information Provided Only For Education And Not To Be Used For Investing or Trading. See Terms & Conditions


One More Thing ... Get Best Stocks Delivered Daily!
Never Ever Miss A Move With Our Top Ten Stocks Lists
Find Best Stocks In Any Market - Bull or Bear Market
Take A Peek At Our Top Ten Stocks Lists: Daily, Weekly, Year-to-Date & Top Trends
Find Best Stocks In Any Market - Bull or Bear Market
Take A Peek At Our Top Ten Stocks Lists: Daily, Weekly, Year-to-Date & Top Trends
Biotech Stocks With Best Up Trends [0-bearish to 100-bullish]: CytomX [100], Summit [100], Xencor [100], Humacyte [100], Mesoblast [100], United [100], Nuvation Bio[100], AnaptysBio [100], PTC [100], Revolution Medicines[100], Cullinan Oncology[100]
Best Biotech Stocks Year-to-Date:
Pieris [6317.58%], Avenue [2856.52%], Precision [2771.23%], Inovio [2172.55%], Assembly [1518.1%], Agenus [1501.64%], NuCana [1245.5%], Adverum nologies[1200.48%], Affimed N.V[756%], Mesoblast [555.45%], Corbus [516.72%] Best Biotech Stocks This Week:
CytomX [222.64%], Deciphera [73.11%], Cue Biopharma[39.56%], Seres [30.91%], Poseida [30.52%], Exscientia [27.14%], Nektar [25%], AnaptysBio [23.9%], Janux [22.62%], Personalis [22.53%], Summit [21.76%] Best Biotech Stocks Daily:
CytomX [214.72%], Ventyx [24.63%], Summit [19.59%], Cabaletta Bio[16.58%], TG [16.25%], Bio-Techne [16.22%], Brainstorm Cell[15.10%], Wave Life[15.01%], Poseida [14.88%], Xencor [14.28%], Greenwich Life[13.93%]