
 Login Sign Up


| |||||
 |  | ||||

| 12Stocks.com Market Intelligence |
Best Financial Stocks
| In a hurry? Financial Stocks Lists: Performance Trends Table, Stock Charts
Sort Financial stocks: Daily, Weekly, Year-to-Date, Market Cap & Trends. Filter Financial stocks list by size:All Financial Large Mid-Range Small & MicroCap |
| 12Stocks.com Financial Stocks Performances & Trends Daily | |||||||||
|
|  The overall Smart Investing & Trading Score is 95 (0-bearish to 100-bullish) which puts Financial sector in short term bullish trend. The Smart Investing & Trading Score from previous trading session is 100 and a deterioration of trend continues.
| ||||||||
Here are the Smart Investing & Trading Scores of the most requested Financial stocks at 12Stocks.com (click stock name for detailed review):
|


| 12Stocks.com: Investing in Financial sector with Stocks | |
|
The following table helps investors and traders sort through current performance and trends (as measured by Smart Investing & Trading Score) of various
stocks in the Financial sector. Quick View: Move mouse or cursor over stock symbol (ticker) to view short-term Technical chart and over stock name to view long term chart. Click on  to add stock symbol to your watchlist and to add stock symbol to your watchlist and  to view watchlist. Click on any ticker or stock name for detailed market intelligence report for that stock. to view watchlist. Click on any ticker or stock name for detailed market intelligence report for that stock. |
12Stocks.com Performance of Stocks in Financial Sector
| Ticker | Stock Name | Watchlist | Category | Recent Price | Smart Investing & Trading Score | Change % | Weekly Change% |
| IPXXU | Inflection Point |   | SPAC | 10.50 | 31 | 0.00% | 0.00% |
| THCP | Thunder Bridge | | SPAC | 10.50 | 43 | -0.10% | 0.00% |
| SLAMU | Slam | | SPAC | 11.07 | 65 | 0.00% | 0.00% |
| AACT | Ares Acquisition | | SPAC | 10.62 | 51 | -0.05% | 0.00% |
| PJT | PJT Partners | | Asset Mgmt | 101.22 | 52 | 1.65% | -0.04% |
| SLMBP | SLM | | Credit Services | 76.91 | 41 | -0.14% | -0.04% |
| BYNO | byNordic Acquisition | | SPAC | 11.18 | 44 | 0.27% | -0.04% |
| KTF | DWS Municipal | | Closed-End Fund - Debt | 9.48 | 58 | -0.21% | -0.05% |
| SBXC | SilverBox Corp | | SPAC | 10.55 | 36 | 0.00% | -0.05% |
| CUBI | Customers Bancorp | | Regional Banks | 48.83 | 44 | 1.24% | -0.06% |
| OFG | OFG Bancorp | | Banks | 37.82 | 71 | -0.24% | -0.08% |
| BKN | BlackRock | | Closed-End Fund - Debt | 12.17 | 64 | 0.08% | -0.08% |
| CHY | Calamos Convertible | | Closed-End Fund - Debt | 11.13 | 23 | -0.09% | -0.09% |
| CSLM | Consilium Acquisition | | SPAC | 11.14 | 46 | 0.00% | -0.09% |
| IVCA | Investcorp India | | SPAC | 11.26 | 34 | 0.00% | -0.09% |
| EVN | Eaton Vance | | Closed-End Fund - Debt | 10.11 | 70 | 0.00% | -0.10% |
| VVR | Invesco Senior | | Closed-End Fund - Debt | 4.38 | 58 | -0.23% | -0.11% |
| CLDT | Chatham Lodging | | REIT | 9.02 | 22 | -0.44% | -0.11% |
| AFGE | American | | Insurance | 18.96 | 37 | 0.65% | -0.11% |
| MUI | BlackRock Muni | | Closed-End Fund - Debt | 12.21 | 76 | 0.00% | -0.12% |
| PFN | PIMCO ome | | Closed-End Fund - Debt | 7.35 | 65 | 0.00% | -0.12% |
| BME | BlackRock Health | | Closed-End Fund - Equity | 40.15 | 45 | 0.00% | -0.12% |
| TBNK | Territorial Bancorp | | Regional Banks | 8.49 | 64 | 0.12% | -0.12% |
| CPT | Camden Property | | REIT | 106.50 | 76 | -0.02% | -0.13% |
| MUC | BlackRock Muni | | Closed-End Fund - Debt | 10.84 | 33 | -0.46% | -0.13% |
| For chart view version of above stock list: Chart View ➞ 0 - 25 , 25 - 50 , 50 - 75 , 75 - 100 , 100 - 125 , 125 - 150 , 150 - 175 , 175 - 200 , 200 - 225 , 225 - 250 , 250 - 275 , 275 - 300 , 300 - 325 , 325 - 350 , 350 - 375 , 375 - 400 , 400 - 425 , 425 - 450 , 450 - 475 , 475 - 500 , 500 - 525 , 525 - 550 , 550 - 575 , 575 - 600 , 600 - 625 , 625 - 650 , 650 - 675 , 675 - 700 , 700 - 725 , 725 - 750 , 750 - 775 , 775 - 800 , 800 - 825 , 825 - 850 , 850 - 875 , 875 - 900 , 900 - 925 , 925 - 950 , 950 - 975 , 975 - 1000 , 1000 - 1025 , 1025 - 1050 , 1050 - 1075 , 1075 - 1100 , 1100 - 1125 , 1125 - 1150 , 1150 - 1175 , 1175 - 1200 , 1200 - 1225 | ||
 | Click To Change The Sort Order: By Market Cap or Company Size Performance: Year-to-date, Week and Day |  |
|
Get the most comprehensive stock market coverage daily at 12Stocks.com ➞ Best Stocks Today ➞ Best Stocks Weekly ➞ Best Stocks Year-to-Date ➞ Best Stocks Trends ➞  Best Stocks Today 12Stocks.com Best Nasdaq Stocks ➞ Best S&P 500 Stocks ➞ Best Tech Stocks ➞ Best Biotech Stocks ➞ |
| Detailed Overview of Financial Stocks |
| Financial Technical Overview, Leaders & Laggards, Top Financial ETF Funds & Detailed Financial Stocks List, Charts, Trends & More |
| Financial Sector: Technical Analysis, Trends & YTD Performance | |
| Financial sector is composed of stocks
from banks, brokers, insurance, REITs
and services subsectors. Financial sector, as represented by XLF, an exchange-traded fund [ETF] that holds basket of Financial stocks (e.g, Bank of America, Goldman Sachs) is up by 13.01% and is currently outperforming the overall market by 2.44% year-to-date. Below is a quick view of Technical charts and trends: |
|
 XLF Weekly Chart |
|
| Long Term Trend: Very Good | |
| Medium Term Trend: Very Good | |
 XLF Daily Chart |
|
| Short Term Trend: Very Good | |
| Overall Trend Score: 95 | |
| YTD Performance: 13.01% | |
| **Trend Scores & Views Are Only For Educational Purposes And Not For Investing | |
| 12Stocks.com: Top Performing Financial Sector Stocks | ||||||||||||||||||||||||||||||||||||||||||||||||
 The top performing Financial sector stocks year to date are
Now, more recently, over last week, the top performing Financial sector stocks on the move are


|
||||||||||||||||||||||||||||||||||||||||||||||||
| 12Stocks.com: Investing in Financial Sector using Exchange Traded Funds | |
|
The following table shows list of key exchange traded funds (ETF) that
help investors track Financial Index. For detailed view, check out our ETF Funds section of our website. Quick View: Move mouse or cursor over ETF symbol (ticker) to view short-term Technical chart and over ETF name to view long term chart. Click on ticker or stock name for detailed view. Click on to add stock symbol to your watchlist and to view watchlist. |
12Stocks.com List of ETFs that track Financial Index
| Ticker | ETF Name | Watchlist | Recent Price | Smart Investing & Trading Score | Change % | Week % | Year-to-date % |
| XLF | Financial | | 42.49 | 95 | 0.73 | 1.58 | 13.01% |
| IAI | Broker-Dealers & Secs | | 119.47 | 100 | 1.08 | 2.59 | 10.08% |
| IYF | Financials | | 96.85 | 95 | 0.43 | 1.73 | 13.39% |
| IYG | Financial Services | | 67.11 | 95 | 0.15 | 1.56 | 12.34% |
| KRE | Regional Banking | | 51.19 | 83 | 0.23 | 1.67 | -2.37% |
| IXG | Global Financials | | 88.72 | 88 | 0.21 | 1.41 | 12.91% |
| VFH | Financials | | 103.00 | 95 | 0.18 | 1.45 | 11.64% |
| KBE | Bank | | 47.93 | 83 | 0.44 | 1.25 | 4.15% |
| FAS | Financial Bull 3X | | 112.32 | 95 | 1.81 | 4.06 | 35.9% |
| FAZ | Financial Bear 3X | | 9.75 | 10 | -1.71 | -3.75 | -28.68% |
| UYG | Financials | | 68.54 | 100 | 1.23 | 2.77 | 24.17% |
| IAT | Regional Banks | | 43.42 | 76 | -0.26 | 1.02 | 3.78% |
| KIE | Insurance | | 51.83 | 100 | 0.88 | 1.09 | 14.62% |
| PSCF | SmallCap Financials | | 49.03 | 95 | 0.28 | 1.44 | -0.31% |
| EUFN | Europe Financials | | 24.13 | 95 | 0.67 | 2.51 | 15.12% |
| PGF | Financial Preferred | | 14.81 | 52 | -0.10 | 0.68 | 1.58% |
| 12Stocks.com: Charts, Trends, Fundamental Data and Performances of Financial Stocks | |
|
We now take in-depth look at all Financial stocks including charts, multi-period performances and overall trends (as measured by Smart Investing & Trading Score). One can sort Financial stocks (click link to choose) by Daily, Weekly and by Year-to-Date performances. Also, one can sort by size of the company or by market capitalization. |
| Select Your Default Chart Type: | |||||
| |||||
| Click on stock symbol or name for detailed view. Click on to add stock symbol to your watchlist and to view watchlist. Quick View: Move mouse or cursor over "Daily" to quickly view daily Technical stock chart and over "Weekly" to view weekly Technical stock chart. | |||||

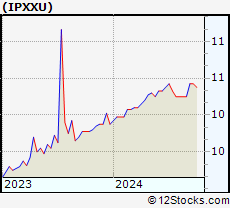 | IPXXU Inflection Point Acquisition Corp. II |
| Sector: Financials | |
| SubSector: SPAC | |
| MarketCap: 223 Millions | |
| Recent Price: 10.50 Smart Investing & Trading Score: 31 | |
| Day Percent Change: 0.00% Day Change: 0.00 | |
| Week Change: 0% Year-to-date Change: 1.5% | |
| IPXXU Links: Profile News Message Board | |
| Charts:- Daily , Weekly | |
| Add IPXXU to Watchlist: View: Get Complete IPXXU Trend Analysis ➞ | |
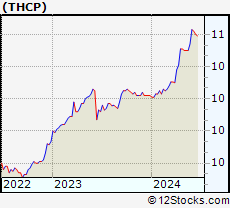 | THCP Thunder Bridge Capital Partners IV Inc. |
| Sector: Financials | |
| SubSector: SPAC | |
| MarketCap: 306 Millions | |
| Recent Price: 10.50 Smart Investing & Trading Score: 43 | |
| Day Percent Change: -0.10% Day Change: -0.01 | |
| Week Change: 0% Year-to-date Change: 2.7% | |
| THCP Links: Profile News Message Board | |
| Charts:- Daily , Weekly | |
| Add THCP to Watchlist: View: Get Complete THCP Trend Analysis ➞ | |
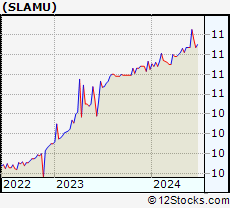 | SLAMU Slam Corp. |
| Sector: Financials | |
| SubSector: SPAC | |
| MarketCap: 422 Millions | |
| Recent Price: 11.07 Smart Investing & Trading Score: 65 | |
| Day Percent Change: 0.00% Day Change: 0.00 | |
| Week Change: 0% Year-to-date Change: 2.0% | |
| SLAMU Links: Profile News Message Board | |
| Charts:- Daily , Weekly | |
| Add SLAMU to Watchlist: View: Get Complete SLAMU Trend Analysis ➞ | |
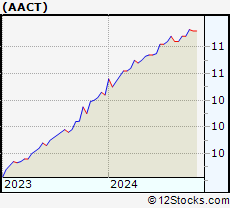 | AACT Ares Acquisition Corporation II |
| Sector: Financials | |
| SubSector: SPAC | |
| MarketCap: 639 Millions | |
| Recent Price: 10.62 Smart Investing & Trading Score: 51 | |
| Day Percent Change: -0.05% Day Change: -0.01 | |
| Week Change: 0% Year-to-date Change: 1.9% | |
| AACT Links: Profile News Message Board | |
| Charts:- Daily , Weekly | |
| Add AACT to Watchlist: View: Get Complete AACT Trend Analysis ➞ | |
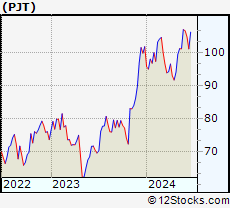 | PJT PJT Partners Inc. |
| Sector: Financials | |
| SubSector: Asset Management | |
| MarketCap: 1100.93 Millions | |
| Recent Price: 101.22 Smart Investing & Trading Score: 52 | |
| Day Percent Change: 1.65% Day Change: 1.64 | |
| Week Change: -0.04% Year-to-date Change: -0.6% | |
| PJT Links: Profile News Message Board | |
| Charts:- Daily , Weekly | |
| Add PJT to Watchlist: View: Get Complete PJT Trend Analysis ➞ | |
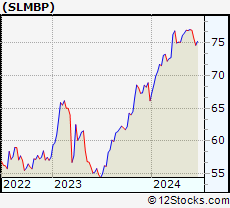 | SLMBP SLM Corporation |
| Sector: Financials | |
| SubSector: Credit Services | |
| MarketCap: 11675.8 Millions | |
| Recent Price: 76.91 Smart Investing & Trading Score: 41 | |
| Day Percent Change: -0.14% Day Change: -0.11 | |
| Week Change: -0.04% Year-to-date Change: 16.3% | |
| SLMBP Links: Profile News Message Board | |
| Charts:- Daily , Weekly | |
| Add SLMBP to Watchlist: View: Get Complete SLMBP Trend Analysis ➞ | |
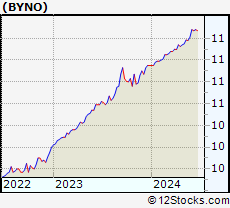 | BYNO byNordic Acquisition Corporation |
| Sector: Financials | |
| SubSector: SPAC | |
| MarketCap: 254 Millions | |
| Recent Price: 11.18 Smart Investing & Trading Score: 44 | |
| Day Percent Change: 0.27% Day Change: 0.03 | |
| Week Change: -0.04% Year-to-date Change: 2.1% | |
| BYNO Links: Profile News Message Board | |
| Charts:- Daily , Weekly | |
| Add BYNO to Watchlist: View: Get Complete BYNO Trend Analysis ➞ | |
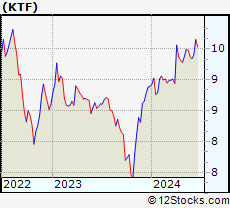 | KTF DWS Municipal Income Trust |
| Sector: Financials | |
| SubSector: Closed-End Fund - Debt | |
| MarketCap: 377.607 Millions | |
| Recent Price: 9.48 Smart Investing & Trading Score: 58 | |
| Day Percent Change: -0.21% Day Change: -0.02 | |
| Week Change: -0.05% Year-to-date Change: 6.6% | |
| KTF Links: Profile News Message Board | |
| Charts:- Daily , Weekly | |
| Add KTF to Watchlist: View: Get Complete KTF Trend Analysis ➞ | |
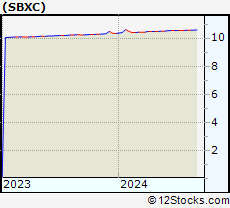 | SBXC SilverBox Corp III |
| Sector: Financials | |
| SubSector: SPAC | |
| MarketCap: 174 Millions | |
| Recent Price: 10.55 Smart Investing & Trading Score: 36 | |
| Day Percent Change: 0.00% Day Change: 0.00 | |
| Week Change: -0.05% Year-to-date Change: 2.0% | |
| SBXC Links: Profile News Message Board | |
| Charts:- Daily , Weekly | |
| Add SBXC to Watchlist: View: Get Complete SBXC Trend Analysis ➞ | |
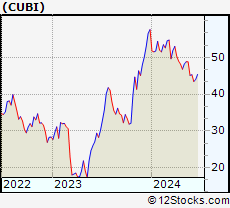 | CUBI Customers Bancorp, Inc. |
| Sector: Financials | |
| SubSector: Regional - Northeast Banks | |
| MarketCap: 385.399 Millions | |
| Recent Price: 48.83 Smart Investing & Trading Score: 44 | |
| Day Percent Change: 1.24% Day Change: 0.60 | |
| Week Change: -0.06% Year-to-date Change: -15.3% | |
| CUBI Links: Profile News Message Board | |
| Charts:- Daily , Weekly | |
| Add CUBI to Watchlist: View: Get Complete CUBI Trend Analysis ➞ | |
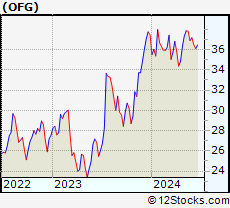 | OFG OFG Bancorp |
| Sector: Financials | |
| SubSector: Money Center Banks | |
| MarketCap: 537.599 Millions | |
| Recent Price: 37.82 Smart Investing & Trading Score: 71 | |
| Day Percent Change: -0.24% Day Change: -0.09 | |
| Week Change: -0.08% Year-to-date Change: 0.9% | |
| OFG Links: Profile News Message Board | |
| Charts:- Daily , Weekly | |
| Add OFG to Watchlist: View: Get Complete OFG Trend Analysis ➞ | |
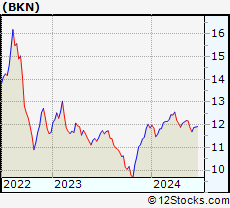 | BKN BlackRock Investment Quality Municipal Trust Inc. |
| Sector: Financials | |
| SubSector: Closed-End Fund - Debt | |
| MarketCap: 221.707 Millions | |
| Recent Price: 12.17 Smart Investing & Trading Score: 64 | |
| Day Percent Change: 0.08% Day Change: 0.01 | |
| Week Change: -0.08% Year-to-date Change: 2.6% | |
| BKN Links: Profile News Message Board | |
| Charts:- Daily , Weekly | |
| Add BKN to Watchlist: View: Get Complete BKN Trend Analysis ➞ | |
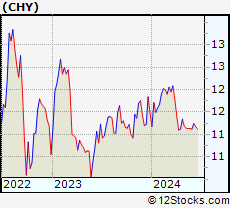 | CHY Calamos Convertible and High Income Fund |
| Sector: Financials | |
| SubSector: Closed-End Fund - Debt | |
| MarketCap: 561.607 Millions | |
| Recent Price: 11.13 Smart Investing & Trading Score: 23 | |
| Day Percent Change: -0.09% Day Change: -0.01 | |
| Week Change: -0.09% Year-to-date Change: -3.0% | |
| CHY Links: Profile News Message Board | |
| Charts:- Daily , Weekly | |
| Add CHY to Watchlist: View: Get Complete CHY Trend Analysis ➞ | |
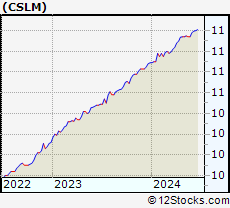 | CSLM Consilium Acquisition Corp I, Ltd. |
| Sector: Financials | |
| SubSector: SPAC | |
| MarketCap: 249 Millions | |
| Recent Price: 11.14 Smart Investing & Trading Score: 46 | |
| Day Percent Change: 0.00% Day Change: 0.00 | |
| Week Change: -0.09% Year-to-date Change: 2.3% | |
| CSLM Links: Profile News Message Board | |
| Charts:- Daily , Weekly | |
| Add CSLM to Watchlist: View: Get Complete CSLM Trend Analysis ➞ | |
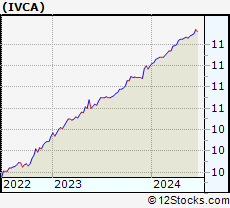 | IVCA Investcorp India Acquisition Corp |
| Sector: Financials | |
| SubSector: SPAC | |
| MarketCap: 345 Millions | |
| Recent Price: 11.26 Smart Investing & Trading Score: 34 | |
| Day Percent Change: 0.00% Day Change: 0.00 | |
| Week Change: -0.09% Year-to-date Change: 2.4% | |
| IVCA Links: Profile News Message Board | |
| Charts:- Daily , Weekly | |
| Add IVCA to Watchlist: View: Get Complete IVCA Trend Analysis ➞ | |
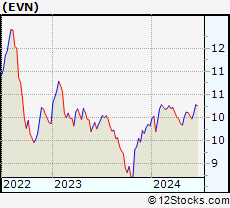 | EVN Eaton Vance Municipal Income Trust |
| Sector: Financials | |
| SubSector: Closed-End Fund - Debt | |
| MarketCap: 430.707 Millions | |
| Recent Price: 10.11 Smart Investing & Trading Score: 70 | |
| Day Percent Change: 0.00% Day Change: 0.00 | |
| Week Change: -0.1% Year-to-date Change: 3.0% | |
| EVN Links: Profile News Message Board | |
| Charts:- Daily , Weekly | |
| Add EVN to Watchlist: View: Get Complete EVN Trend Analysis ➞ | |
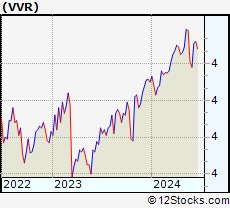 | VVR Invesco Senior Income Trust |
| Sector: Financials | |
| SubSector: Closed-End Fund - Debt | |
| MarketCap: 507.307 Millions | |
| Recent Price: 4.38 Smart Investing & Trading Score: 58 | |
| Day Percent Change: -0.23% Day Change: -0.01 | |
| Week Change: -0.11% Year-to-date Change: 6.8% | |
| VVR Links: Profile News Message Board | |
| Charts:- Daily , Weekly | |
| Add VVR to Watchlist: View: Get Complete VVR Trend Analysis ➞ | |
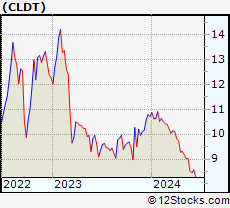 | CLDT Chatham Lodging Trust |
| Sector: Financials | |
| SubSector: REIT - Hotel/Motel | |
| MarketCap: 274.734 Millions | |
| Recent Price: 9.02 Smart Investing & Trading Score: 22 | |
| Day Percent Change: -0.44% Day Change: -0.04 | |
| Week Change: -0.11% Year-to-date Change: -15.9% | |
| CLDT Links: Profile News Message Board | |
| Charts:- Daily , Weekly | |
| Add CLDT to Watchlist: View: Get Complete CLDT Trend Analysis ➞ | |
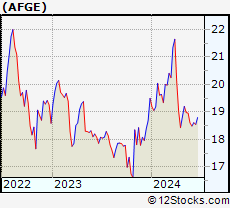 | AFGE American Financial Group, Inc. |
| Sector: Financials | |
| SubSector: Property & Casualty Insurance | |
| MarketCap: 2239.66 Millions | |
| Recent Price: 18.96 Smart Investing & Trading Score: 37 | |
| Day Percent Change: 0.65% Day Change: 0.12 | |
| Week Change: -0.11% Year-to-date Change: -2.8% | |
| AFGE Links: Profile News Message Board | |
| Charts:- Daily , Weekly | |
| Add AFGE to Watchlist: View: Get Complete AFGE Trend Analysis ➞ | |
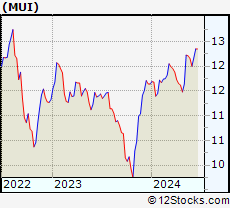 | MUI BlackRock Muni Intermediate Duration Fund, Inc. |
| Sector: Financials | |
| SubSector: Closed-End Fund - Debt | |
| MarketCap: 496.307 Millions | |
| Recent Price: 12.21 Smart Investing & Trading Score: 76 | |
| Day Percent Change: 0.00% Day Change: 0.00 | |
| Week Change: -0.12% Year-to-date Change: 4.9% | |
| MUI Links: Profile News Message Board | |
| Charts:- Daily , Weekly | |
| Add MUI to Watchlist: View: Get Complete MUI Trend Analysis ➞ | |
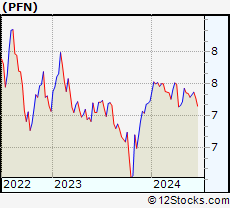 | PFN PIMCO Income Strategy Fund II |
| Sector: Financials | |
| SubSector: Closed-End Fund - Debt | |
| MarketCap: 469.507 Millions | |
| Recent Price: 7.35 Smart Investing & Trading Score: 65 | |
| Day Percent Change: 0.00% Day Change: 0.00 | |
| Week Change: -0.12% Year-to-date Change: 1.7% | |
| PFN Links: Profile News Message Board | |
| Charts:- Daily , Weekly | |
| Add PFN to Watchlist: View: Get Complete PFN Trend Analysis ➞ | |
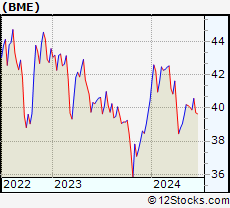 | BME BlackRock Health Sciences Trust |
| Sector: Financials | |
| SubSector: Closed-End Fund - Equity | |
| MarketCap: 325.547 Millions | |
| Recent Price: 40.15 Smart Investing & Trading Score: 45 | |
| Day Percent Change: 0.00% Day Change: 0.00 | |
| Week Change: -0.12% Year-to-date Change: -0.8% | |
| BME Links: Profile News Message Board | |
| Charts:- Daily , Weekly | |
| Add BME to Watchlist: View: Get Complete BME Trend Analysis ➞ | |
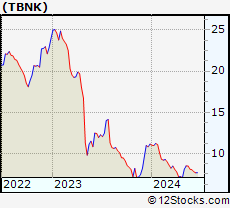 | TBNK Territorial Bancorp Inc. |
| Sector: Financials | |
| SubSector: Regional - Pacific Banks | |
| MarketCap: 220.029 Millions | |
| Recent Price: 8.49 Smart Investing & Trading Score: 64 | |
| Day Percent Change: 0.12% Day Change: 0.01 | |
| Week Change: -0.12% Year-to-date Change: -23.9% | |
| TBNK Links: Profile News Message Board | |
| Charts:- Daily , Weekly | |
| Add TBNK to Watchlist: View: Get Complete TBNK Trend Analysis ➞ | |
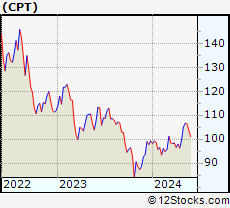 | CPT Camden Property Trust |
| Sector: Financials | |
| SubSector: REIT - Residential | |
| MarketCap: 7535.21 Millions | |
| Recent Price: 106.50 Smart Investing & Trading Score: 76 | |
| Day Percent Change: -0.02% Day Change: -0.02 | |
| Week Change: -0.13% Year-to-date Change: 7.3% | |
| CPT Links: Profile News Message Board | |
| Charts:- Daily , Weekly | |
| Add CPT to Watchlist: View: Get Complete CPT Trend Analysis ➞ | |
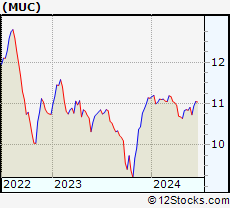 | MUC BlackRock MuniHoldings California Quality Fund, Inc. |
| Sector: Financials | |
| SubSector: Closed-End Fund - Debt | |
| MarketCap: 498.507 Millions | |
| Recent Price: 10.84 Smart Investing & Trading Score: 33 | |
| Day Percent Change: -0.46% Day Change: -0.05 | |
| Week Change: -0.13% Year-to-date Change: -2.6% | |
| MUC Links: Profile News Message Board | |
| Charts:- Daily , Weekly | |
| Add MUC to Watchlist: View: Get Complete MUC Trend Analysis ➞ | |
| For tabular summary view of above stock list: Summary View ➞ 0 - 25 , 25 - 50 , 50 - 75 , 75 - 100 , 100 - 125 , 125 - 150 , 150 - 175 , 175 - 200 , 200 - 225 , 225 - 250 , 250 - 275 , 275 - 300 , 300 - 325 , 325 - 350 , 350 - 375 , 375 - 400 , 400 - 425 , 425 - 450 , 450 - 475 , 475 - 500 , 500 - 525 , 525 - 550 , 550 - 575 , 575 - 600 , 600 - 625 , 625 - 650 , 650 - 675 , 675 - 700 , 700 - 725 , 725 - 750 , 750 - 775 , 775 - 800 , 800 - 825 , 825 - 850 , 850 - 875 , 875 - 900 , 900 - 925 , 925 - 950 , 950 - 975 , 975 - 1000 , 1000 - 1025 , 1025 - 1050 , 1050 - 1075 , 1075 - 1100 , 1100 - 1125 , 1125 - 1150 , 1150 - 1175 , 1175 - 1200 , 1200 - 1225 | ||
| Click To Change The Sort Order: By Market Cap or Company Size Performance: Year-to-date, Week and Day | |
| Select Chart Type: | ||
|
Best Stocks Today 12Stocks.com |
© 2024 12Stocks.com Terms & Conditions Privacy Contact Us
All Information Provided Only For Education And Not To Be Used For Investing or Trading. See Terms & Conditions


One More Thing ... Get Best Stocks Delivered Daily!
Never Ever Miss A Move With Our Top Ten Stocks Lists
Find Best Stocks In Any Market - Bull or Bear Market
Take A Peek At Our Top Ten Stocks Lists: Daily, Weekly, Year-to-Date & Top Trends
Find Best Stocks In Any Market - Bull or Bear Market
Take A Peek At Our Top Ten Stocks Lists: Daily, Weekly, Year-to-Date & Top Trends
Financial Stocks With Best Up Trends [0-bearish to 100-bullish]: Fangdd Network[100], Xinyuan Real[100], MicroSectors Gold[100], Sprott Physical[100], Citizens & Northern[100], Sumitomo Mitsui[100], First Community[100], Chubb [100], Angel Oak[100], Sprott Physical[100], Iris Energy[100]
Best Financial Stocks Year-to-Date:
Root [526.36%], Fangdd Network[149.63%], Banco Macro[126.41%], Grupo Financiero[112.4%], Banco BBVA[110.66%], SelectQuote [110.22%], Gladstone Capital[106.92%], EverQuote [98.2%], Hippo [92.54%], Grupo Supervielle[86.95%], Vista Oil[60.93%] Best Financial Stocks This Week:
Fangdd Network[360.27%], Xinyuan Real[53.28%], Iris Energy[25.68%], Fathom [25.35%], Huize Holding[21.83%], First Foundation[18.98%], Trupanion [17.21%], Bridge [16.67%], MicroSectors Gold[15.19%], KE [13.86%], Douglas Elliman[13.56%] Best Financial Stocks Daily:
Fangdd Network[321.26%], Xinyuan Real[39.49%], MicroSectors Gold[12.02%], Fathom [9.88%], Citizens [8.53%], Hywin [8.28%], Root [6.10%], First Foundation[6.09%], Sprott Physical[6.09%], Freedom Holding[5.02%], NexGen Energy[4.99%]