
 Login Sign Up


| |||||
 |  | ||||

| 12Stocks.com Market Intelligence |
Best Financial Stocks
| In a hurry? Financial Stocks Lists: Performance Trends Table, Stock Charts
Sort Financial stocks: Daily, Weekly, Year-to-Date, Market Cap & Trends. Filter Financial stocks list by size:All Financial Large Mid-Range Small & MicroCap |
| 12Stocks.com Financial Stocks Performances & Trends Daily | |||||||||
|
|  The overall Smart Investing & Trading Score is 95 (0-bearish to 100-bullish) which puts Financial sector in short term bullish trend. The Smart Investing & Trading Score from previous trading session is 100 and a deterioration of trend continues.
| ||||||||
Here are the Smart Investing & Trading Scores of the most requested Financial stocks at 12Stocks.com (click stock name for detailed review):
|


| 12Stocks.com: Investing in Financial sector with Stocks | |
|
The following table helps investors and traders sort through current performance and trends (as measured by Smart Investing & Trading Score) of various
stocks in the Financial sector. Quick View: Move mouse or cursor over stock symbol (ticker) to view short-term Technical chart and over stock name to view long term chart. Click on  to add stock symbol to your watchlist and to add stock symbol to your watchlist and  to view watchlist. Click on any ticker or stock name for detailed market intelligence report for that stock. to view watchlist. Click on any ticker or stock name for detailed market intelligence report for that stock. |
12Stocks.com Performance of Stocks in Financial Sector
| Ticker | Stock Name | Watchlist | Category | Recent Price | Smart Investing & Trading Score | Change % | Weekly Change% |
| FHN | First Horizon |   | Regional Banks | 16.01 | 76 | 0.63% | 1.39% |
| PFG | Pripal | | Life Insurance | 85.13 | 88 | 1.01% | 1.39% |
| BOKF | BOK | | Regional - Southwest Banks | 95.68 | 76 | 0.51% | 1.39% |
| NEA | Nuveen AMT-Free | | Investments | 10.98 | 82 | 0.09% | 1.39% |
| PFO | Flaherty & Crumrine Preferred ome Opportunity Fund | | Closed-End Fund - Debt | 8.38 | 90 | 0.18% | 1.39% |
| PAGS | PagSeguro Digital | | Credit Services | 12.76 | 33 | -0.16% | 1.39% |
| KRNL | Kernel | | SPAC | 10.95 | 86 | 0.27% | 1.39% |
| FFA | First Trust | | Closed-End Fund - Equity | 19.09 | 83 | -0.31% | 1.38% |
| MBINN | Merchants Bancorp | | Banks - Regional | 20.50 | 64 | 0.69% | 1.38% |
| ALEX | Alexander & Baldwin | | Real Estatet | 17.00 | 83 | -0.76% | 1.37% |
| CPF | Central Pacific | | Regional Banks | 21.48 | 90 | 0.42% | 1.37% |
| ETB | Eaton Vance | | Closed-End Fund - Equity | 13.72 | 76 | -0.07% | 1.37% |
| SBSI | Southside Bancshares | | Regional Banks | 28.35 | 74 | 0.93% | 1.36% |
| MHI | Pioneer Municipal | | Closed-End Fund - Debt | 8.97 | 95 | 0.22% | 1.36% |
| ETO | Eaton Vance | | Closed-End Fund - Equity | 25.37 | 76 | -0.04% | 1.36% |
| RMAX | RE/MAX | | Property Mgmt | 9.70 | 83 | -2.02% | 1.36% |
| EVE | EVe Mobility | | SPAC | 11.15 | 100 | 1.00% | 1.36% |
| AXS | AXIS Capital | | Insurance | 71.48 | 90 | 1.17% | 1.35% |
| IBOC | Bancshares | | Regional - Southwest Banks | 60.69 | 83 | 0.28% | 1.35% |
| NBTB | NBT Bancorp | | Regional Banks | 38.25 | 95 | 1.14% | 1.35% |
| PDT | John Hancock | | Closed-End Fund - Debt | 11.75 | 76 | -0.42% | 1.35% |
| CBOE | Cboe Global | | Investments | 183.51 | 57 | 0.80% | 1.35% |
| MMD | MainStay MacKay | | Closed-End Fund - Debt | 16.50 | 87 | 0.86% | 1.35% |
| BGX | Blackstone / | | Closed-End Fund - Debt | 12.73 | 90 | -0.08% | 1.35% |
| PCN | PIMCO Corporate | | Closed-End Fund - Debt | 12.81 | 50 | 0.16% | 1.34% |
| For chart view version of above stock list: Chart View ➞ 0 - 25 , 25 - 50 , 50 - 75 , 75 - 100 , 100 - 125 , 125 - 150 , 150 - 175 , 175 - 200 , 200 - 225 , 225 - 250 , 250 - 275 , 275 - 300 , 300 - 325 , 325 - 350 , 350 - 375 , 375 - 400 , 400 - 425 , 425 - 450 , 450 - 475 , 475 - 500 , 500 - 525 , 525 - 550 , 550 - 575 , 575 - 600 , 600 - 625 , 625 - 650 , 650 - 675 , 675 - 700 , 700 - 725 , 725 - 750 , 750 - 775 , 775 - 800 , 800 - 825 , 825 - 850 , 850 - 875 , 875 - 900 , 900 - 925 , 925 - 950 , 950 - 975 , 975 - 1000 , 1000 - 1025 , 1025 - 1050 , 1050 - 1075 , 1075 - 1100 , 1100 - 1125 , 1125 - 1150 , 1150 - 1175 , 1175 - 1200 , 1200 - 1225 | ||
 | Click To Change The Sort Order: By Market Cap or Company Size Performance: Year-to-date, Week and Day |  |
|
Get the most comprehensive stock market coverage daily at 12Stocks.com ➞ Best Stocks Today ➞ Best Stocks Weekly ➞ Best Stocks Year-to-Date ➞ Best Stocks Trends ➞  Best Stocks Today 12Stocks.com Best Nasdaq Stocks ➞ Best S&P 500 Stocks ➞ Best Tech Stocks ➞ Best Biotech Stocks ➞ |
| Detailed Overview of Financial Stocks |
| Financial Technical Overview, Leaders & Laggards, Top Financial ETF Funds & Detailed Financial Stocks List, Charts, Trends & More |
| Financial Sector: Technical Analysis, Trends & YTD Performance | |
| Financial sector is composed of stocks
from banks, brokers, insurance, REITs
and services subsectors. Financial sector, as represented by XLF, an exchange-traded fund [ETF] that holds basket of Financial stocks (e.g, Bank of America, Goldman Sachs) is up by 13.01% and is currently outperforming the overall market by 2.44% year-to-date. Below is a quick view of Technical charts and trends: |
|
 XLF Weekly Chart |
|
| Long Term Trend: Very Good | |
| Medium Term Trend: Very Good | |
 XLF Daily Chart |
|
| Short Term Trend: Very Good | |
| Overall Trend Score: 95 | |
| YTD Performance: 13.01% | |
| **Trend Scores & Views Are Only For Educational Purposes And Not For Investing | |
| 12Stocks.com: Top Performing Financial Sector Stocks | ||||||||||||||||||||||||||||||||||||||||||||||||
 The top performing Financial sector stocks year to date are
Now, more recently, over last week, the top performing Financial sector stocks on the move are


|
||||||||||||||||||||||||||||||||||||||||||||||||
| 12Stocks.com: Investing in Financial Sector using Exchange Traded Funds | |
|
The following table shows list of key exchange traded funds (ETF) that
help investors track Financial Index. For detailed view, check out our ETF Funds section of our website. Quick View: Move mouse or cursor over ETF symbol (ticker) to view short-term Technical chart and over ETF name to view long term chart. Click on ticker or stock name for detailed view. Click on to add stock symbol to your watchlist and to view watchlist. |
12Stocks.com List of ETFs that track Financial Index
| Ticker | ETF Name | Watchlist | Recent Price | Smart Investing & Trading Score | Change % | Week % | Year-to-date % |
| XLF | Financial | | 42.49 | 95 | 0.73 | 1.58 | 13.01% |
| IAI | Broker-Dealers & Secs | | 119.47 | 100 | 1.08 | 2.59 | 10.08% |
| IYF | Financials | | 96.85 | 95 | 0.43 | 1.73 | 13.39% |
| IYG | Financial Services | | 67.11 | 95 | 0.15 | 1.56 | 12.34% |
| KRE | Regional Banking | | 51.19 | 83 | 0.23 | 1.67 | -2.37% |
| IXG | Global Financials | | 88.72 | 88 | 0.21 | 1.41 | 12.91% |
| VFH | Financials | | 103.00 | 95 | 0.18 | 1.45 | 11.64% |
| KBE | Bank | | 47.93 | 83 | 0.44 | 1.25 | 4.15% |
| FAS | Financial Bull 3X | | 112.32 | 95 | 1.81 | 4.06 | 35.9% |
| FAZ | Financial Bear 3X | | 9.75 | 10 | -1.71 | -3.75 | -28.68% |
| UYG | Financials | | 68.54 | 100 | 1.23 | 2.77 | 24.17% |
| IAT | Regional Banks | | 43.42 | 76 | -0.26 | 1.02 | 3.78% |
| KIE | Insurance | | 51.83 | 100 | 0.88 | 1.09 | 14.62% |
| PSCF | SmallCap Financials | | 49.03 | 95 | 0.28 | 1.44 | -0.31% |
| EUFN | Europe Financials | | 24.13 | 95 | 0.67 | 2.51 | 15.12% |
| PGF | Financial Preferred | | 14.81 | 52 | -0.10 | 0.68 | 1.58% |
| 12Stocks.com: Charts, Trends, Fundamental Data and Performances of Financial Stocks | |
|
We now take in-depth look at all Financial stocks including charts, multi-period performances and overall trends (as measured by Smart Investing & Trading Score). One can sort Financial stocks (click link to choose) by Daily, Weekly and by Year-to-Date performances. Also, one can sort by size of the company or by market capitalization. |
| Select Your Default Chart Type: | |||||
| |||||
| Click on stock symbol or name for detailed view. Click on to add stock symbol to your watchlist and to view watchlist. Quick View: Move mouse or cursor over "Daily" to quickly view daily Technical stock chart and over "Weekly" to view weekly Technical stock chart. | |||||

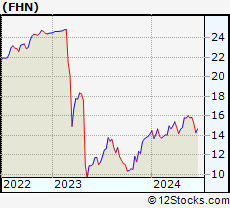 | FHN First Horizon National Corporation |
| Sector: Financials | |
| SubSector: Regional - Southeast Banks | |
| MarketCap: 2661.05 Millions | |
| Recent Price: 16.01 Smart Investing & Trading Score: 76 | |
| Day Percent Change: 0.63% Day Change: 0.10 | |
| Week Change: 1.39% Year-to-date Change: 13.1% | |
| FHN Links: Profile News Message Board | |
| Charts:- Daily , Weekly | |
| Add FHN to Watchlist: View: Get Complete FHN Trend Analysis ➞ | |
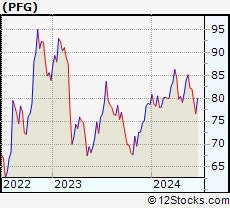 | PFG Principal Financial Group, Inc. |
| Sector: Financials | |
| SubSector: Life Insurance | |
| MarketCap: 8178.86 Millions | |
| Recent Price: 85.13 Smart Investing & Trading Score: 88 | |
| Day Percent Change: 1.01% Day Change: 0.85 | |
| Week Change: 1.39% Year-to-date Change: 8.2% | |
| PFG Links: Profile News Message Board | |
| Charts:- Daily , Weekly | |
| Add PFG to Watchlist: View: Get Complete PFG Trend Analysis ➞ | |
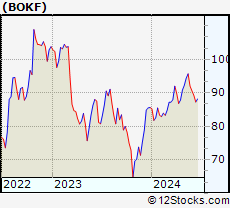 | BOKF BOK Financial Corporation |
| Sector: Financials | |
| SubSector: Regional - Southwest Banks | |
| MarketCap: 2945.35 Millions | |
| Recent Price: 95.68 Smart Investing & Trading Score: 76 | |
| Day Percent Change: 0.51% Day Change: 0.49 | |
| Week Change: 1.39% Year-to-date Change: 11.7% | |
| BOKF Links: Profile News Message Board | |
| Charts:- Daily , Weekly | |
| Add BOKF to Watchlist: View: Get Complete BOKF Trend Analysis ➞ | |
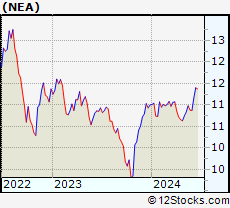 | NEA Nuveen AMT-Free Quality Municipal Income Fund |
| Sector: Financials | |
| SubSector: Diversified Investments | |
| MarketCap: 3197.3 Millions | |
| Recent Price: 10.98 Smart Investing & Trading Score: 82 | |
| Day Percent Change: 0.09% Day Change: 0.01 | |
| Week Change: 1.39% Year-to-date Change: -0.2% | |
| NEA Links: Profile News Message Board | |
| Charts:- Daily , Weekly | |
| Add NEA to Watchlist: View: Get Complete NEA Trend Analysis ➞ | |
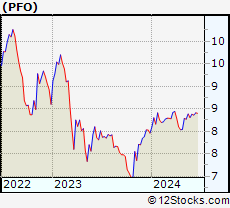 | PFO Flaherty & Crumrine Preferred Income Opportunity Fund Inc. |
| Sector: Financials | |
| SubSector: Closed-End Fund - Debt | |
| MarketCap: 106.107 Millions | |
| Recent Price: 8.38 Smart Investing & Trading Score: 90 | |
| Day Percent Change: 0.18% Day Change: 0.02 | |
| Week Change: 1.39% Year-to-date Change: 5.3% | |
| PFO Links: Profile News Message Board | |
| Charts:- Daily , Weekly | |
| Add PFO to Watchlist: View: Get Complete PFO Trend Analysis ➞ | |
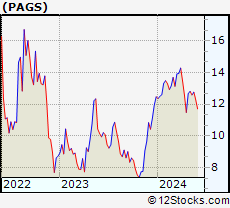 | PAGS PagSeguro Digital Ltd. |
| Sector: Financials | |
| SubSector: Credit Services | |
| MarketCap: 6500.78 Millions | |
| Recent Price: 12.76 Smart Investing & Trading Score: 33 | |
| Day Percent Change: -0.16% Day Change: -0.02 | |
| Week Change: 1.39% Year-to-date Change: 2.3% | |
| PAGS Links: Profile News Message Board | |
| Charts:- Daily , Weekly | |
| Add PAGS to Watchlist: View: Get Complete PAGS Trend Analysis ➞ | |
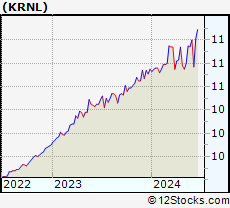 | KRNL Kernel Group Holdings, Inc. |
| Sector: Financials | |
| SubSector: SPAC | |
| MarketCap: 158 Millions | |
| Recent Price: 10.95 Smart Investing & Trading Score: 86 | |
| Day Percent Change: 0.27% Day Change: 0.03 | |
| Week Change: 1.39% Year-to-date Change: 1.9% | |
| KRNL Links: Profile News Message Board | |
| Charts:- Daily , Weekly | |
| Add KRNL to Watchlist: View: Get Complete KRNL Trend Analysis ➞ | |
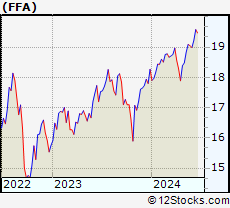 | FFA First Trust Enhanced Equity Income Fund |
| Sector: Financials | |
| SubSector: Closed-End Fund - Equity | |
| MarketCap: 206.247 Millions | |
| Recent Price: 19.09 Smart Investing & Trading Score: 83 | |
| Day Percent Change: -0.31% Day Change: -0.06 | |
| Week Change: 1.38% Year-to-date Change: 4.5% | |
| FFA Links: Profile News Message Board | |
| Charts:- Daily , Weekly | |
| Add FFA to Watchlist: View: Get Complete FFA Trend Analysis ➞ | |
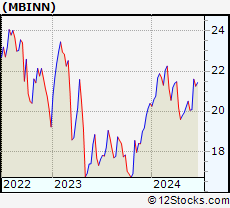 | MBINN Merchants Bancorp |
| Sector: Financials | |
| SubSector: Banks - Regional | |
| MarketCap: 1110 Millions | |
| Recent Price: 20.50 Smart Investing & Trading Score: 64 | |
| Day Percent Change: 0.69% Day Change: 0.14 | |
| Week Change: 1.38% Year-to-date Change: 0.5% | |
| MBINN Links: Profile News Message Board | |
| Charts:- Daily , Weekly | |
| Add MBINN to Watchlist: View: Get Complete MBINN Trend Analysis ➞ | |
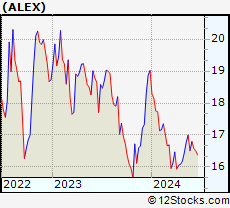 | ALEX Alexander & Baldwin, Inc. |
| Sector: Financials | |
| SubSector: Real Estate Development | |
| MarketCap: 751.419 Millions | |
| Recent Price: 17.00 Smart Investing & Trading Score: 83 | |
| Day Percent Change: -0.76% Day Change: -0.13 | |
| Week Change: 1.37% Year-to-date Change: -10.6% | |
| ALEX Links: Profile News Message Board | |
| Charts:- Daily , Weekly | |
| Add ALEX to Watchlist: View: Get Complete ALEX Trend Analysis ➞ | |
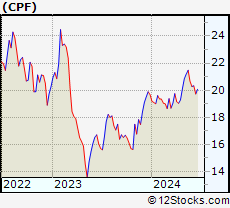 | CPF Central Pacific Financial Corp. |
| Sector: Financials | |
| SubSector: Regional - Pacific Banks | |
| MarketCap: 407.429 Millions | |
| Recent Price: 21.48 Smart Investing & Trading Score: 90 | |
| Day Percent Change: 0.42% Day Change: 0.09 | |
| Week Change: 1.37% Year-to-date Change: 9.2% | |
| CPF Links: Profile News Message Board | |
| Charts:- Daily , Weekly | |
| Add CPF to Watchlist: View: Get Complete CPF Trend Analysis ➞ | |
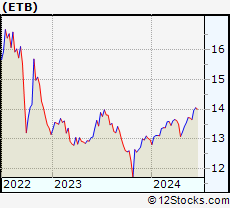 | ETB Eaton Vance Tax-Managed Buy-Write Income Fund |
| Sector: Financials | |
| SubSector: Closed-End Fund - Equity | |
| MarketCap: 267.647 Millions | |
| Recent Price: 13.72 Smart Investing & Trading Score: 76 | |
| Day Percent Change: -0.07% Day Change: -0.01 | |
| Week Change: 1.37% Year-to-date Change: 5.7% | |
| ETB Links: Profile News Message Board | |
| Charts:- Daily , Weekly | |
| Add ETB to Watchlist: View: Get Complete ETB Trend Analysis ➞ | |
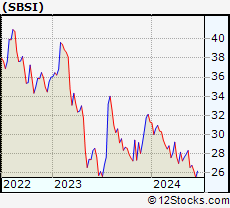 | SBSI Southside Bancshares, Inc. |
| Sector: Financials | |
| SubSector: Regional - Mid-Atlantic Banks | |
| MarketCap: 971.259 Millions | |
| Recent Price: 28.35 Smart Investing & Trading Score: 74 | |
| Day Percent Change: 0.93% Day Change: 0.26 | |
| Week Change: 1.36% Year-to-date Change: -9.5% | |
| SBSI Links: Profile News Message Board | |
| Charts:- Daily , Weekly | |
| Add SBSI to Watchlist: View: Get Complete SBSI Trend Analysis ➞ | |
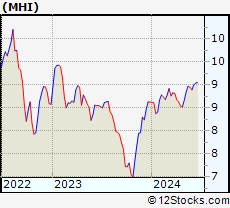 | MHI Pioneer Municipal High Income Trust |
| Sector: Financials | |
| SubSector: Closed-End Fund - Debt | |
| MarketCap: 224.507 Millions | |
| Recent Price: 8.97 Smart Investing & Trading Score: 95 | |
| Day Percent Change: 0.22% Day Change: 0.02 | |
| Week Change: 1.36% Year-to-date Change: 3.9% | |
| MHI Links: Profile News Message Board | |
| Charts:- Daily , Weekly | |
| Add MHI to Watchlist: View: Get Complete MHI Trend Analysis ➞ | |
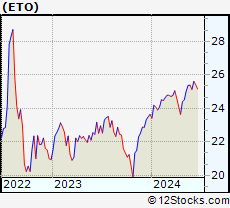 | ETO Eaton Vance Tax-Advantaged Global Dividend Opportunities Fund |
| Sector: Financials | |
| SubSector: Closed-End Fund - Equity | |
| MarketCap: 234.147 Millions | |
| Recent Price: 25.37 Smart Investing & Trading Score: 76 | |
| Day Percent Change: -0.04% Day Change: -0.01 | |
| Week Change: 1.36% Year-to-date Change: 7.3% | |
| ETO Links: Profile News Message Board | |
| Charts:- Daily , Weekly | |
| Add ETO to Watchlist: View: Get Complete ETO Trend Analysis ➞ | |
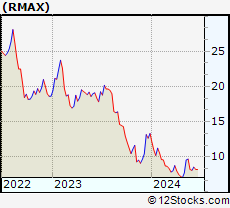 | RMAX RE/MAX Holdings, Inc. |
| Sector: Financials | |
| SubSector: Property Management | |
| MarketCap: 334.742 Millions | |
| Recent Price: 9.70 Smart Investing & Trading Score: 83 | |
| Day Percent Change: -2.02% Day Change: -0.20 | |
| Week Change: 1.36% Year-to-date Change: -27.2% | |
| RMAX Links: Profile News Message Board | |
| Charts:- Daily , Weekly | |
| Add RMAX to Watchlist: View: Get Complete RMAX Trend Analysis ➞ | |
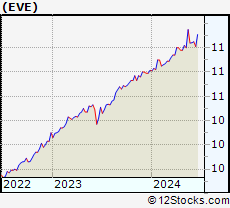 | EVE EVe Mobility Acquisition Corp |
| Sector: Financials | |
| SubSector: SPAC | |
| MarketCap: 164 Millions | |
| Recent Price: 11.15 Smart Investing & Trading Score: 100 | |
| Day Percent Change: 1.00% Day Change: 0.11 | |
| Week Change: 1.36% Year-to-date Change: 3.1% | |
| EVE Links: Profile News Message Board | |
| Charts:- Daily , Weekly | |
| Add EVE to Watchlist: View: Get Complete EVE Trend Analysis ➞ | |
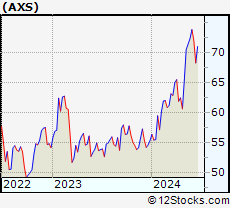 | AXS AXIS Capital Holdings Limited |
| Sector: Financials | |
| SubSector: Property & Casualty Insurance | |
| MarketCap: 3709.12 Millions | |
| Recent Price: 71.48 Smart Investing & Trading Score: 90 | |
| Day Percent Change: 1.17% Day Change: 0.83 | |
| Week Change: 1.35% Year-to-date Change: 29.1% | |
| AXS Links: Profile News Message Board | |
| Charts:- Daily , Weekly | |
| Add AXS to Watchlist: View: Get Complete AXS Trend Analysis ➞ | |
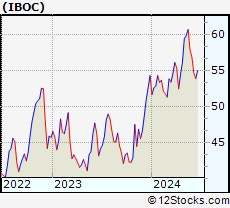 | IBOC International Bancshares Corporation |
| Sector: Financials | |
| SubSector: Regional - Southwest Banks | |
| MarketCap: 1159.45 Millions | |
| Recent Price: 60.69 Smart Investing & Trading Score: 83 | |
| Day Percent Change: 0.28% Day Change: 0.17 | |
| Week Change: 1.35% Year-to-date Change: 11.7% | |
| IBOC Links: Profile News Message Board | |
| Charts:- Daily , Weekly | |
| Add IBOC to Watchlist: View: Get Complete IBOC Trend Analysis ➞ | |
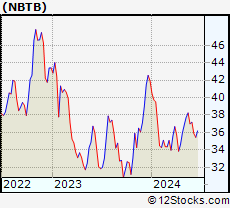 | NBTB NBT Bancorp Inc. |
| Sector: Financials | |
| SubSector: Regional - Northeast Banks | |
| MarketCap: 1451.89 Millions | |
| Recent Price: 38.25 Smart Investing & Trading Score: 95 | |
| Day Percent Change: 1.14% Day Change: 0.43 | |
| Week Change: 1.35% Year-to-date Change: -8.7% | |
| NBTB Links: Profile News Message Board | |
| Charts:- Daily , Weekly | |
| Add NBTB to Watchlist: View: Get Complete NBTB Trend Analysis ➞ | |
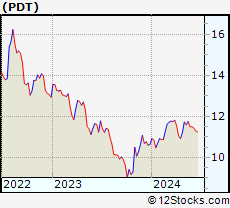 | PDT John Hancock Premium Dividend Fund |
| Sector: Financials | |
| SubSector: Closed-End Fund - Debt | |
| MarketCap: 404.207 Millions | |
| Recent Price: 11.75 Smart Investing & Trading Score: 76 | |
| Day Percent Change: -0.42% Day Change: -0.05 | |
| Week Change: 1.35% Year-to-date Change: 10.3% | |
| PDT Links: Profile News Message Board | |
| Charts:- Daily , Weekly | |
| Add PDT to Watchlist: View: Get Complete PDT Trend Analysis ➞ | |
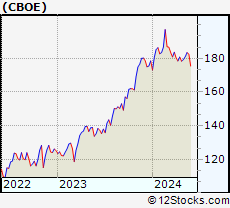 | CBOE Cboe Global Markets, Inc. |
| Sector: Financials | |
| SubSector: Diversified Investments | |
| MarketCap: 8834.5 Millions | |
| Recent Price: 183.51 Smart Investing & Trading Score: 57 | |
| Day Percent Change: 0.80% Day Change: 1.45 | |
| Week Change: 1.35% Year-to-date Change: 2.8% | |
| CBOE Links: Profile News Message Board | |
| Charts:- Daily , Weekly | |
| Add CBOE to Watchlist: View: Get Complete CBOE Trend Analysis ➞ | |
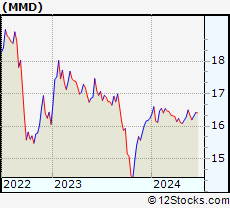 | MMD MainStay MacKay DefinedTerm Municipal Opportunities Fund |
| Sector: Financials | |
| SubSector: Closed-End Fund - Debt | |
| MarketCap: 527.107 Millions | |
| Recent Price: 16.50 Smart Investing & Trading Score: 87 | |
| Day Percent Change: 0.86% Day Change: 0.14 | |
| Week Change: 1.35% Year-to-date Change: 1.5% | |
| MMD Links: Profile News Message Board | |
| Charts:- Daily , Weekly | |
| Add MMD to Watchlist: View: Get Complete MMD Trend Analysis ➞ | |
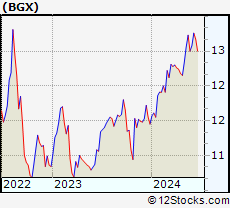 | BGX Blackstone / GSO Long-Short Credit Income Fund |
| Sector: Financials | |
| SubSector: Closed-End Fund - Debt | |
| MarketCap: 135.407 Millions | |
| Recent Price: 12.73 Smart Investing & Trading Score: 90 | |
| Day Percent Change: -0.08% Day Change: -0.01 | |
| Week Change: 1.35% Year-to-date Change: 11.2% | |
| BGX Links: Profile News Message Board | |
| Charts:- Daily , Weekly | |
| Add BGX to Watchlist: View: Get Complete BGX Trend Analysis ➞ | |
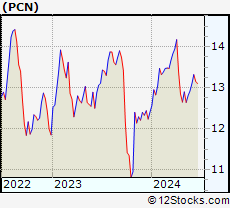 | PCN PIMCO Corporate & Income Strategy Fund |
| Sector: Financials | |
| SubSector: Closed-End Fund - Debt | |
| MarketCap: 442.607 Millions | |
| Recent Price: 12.81 Smart Investing & Trading Score: 50 | |
| Day Percent Change: 0.16% Day Change: 0.02 | |
| Week Change: 1.34% Year-to-date Change: 3.2% | |
| PCN Links: Profile News Message Board | |
| Charts:- Daily , Weekly | |
| Add PCN to Watchlist: View: Get Complete PCN Trend Analysis ➞ | |
| For tabular summary view of above stock list: Summary View ➞ 0 - 25 , 25 - 50 , 50 - 75 , 75 - 100 , 100 - 125 , 125 - 150 , 150 - 175 , 175 - 200 , 200 - 225 , 225 - 250 , 250 - 275 , 275 - 300 , 300 - 325 , 325 - 350 , 350 - 375 , 375 - 400 , 400 - 425 , 425 - 450 , 450 - 475 , 475 - 500 , 500 - 525 , 525 - 550 , 550 - 575 , 575 - 600 , 600 - 625 , 625 - 650 , 650 - 675 , 675 - 700 , 700 - 725 , 725 - 750 , 750 - 775 , 775 - 800 , 800 - 825 , 825 - 850 , 850 - 875 , 875 - 900 , 900 - 925 , 925 - 950 , 950 - 975 , 975 - 1000 , 1000 - 1025 , 1025 - 1050 , 1050 - 1075 , 1075 - 1100 , 1100 - 1125 , 1125 - 1150 , 1150 - 1175 , 1175 - 1200 , 1200 - 1225 | ||
| Click To Change The Sort Order: By Market Cap or Company Size Performance: Year-to-date, Week and Day | |
| Select Chart Type: | ||
|
Best Stocks Today 12Stocks.com |
© 2024 12Stocks.com Terms & Conditions Privacy Contact Us
All Information Provided Only For Education And Not To Be Used For Investing or Trading. See Terms & Conditions


One More Thing ... Get Best Stocks Delivered Daily!
Never Ever Miss A Move With Our Top Ten Stocks Lists
Find Best Stocks In Any Market - Bull or Bear Market
Take A Peek At Our Top Ten Stocks Lists: Daily, Weekly, Year-to-Date & Top Trends
Find Best Stocks In Any Market - Bull or Bear Market
Take A Peek At Our Top Ten Stocks Lists: Daily, Weekly, Year-to-Date & Top Trends
Financial Stocks With Best Up Trends [0-bearish to 100-bullish]: Fangdd Network[100], Xinyuan Real[100], MicroSectors Gold[100], Sprott Physical[100], Citizens & Northern[100], Sumitomo Mitsui[100], First Community[100], Chubb [100], Angel Oak[100], Sprott Physical[100], Iris Energy[100]
Best Financial Stocks Year-to-Date:
Root [526.36%], Fangdd Network[149.63%], Banco Macro[126.41%], Grupo Financiero[112.4%], Banco BBVA[110.66%], SelectQuote [110.22%], Gladstone Capital[106.92%], EverQuote [98.2%], Hippo [92.54%], Grupo Supervielle[86.95%], Vista Oil[60.93%] Best Financial Stocks This Week:
Fangdd Network[360.27%], Xinyuan Real[53.28%], Iris Energy[25.68%], Fathom [25.35%], Huize Holding[21.83%], First Foundation[18.98%], Trupanion [17.21%], Bridge [16.67%], MicroSectors Gold[15.19%], KE [13.86%], Douglas Elliman[13.56%] Best Financial Stocks Daily:
Fangdd Network[321.26%], Xinyuan Real[39.49%], MicroSectors Gold[12.02%], Fathom [9.88%], Citizens [8.53%], Hywin [8.28%], Root [6.10%], First Foundation[6.09%], Sprott Physical[6.09%], Freedom Holding[5.02%], NexGen Energy[4.99%]