
 Login Sign Up


| |||||
 |  | ||||

| 12Stocks.com Market Intelligence |
Best Financial Stocks
| In a hurry? Financial Stocks Lists: Performance Trends Table, Stock Charts
Sort Financial stocks: Daily, Weekly, Year-to-Date, Market Cap & Trends. Filter Financial stocks list by size:All Financial Large Mid-Range Small & MicroCap |
| 12Stocks.com Financial Stocks Performances & Trends Daily | |||||||||
|
|  The overall Smart Investing & Trading Score is 95 (0-bearish to 100-bullish) which puts Financial sector in short term bullish trend. The Smart Investing & Trading Score from previous trading session is 100 and a deterioration of trend continues.
| ||||||||
Here are the Smart Investing & Trading Scores of the most requested Financial stocks at 12Stocks.com (click stock name for detailed review):
|


| 12Stocks.com: Investing in Financial sector with Stocks | |
|
The following table helps investors and traders sort through current performance and trends (as measured by Smart Investing & Trading Score) of various
stocks in the Financial sector. Quick View: Move mouse or cursor over stock symbol (ticker) to view short-term Technical chart and over stock name to view long term chart. Click on  to add stock symbol to your watchlist and to add stock symbol to your watchlist and  to view watchlist. Click on any ticker or stock name for detailed market intelligence report for that stock. to view watchlist. Click on any ticker or stock name for detailed market intelligence report for that stock. |
12Stocks.com Performance of Stocks in Financial Sector
| Ticker | Stock Name | Watchlist | Category | Recent Price | Smart Investing & Trading Score | Change % | Weekly Change% |
| NCA | Nuveen California |   | Closed-End Fund - Debt | 8.67 | 7 | -0.23% | -1.81% |
| TOP | TOP | | Capital Markets | 2.70 | 42 | 2.27% | -1.82% |
| TREE | LendingTree | | Mortgage | 45.70 | 46 | -0.67% | -1.83% |
| ALL | Allstate | | Insurance | 169.51 | 63 | 0.25% | -1.85% |
| CSWC | Capital Southwest | | Asset Mgmt | 26.20 | 46 | 0.81% | -1.91% |
| TSLX | TPG Specialty | | Mortgage | 21.23 | 17 | -0.33% | -1.94% |
| CIM | Chimera | | Mortgage | 4.52 | 83 | -0.88% | -1.95% |
| PEBK | Peoples Bancorp | | Regional Banks | 30.20 | 56 | -1.52% | -1.96% |
| PFLT | PennantPark Floating | | Asset Mgmt | 11.28 | 0 | 0.18% | -2.00% |
| GBDC | Golub Capital | | Asset Mgmt | 16.39 | 36 | -0.24% | -2.03% |
| DMLP | Dorchester Minerals | | Investments | 31.76 | 43 | 0.13% | -2.04% |
| DNP | DNP Select | | Closed-End Fund - Equity | 8.81 | 31 | 0.46% | -2.06% |
| EIG | Employers | | Insurance | 42.57 | 25 | -0.02% | -2.09% |
| NRO | Neuberger Berman | | Asset Mgmt | 3.26 | 42 | -0.31% | -2.10% |
| HIW | Highwoods Properties | | REIT - Office | 26.31 | 58 | -1.97% | -2.12% |
| CFR | Cullen/Frost Bankers | | Regional - Southwest Banks | 105.58 | 17 | -0.04% | -2.13% |
| YRD | Yiren Digital | | Credit Services | 5.01 | 12 | -0.60% | -2.15% |
| TPL | Texas Pacific | | Real Estatet | 610.22 | 47 | 0.28% | -2.16% |
| OXSQ | Oxford Square | | Asset Mgmt | 3.15 | 36 | -0.32% | -2.17% |
| SKWD | Skyward Specialty | | Insurance - Property & Casualty | 36.53 | 36 | 0.74% | -2.22% |
| BUI | BlackRock Utilities | | Closed-End Fund - Equity | 22.35 | 68 | -1.19% | -2.27% |
| HRZN | Horizon Technology | | Asset Mgmt | 11.57 | 25 | 0.09% | -2.28% |
| BWBBP | Bridgewater Bancshares | | Banks - Regional | 18.40 | 48 | -2.13% | -2.28% |
| EDF | Stone Harbor | | Asset Mgmt | 5.37 | 39 | 0.19% | -2.36% |
| ERIE | Erie Indemnity | | Insurance | 396.81 | 37 | 0.14% | -2.40% |
| For chart view version of above stock list: Chart View ➞ 0 - 25 , 25 - 50 , 50 - 75 , 75 - 100 , 100 - 125 , 125 - 150 , 150 - 175 , 175 - 200 , 200 - 225 , 225 - 250 , 250 - 275 , 275 - 300 , 300 - 325 , 325 - 350 , 350 - 375 , 375 - 400 , 400 - 425 , 425 - 450 , 450 - 475 , 475 - 500 , 500 - 525 , 525 - 550 , 550 - 575 , 575 - 600 , 600 - 625 , 625 - 650 , 650 - 675 , 675 - 700 , 700 - 725 , 725 - 750 , 750 - 775 , 775 - 800 , 800 - 825 , 825 - 850 , 850 - 875 , 875 - 900 , 900 - 925 , 925 - 950 , 950 - 975 , 975 - 1000 , 1000 - 1025 , 1025 - 1050 , 1050 - 1075 , 1075 - 1100 , 1100 - 1125 , 1125 - 1150 , 1150 - 1175 , 1175 - 1200 , 1200 - 1225 | ||
 | Click To Change The Sort Order: By Market Cap or Company Size Performance: Year-to-date, Week and Day |  |
|
Get the most comprehensive stock market coverage daily at 12Stocks.com ➞ Best Stocks Today ➞ Best Stocks Weekly ➞ Best Stocks Year-to-Date ➞ Best Stocks Trends ➞  Best Stocks Today 12Stocks.com Best Nasdaq Stocks ➞ Best S&P 500 Stocks ➞ Best Tech Stocks ➞ Best Biotech Stocks ➞ |
| Detailed Overview of Financial Stocks |
| Financial Technical Overview, Leaders & Laggards, Top Financial ETF Funds & Detailed Financial Stocks List, Charts, Trends & More |
| Financial Sector: Technical Analysis, Trends & YTD Performance | |
| Financial sector is composed of stocks
from banks, brokers, insurance, REITs
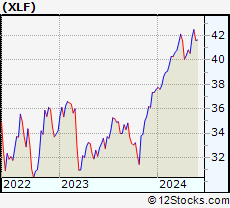
and services subsectors. Financial sector, as represented by XLF, an exchange-traded fund [ETF] that holds basket of Financial stocks (e.g, Bank of America, Goldman Sachs) is up by 13.01% and is currently outperforming the overall market by 2.44% year-to-date. Below is a quick view of Technical charts and trends: |
|
 XLF Weekly Chart |
|
| Long Term Trend: Very Good | |
| Medium Term Trend: Very Good | |
 XLF Daily Chart |
|
| Short Term Trend: Very Good | |
| Overall Trend Score: 95 | |
| YTD Performance: 13.01% | |
| **Trend Scores & Views Are Only For Educational Purposes And Not For Investing | |
| 12Stocks.com: Top Performing Financial Sector Stocks | ||||||||||||||||||||||||||||||||||||||||||||||||
 The top performing Financial sector stocks year to date are
Now, more recently, over last week, the top performing Financial sector stocks on the move are


|
||||||||||||||||||||||||||||||||||||||||||||||||
| 12Stocks.com: Investing in Financial Sector using Exchange Traded Funds | |
|
The following table shows list of key exchange traded funds (ETF) that
help investors track Financial Index. For detailed view, check out our ETF Funds section of our website. Quick View: Move mouse or cursor over ETF symbol (ticker) to view short-term Technical chart and over ETF name to view long term chart. Click on ticker or stock name for detailed view. Click on to add stock symbol to your watchlist and to view watchlist. |
12Stocks.com List of ETFs that track Financial Index
| Ticker | ETF Name | Watchlist | Recent Price | Smart Investing & Trading Score | Change % | Week % | Year-to-date % |
| XLF | Financial | | 42.49 | 95 | 0.73 | 1.58 | 13.01% |
| IAI | Broker-Dealers & Secs | | 119.47 | 100 | 1.08 | 2.59 | 10.08% |
| IYF | Financials | | 96.85 | 95 | 0.43 | 1.73 | 13.39% |
| IYG | Financial Services | | 67.11 | 95 | 0.15 | 1.56 | 12.34% |
| KRE | Regional Banking | | 51.19 | 83 | 0.23 | 1.67 | -2.37% |
| IXG | Global Financials | | 88.72 | 88 | 0.21 | 1.41 | 12.91% |
| VFH | Financials | | 103.00 | 95 | 0.18 | 1.45 | 11.64% |
| KBE | Bank | | 47.93 | 83 | 0.44 | 1.25 | 4.15% |
| FAS | Financial Bull 3X | | 112.32 | 95 | 1.81 | 4.06 | 35.9% |
| FAZ | Financial Bear 3X | | 9.75 | 10 | -1.71 | -3.75 | -28.68% |
| UYG | Financials | | 68.54 | 100 | 1.23 | 2.77 | 24.17% |
| IAT | Regional Banks | | 43.42 | 76 | -0.26 | 1.02 | 3.78% |
| KIE | Insurance | | 51.83 | 100 | 0.88 | 1.09 | 14.62% |
| PSCF | SmallCap Financials | | 49.03 | 95 | 0.28 | 1.44 | -0.31% |
| EUFN | Europe Financials | | 24.13 | 95 | 0.67 | 2.51 | 15.12% |
| PGF | Financial Preferred | | 14.81 | 52 | -0.10 | 0.68 | 1.58% |
| 12Stocks.com: Charts, Trends, Fundamental Data and Performances of Financial Stocks | |
|
We now take in-depth look at all Financial stocks including charts, multi-period performances and overall trends (as measured by Smart Investing & Trading Score). One can sort Financial stocks (click link to choose) by Daily, Weekly and by Year-to-Date performances. Also, one can sort by size of the company or by market capitalization. |
| Select Your Default Chart Type: | |||||
| |||||
| Click on stock symbol or name for detailed view. Click on to add stock symbol to your watchlist and to view watchlist. Quick View: Move mouse or cursor over "Daily" to quickly view daily Technical stock chart and over "Weekly" to view weekly Technical stock chart. | |||||

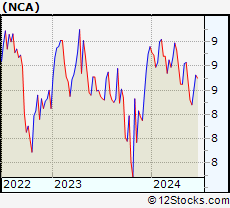 | NCA Nuveen California Municipal Value Fund, Inc. |
| Sector: Financials | |
| SubSector: Closed-End Fund - Debt | |
| MarketCap: 256.107 Millions | |
| Recent Price: 8.67 Smart Investing & Trading Score: 7 | |
| Day Percent Change: -0.23% Day Change: -0.02 | |
| Week Change: -1.81% Year-to-date Change: -3.2% | |
| NCA Links: Profile News Message Board | |
| Charts:- Daily , Weekly | |
| Add NCA to Watchlist: View: Get Complete NCA Trend Analysis ➞ | |
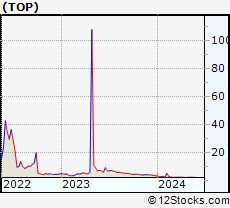 | TOP TOP Financial Group Limited |
| Sector: Financials | |
| SubSector: Capital Markets | |
| MarketCap: 329 Millions | |
| Recent Price: 2.70 Smart Investing & Trading Score: 42 | |
| Day Percent Change: 2.27% Day Change: 0.06 | |
| Week Change: -1.82% Year-to-date Change: -27.4% | |
| TOP Links: Profile News Message Board | |
| Charts:- Daily , Weekly | |
| Add TOP to Watchlist: View: Get Complete TOP Trend Analysis ➞ | |
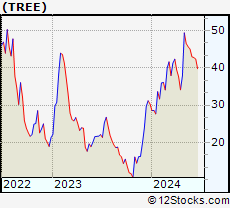 | TREE LendingTree, Inc. |
| Sector: Financials | |
| SubSector: Mortgage Investment | |
| MarketCap: 2745.99 Millions | |
| Recent Price: 45.70 Smart Investing & Trading Score: 46 | |
| Day Percent Change: -0.67% Day Change: -0.31 | |
| Week Change: -1.83% Year-to-date Change: 50.7% | |
| TREE Links: Profile News Message Board | |
| Charts:- Daily , Weekly | |
| Add TREE to Watchlist: View: Get Complete TREE Trend Analysis ➞ | |
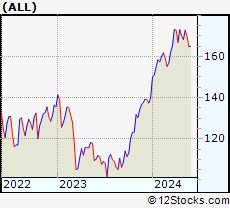 | ALL The Allstate Corporation |
| Sector: Financials | |
| SubSector: Property & Casualty Insurance | |
| MarketCap: 25916.6 Millions | |
| Recent Price: 169.51 Smart Investing & Trading Score: 63 | |
| Day Percent Change: 0.25% Day Change: 0.43 | |
| Week Change: -1.85% Year-to-date Change: 21.1% | |
| ALL Links: Profile News Message Board | |
| Charts:- Daily , Weekly | |
| Add ALL to Watchlist: View: Get Complete ALL Trend Analysis ➞ | |
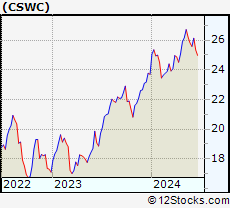 | CSWC Capital Southwest Corporation |
| Sector: Financials | |
| SubSector: Asset Management | |
| MarketCap: 213.703 Millions | |
| Recent Price: 26.20 Smart Investing & Trading Score: 46 | |
| Day Percent Change: 0.81% Day Change: 0.21 | |
| Week Change: -1.91% Year-to-date Change: 10.6% | |
| CSWC Links: Profile News Message Board | |
| Charts:- Daily , Weekly | |
| Add CSWC to Watchlist: View: Get Complete CSWC Trend Analysis ➞ | |
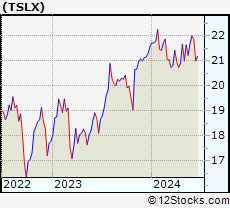 | TSLX TPG Specialty Lending, Inc. |
| Sector: Financials | |
| SubSector: Mortgage Investment | |
| MarketCap: 902.039 Millions | |
| Recent Price: 21.23 Smart Investing & Trading Score: 17 | |
| Day Percent Change: -0.33% Day Change: -0.07 | |
| Week Change: -1.94% Year-to-date Change: -1.7% | |
| TSLX Links: Profile News Message Board | |
| Charts:- Daily , Weekly | |
| Add TSLX to Watchlist: View: Get Complete TSLX Trend Analysis ➞ | |
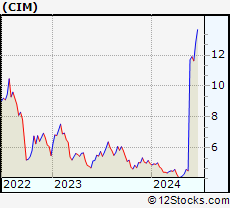 | CIM Chimera Investment Corporation |
| Sector: Financials | |
| SubSector: Mortgage Investment | |
| MarketCap: 2164.09 Millions | |
| Recent Price: 4.52 Smart Investing & Trading Score: 83 | |
| Day Percent Change: -0.88% Day Change: -0.04 | |
| Week Change: -1.95% Year-to-date Change: -9.4% | |
| CIM Links: Profile News Message Board | |
| Charts:- Daily , Weekly | |
| Add CIM to Watchlist: View: Get Complete CIM Trend Analysis ➞ | |
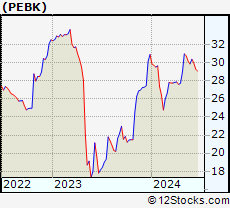 | PEBK Peoples Bancorp of North Carolina, Inc. |
| Sector: Financials | |
| SubSector: Regional - Mid-Atlantic Banks | |
| MarketCap: 180.759 Millions | |
| Recent Price: 30.20 Smart Investing & Trading Score: 56 | |
| Day Percent Change: -1.52% Day Change: -0.46 | |
| Week Change: -1.96% Year-to-date Change: -2.4% | |
| PEBK Links: Profile News Message Board | |
| Charts:- Daily , Weekly | |
| Add PEBK to Watchlist: View: Get Complete PEBK Trend Analysis ➞ | |
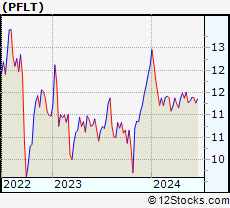 | PFLT PennantPark Floating Rate Capital Ltd. |
| Sector: Financials | |
| SubSector: Asset Management | |
| MarketCap: 170.903 Millions | |
| Recent Price: 11.28 Smart Investing & Trading Score: 0 | |
| Day Percent Change: 0.18% Day Change: 0.02 | |
| Week Change: -2% Year-to-date Change: -6.8% | |
| PFLT Links: Profile News Message Board | |
| Charts:- Daily , Weekly | |
| Add PFLT to Watchlist: View: Get Complete PFLT Trend Analysis ➞ | |
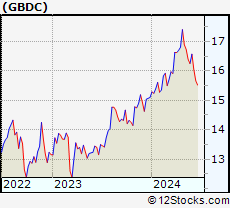 | GBDC Golub Capital BDC, Inc. |
| Sector: Financials | |
| SubSector: Asset Management | |
| MarketCap: 1493.23 Millions | |
| Recent Price: 16.39 Smart Investing & Trading Score: 36 | |
| Day Percent Change: -0.24% Day Change: -0.04 | |
| Week Change: -2.03% Year-to-date Change: 8.5% | |
| GBDC Links: Profile News Message Board | |
| Charts:- Daily , Weekly | |
| Add GBDC to Watchlist: View: Get Complete GBDC Trend Analysis ➞ | |
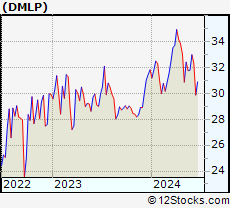 | DMLP Dorchester Minerals, L.P. |
| Sector: Financials | |
| SubSector: Diversified Investments | |
| MarketCap: 363.17 Millions | |
| Recent Price: 31.76 Smart Investing & Trading Score: 43 | |
| Day Percent Change: 0.13% Day Change: 0.04 | |
| Week Change: -2.04% Year-to-date Change: -0.2% | |
| DMLP Links: Profile News Message Board | |
| Charts:- Daily , Weekly | |
| Add DMLP to Watchlist: View: Get Complete DMLP Trend Analysis ➞ | |
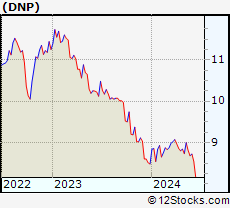 | DNP DNP Select Income Fund Inc. |
| Sector: Financials | |
| SubSector: Closed-End Fund - Equity | |
| MarketCap: 2706.07 Millions | |
| Recent Price: 8.81 Smart Investing & Trading Score: 31 | |
| Day Percent Change: 0.46% Day Change: 0.04 | |
| Week Change: -2.06% Year-to-date Change: 3.9% | |
| DNP Links: Profile News Message Board | |
| Charts:- Daily , Weekly | |
| Add DNP to Watchlist: View: Get Complete DNP Trend Analysis ➞ | |
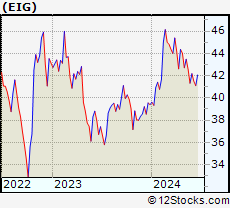 | EIG Employers Holdings, Inc. |
| Sector: Financials | |
| SubSector: Accident & Health Insurance | |
| MarketCap: 1202.6 Millions | |
| Recent Price: 42.57 Smart Investing & Trading Score: 25 | |
| Day Percent Change: -0.02% Day Change: -0.01 | |
| Week Change: -2.09% Year-to-date Change: 8.1% | |
| EIG Links: Profile News Message Board | |
| Charts:- Daily , Weekly | |
| Add EIG to Watchlist: View: Get Complete EIG Trend Analysis ➞ | |
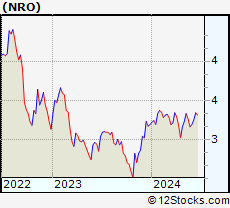 | NRO Neuberger Berman Real Estate Securities Income Fund Inc. |
| Sector: Financials | |
| SubSector: Asset Management | |
| MarketCap: 126.103 Millions | |
| Recent Price: 3.26 Smart Investing & Trading Score: 42 | |
| Day Percent Change: -0.31% Day Change: -0.01 | |
| Week Change: -2.1% Year-to-date Change: 2.2% | |
| NRO Links: Profile News Message Board | |
| Charts:- Daily , Weekly | |
| Add NRO to Watchlist: View: Get Complete NRO Trend Analysis ➞ | |
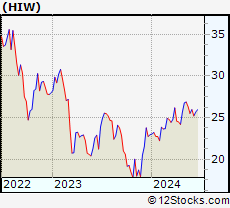 | HIW Highwoods Properties, Inc. |
| Sector: Financials | |
| SubSector: REIT - Office | |
| MarketCap: 3227.46 Millions | |
| Recent Price: 26.31 Smart Investing & Trading Score: 58 | |
| Day Percent Change: -1.97% Day Change: -0.53 | |
| Week Change: -2.12% Year-to-date Change: 14.6% | |
| HIW Links: Profile News Message Board | |
| Charts:- Daily , Weekly | |
| Add HIW to Watchlist: View: Get Complete HIW Trend Analysis ➞ | |
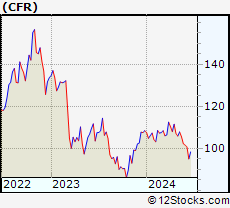 | CFR Cullen/Frost Bankers, Inc. |
| Sector: Financials | |
| SubSector: Regional - Southwest Banks | |
| MarketCap: 3536.75 Millions | |
| Recent Price: 105.58 Smart Investing & Trading Score: 17 | |
| Day Percent Change: -0.04% Day Change: -0.04 | |
| Week Change: -2.13% Year-to-date Change: -2.7% | |
| CFR Links: Profile News Message Board | |
| Charts:- Daily , Weekly | |
| Add CFR to Watchlist: View: Get Complete CFR Trend Analysis ➞ | |
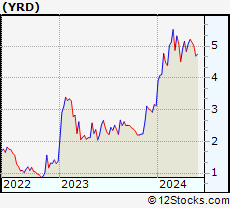 | YRD Yiren Digital Ltd. |
| Sector: Financials | |
| SubSector: Credit Services | |
| MarketCap: 330.208 Millions | |
| Recent Price: 5.01 Smart Investing & Trading Score: 12 | |
| Day Percent Change: -0.60% Day Change: -0.03 | |
| Week Change: -2.15% Year-to-date Change: 60.6% | |
| YRD Links: Profile News Message Board | |
| Charts:- Daily , Weekly | |
| Add YRD to Watchlist: View: Get Complete YRD Trend Analysis ➞ | |
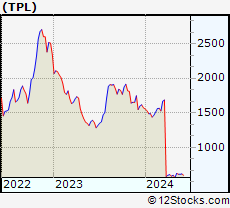 | TPL Texas Pacific Land Trust |
| Sector: Financials | |
| SubSector: Real Estate Development | |
| MarketCap: 3052.29 Millions | |
| Recent Price: 610.22 Smart Investing & Trading Score: 47 | |
| Day Percent Change: 0.28% Day Change: 1.70 | |
| Week Change: -2.16% Year-to-date Change: -61.2% | |
| TPL Links: Profile News Message Board | |
| Charts:- Daily , Weekly | |
| Add TPL to Watchlist: View: Get Complete TPL Trend Analysis ➞ | |
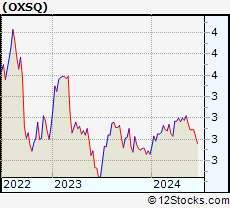 | OXSQ Oxford Square Capital Corp. |
| Sector: Financials | |
| SubSector: Asset Management | |
| MarketCap: 113.603 Millions | |
| Recent Price: 3.15 Smart Investing & Trading Score: 36 | |
| Day Percent Change: -0.32% Day Change: -0.01 | |
| Week Change: -2.17% Year-to-date Change: 10.1% | |
| OXSQ Links: Profile News Message Board | |
| Charts:- Daily , Weekly | |
| Add OXSQ to Watchlist: View: Get Complete OXSQ Trend Analysis ➞ | |
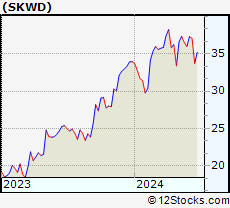 | SKWD Skyward Specialty Insurance Group, Inc. |
| Sector: Financials | |
| SubSector: Insurance - Property & Casualty | |
| MarketCap: 936 Millions | |
| Recent Price: 36.53 Smart Investing & Trading Score: 36 | |
| Day Percent Change: 0.74% Day Change: 0.27 | |
| Week Change: -2.22% Year-to-date Change: 7.6% | |
| SKWD Links: Profile News Message Board | |
| Charts:- Daily , Weekly | |
| Add SKWD to Watchlist: View: Get Complete SKWD Trend Analysis ➞ | |
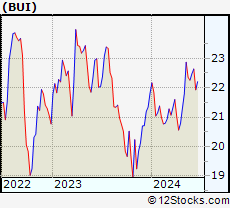 | BUI BlackRock Utilities, Infrastructure & Power Opportunities Trust |
| Sector: Financials | |
| SubSector: Closed-End Fund - Equity | |
| MarketCap: 263.847 Millions | |
| Recent Price: 22.35 Smart Investing & Trading Score: 68 | |
| Day Percent Change: -1.19% Day Change: -0.27 | |
| Week Change: -2.27% Year-to-date Change: 2.4% | |
| BUI Links: Profile News Message Board | |
| Charts:- Daily , Weekly | |
| Add BUI to Watchlist: View: Get Complete BUI Trend Analysis ➞ | |
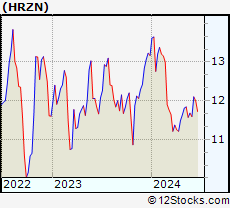 | HRZN Horizon Technology Finance Corporation |
| Sector: Financials | |
| SubSector: Asset Management | |
| MarketCap: 109.203 Millions | |
| Recent Price: 11.57 Smart Investing & Trading Score: 25 | |
| Day Percent Change: 0.09% Day Change: 0.01 | |
| Week Change: -2.28% Year-to-date Change: -12.2% | |
| HRZN Links: Profile News Message Board | |
| Charts:- Daily , Weekly | |
| Add HRZN to Watchlist: View: Get Complete HRZN Trend Analysis ➞ | |
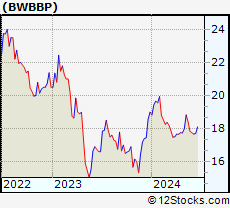 | BWBBP Bridgewater Bancshares, Inc. |
| Sector: Financials | |
| SubSector: Banks - Regional | |
| MarketCap: 285 Millions | |
| Recent Price: 18.40 Smart Investing & Trading Score: 48 | |
| Day Percent Change: -2.13% Day Change: -0.40 | |
| Week Change: -2.28% Year-to-date Change: -3.2% | |
| BWBBP Links: Profile News Message Board | |
| Charts:- Daily , Weekly | |
| Add BWBBP to Watchlist: View: Get Complete BWBBP Trend Analysis ➞ | |
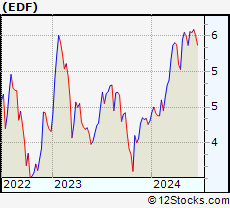 | EDF Stone Harbor Emerging Markets Income Fund |
| Sector: Financials | |
| SubSector: Asset Management | |
| MarketCap: 108.203 Millions | |
| Recent Price: 5.37 Smart Investing & Trading Score: 39 | |
| Day Percent Change: 0.19% Day Change: 0.01 | |
| Week Change: -2.36% Year-to-date Change: 24.6% | |
| EDF Links: Profile News Message Board | |
| Charts:- Daily , Weekly | |
| Add EDF to Watchlist: View: Get Complete EDF Trend Analysis ➞ | |
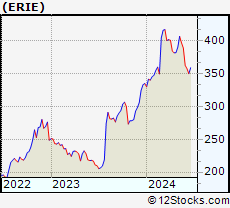 | ERIE Erie Indemnity Company |
| Sector: Financials | |
| SubSector: Insurance Brokers | |
| MarketCap: 8822 Millions | |
| Recent Price: 396.81 Smart Investing & Trading Score: 37 | |
| Day Percent Change: 0.14% Day Change: 0.54 | |
| Week Change: -2.4% Year-to-date Change: 18.5% | |
| ERIE Links: Profile News Message Board | |
| Charts:- Daily , Weekly | |
| Add ERIE to Watchlist: View: Get Complete ERIE Trend Analysis ➞ | |
| For tabular summary view of above stock list: Summary View ➞ 0 - 25 , 25 - 50 , 50 - 75 , 75 - 100 , 100 - 125 , 125 - 150 , 150 - 175 , 175 - 200 , 200 - 225 , 225 - 250 , 250 - 275 , 275 - 300 , 300 - 325 , 325 - 350 , 350 - 375 , 375 - 400 , 400 - 425 , 425 - 450 , 450 - 475 , 475 - 500 , 500 - 525 , 525 - 550 , 550 - 575 , 575 - 600 , 600 - 625 , 625 - 650 , 650 - 675 , 675 - 700 , 700 - 725 , 725 - 750 , 750 - 775 , 775 - 800 , 800 - 825 , 825 - 850 , 850 - 875 , 875 - 900 , 900 - 925 , 925 - 950 , 950 - 975 , 975 - 1000 , 1000 - 1025 , 1025 - 1050 , 1050 - 1075 , 1075 - 1100 , 1100 - 1125 , 1125 - 1150 , 1150 - 1175 , 1175 - 1200 , 1200 - 1225 | ||
| Click To Change The Sort Order: By Market Cap or Company Size Performance: Year-to-date, Week and Day | |
| Select Chart Type: | ||
|
Best Stocks Today 12Stocks.com |
© 2024 12Stocks.com Terms & Conditions Privacy Contact Us
All Information Provided Only For Education And Not To Be Used For Investing or Trading. See Terms & Conditions


One More Thing ... Get Best Stocks Delivered Daily!
Never Ever Miss A Move With Our Top Ten Stocks Lists
Find Best Stocks In Any Market - Bull or Bear Market
Take A Peek At Our Top Ten Stocks Lists: Daily, Weekly, Year-to-Date & Top Trends
Find Best Stocks In Any Market - Bull or Bear Market
Take A Peek At Our Top Ten Stocks Lists: Daily, Weekly, Year-to-Date & Top Trends
Financial Stocks With Best Up Trends [0-bearish to 100-bullish]: Fangdd Network[100], Xinyuan Real[100], MicroSectors Gold[100], Sprott Physical[100], Citizens & Northern[100], Sumitomo Mitsui[100], First Community[100], Chubb [100], Angel Oak[100], Sprott Physical[100], Iris Energy[100]
Best Financial Stocks Year-to-Date:
Root [526.36%], Fangdd Network[149.63%], Banco Macro[126.41%], Grupo Financiero[112.4%], Banco BBVA[110.66%], SelectQuote [110.22%], Gladstone Capital[106.92%], EverQuote [98.2%], Hippo [92.54%], Grupo Supervielle[86.95%], Vista Oil[60.93%] Best Financial Stocks This Week:
Fangdd Network[360.27%], Xinyuan Real[53.28%], Iris Energy[25.68%], Fathom [25.35%], Huize Holding[21.83%], First Foundation[18.98%], Trupanion [17.21%], Bridge [16.67%], MicroSectors Gold[15.19%], KE [13.86%], Douglas Elliman[13.56%] Best Financial Stocks Daily:
Fangdd Network[321.26%], Xinyuan Real[39.49%], MicroSectors Gold[12.02%], Fathom [9.88%], Citizens [8.53%], Hywin [8.28%], Root [6.10%], First Foundation[6.09%], Sprott Physical[6.09%], Freedom Holding[5.02%], NexGen Energy[4.99%]