
 Login Sign Up


| |||||
 |  | ||||

| 12Stocks.com Market Intelligence |
Best Financial Stocks
| In a hurry? Financial Stocks Lists: Performance Trends Table, Stock Charts
Sort Financial stocks: Daily, Weekly, Year-to-Date, Market Cap & Trends. Filter Financial stocks list by size:All Financial Large Mid-Range Small & MicroCap |
| 12Stocks.com Financial Stocks Performances & Trends Daily | |||||||||
|
|  The overall Smart Investing & Trading Score is 95 (0-bearish to 100-bullish) which puts Financial sector in short term bullish trend. The Smart Investing & Trading Score from previous trading session is 100 and a deterioration of trend continues.
| ||||||||
Here are the Smart Investing & Trading Scores of the most requested Financial stocks at 12Stocks.com (click stock name for detailed review):
|


| 12Stocks.com: Investing in Financial sector with Stocks | |
|
The following table helps investors and traders sort through current performance and trends (as measured by Smart Investing & Trading Score) of various
stocks in the Financial sector. Quick View: Move mouse or cursor over stock symbol (ticker) to view short-term Technical chart and over stock name to view long term chart. Click on  to add stock symbol to your watchlist and to add stock symbol to your watchlist and  to view watchlist. Click on any ticker or stock name for detailed market intelligence report for that stock. to view watchlist. Click on any ticker or stock name for detailed market intelligence report for that stock. |
12Stocks.com Performance of Stocks in Financial Sector
| Ticker | Stock Name | Watchlist | Category | Recent Price | Smart Investing & Trading Score | Change % | Weekly Change% |
| IBKR | Interactive Brokers |   | Brokerage | 123.82 | 100 | 1.64% | 3.09% |
| TFSL | TFS | | Regional Banks | 13.41 | 83 | 0.22% | 3.07% |
| BCS | Barclays | | Foreign Banks | 11.12 | 95 | 1.65% | 3.06% |
| CFG | Citizens | | Regional Banks | 37.16 | 100 | 1.75% | 3.05% |
| JPM | JPMorgan Chase | | Banks | 204.79 | 100 | 1.15% | 3.03% |
| DPG | Duff & Phelps Utility and Infrastructure Fund | | Closed-End Fund - Equity | 10.22 | 95 | 0.99% | 3.02% |
| ELS | Equity LifeStyle | | REIT | 64.68 | 74 | 1.91% | 3.01% |
| WFH | Direxion Work | | Exchange Traded Fund | 55.86 | 64 | 0.35% | 3.01% |
| WUGI | Esoterica NextG | | Exchange Traded Fund | 63.33 | 78 | -0.67% | 3.01% |
| ITUB | Itau Unibanco | | Foreign Banks | 6.53 | 44 | 0.93% | 3.00% |
| TECB | iShares U.S. | | Exchange Traded Fund | 48.25 | 83 | 0.25% | 3.00% |
| EFX | Equifax | | Credit Services | 248.75 | 40 | -0.48% | 2.96% |
| FFIN | First | | Regional - Southwest Banks | 31.78 | 93 | 2.19% | 2.95% |
| BNL | Broadstone Net | | REIT | 15.69 | 83 | 0.26% | 2.95% |
| WPC | W. P. | | REIT - | 60.11 | 95 | 0.92% | 2.95% |
| BCBP | BCB Bancorp | | Regional Banks | 10.82 | 100 | -0.37% | 2.95% |
| BTEK | BlackRock Future | | Exchange Traded Fund | 25.69 | 83 | -0.15% | 2.90% |
| CTO | Consolidated-Tomoka Land | | Real Estatet | 17.80 | 100 | -0.06% | 2.89% |
| SYBT | Stock Yards | | Regional Banks | 49.53 | 95 | 0.94% | 2.89% |
| EMF | Templeton Emerging | | Closed-End Fund - Foreign | 12.63 | 90 | -0.04% | 2.89% |
| BKU | BankUnited | | Regional Banks | 29.93 | 90 | -0.27% | 2.89% |
| MSOS | AdvisorShares Pure | | Exchange Traded Fund | 9.60 | 71 | -1.84% | 2.89% |
| CION | CION | | Asset Mgmt | 12.46 | 83 | 0.08% | 2.89% |
| IBTX | Independent Bank | | Regional Banks | 43.94 | 87 | 1.76% | 2.88% |
| GS | Goldman Sachs | | Brokerage | 467.72 | 90 | 0.69% | 2.86% |
| For chart view version of above stock list: Chart View ➞ 0 - 25 , 25 - 50 , 50 - 75 , 75 - 100 , 100 - 125 , 125 - 150 , 150 - 175 , 175 - 200 , 200 - 225 , 225 - 250 , 250 - 275 , 275 - 300 , 300 - 325 , 325 - 350 , 350 - 375 , 375 - 400 , 400 - 425 , 425 - 450 , 450 - 475 , 475 - 500 , 500 - 525 , 525 - 550 , 550 - 575 , 575 - 600 , 600 - 625 , 625 - 650 , 650 - 675 , 675 - 700 , 700 - 725 , 725 - 750 , 750 - 775 , 775 - 800 , 800 - 825 , 825 - 850 , 850 - 875 , 875 - 900 , 900 - 925 , 925 - 950 , 950 - 975 , 975 - 1000 , 1000 - 1025 , 1025 - 1050 , 1050 - 1075 , 1075 - 1100 , 1100 - 1125 , 1125 - 1150 , 1150 - 1175 , 1175 - 1200 , 1200 - 1225 | ||
 | Click To Change The Sort Order: By Market Cap or Company Size Performance: Year-to-date, Week and Day |  |
|
Get the most comprehensive stock market coverage daily at 12Stocks.com ➞ Best Stocks Today ➞ Best Stocks Weekly ➞ Best Stocks Year-to-Date ➞ Best Stocks Trends ➞  Best Stocks Today 12Stocks.com Best Nasdaq Stocks ➞ Best S&P 500 Stocks ➞ Best Tech Stocks ➞ Best Biotech Stocks ➞ |
| Detailed Overview of Financial Stocks |
| Financial Technical Overview, Leaders & Laggards, Top Financial ETF Funds & Detailed Financial Stocks List, Charts, Trends & More |
| Financial Sector: Technical Analysis, Trends & YTD Performance | |
| Financial sector is composed of stocks
from banks, brokers, insurance, REITs
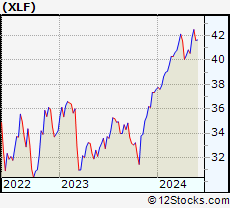
and services subsectors. Financial sector, as represented by XLF, an exchange-traded fund [ETF] that holds basket of Financial stocks (e.g, Bank of America, Goldman Sachs) is up by 13.01% and is currently outperforming the overall market by 2.44% year-to-date. Below is a quick view of Technical charts and trends: |
|
 XLF Weekly Chart |
|
| Long Term Trend: Very Good | |
| Medium Term Trend: Very Good | |
 XLF Daily Chart |
|
| Short Term Trend: Very Good | |
| Overall Trend Score: 95 | |
| YTD Performance: 13.01% | |
| **Trend Scores & Views Are Only For Educational Purposes And Not For Investing | |
| 12Stocks.com: Top Performing Financial Sector Stocks | ||||||||||||||||||||||||||||||||||||||||||||||||
 The top performing Financial sector stocks year to date are
Now, more recently, over last week, the top performing Financial sector stocks on the move are


|
||||||||||||||||||||||||||||||||||||||||||||||||
| 12Stocks.com: Investing in Financial Sector using Exchange Traded Funds | |
|
The following table shows list of key exchange traded funds (ETF) that
help investors track Financial Index. For detailed view, check out our ETF Funds section of our website. Quick View: Move mouse or cursor over ETF symbol (ticker) to view short-term Technical chart and over ETF name to view long term chart. Click on ticker or stock name for detailed view. Click on to add stock symbol to your watchlist and to view watchlist. |
12Stocks.com List of ETFs that track Financial Index
| Ticker | ETF Name | Watchlist | Recent Price | Smart Investing & Trading Score | Change % | Week % | Year-to-date % |
| XLF | Financial | | 42.49 | 95 | 0.73 | 1.58 | 13.01% |
| IAI | Broker-Dealers & Secs | | 119.47 | 100 | 1.08 | 2.59 | 10.08% |
| IYF | Financials | | 96.85 | 95 | 0.43 | 1.73 | 13.39% |
| IYG | Financial Services | | 67.11 | 95 | 0.15 | 1.56 | 12.34% |
| KRE | Regional Banking | | 51.19 | 83 | 0.23 | 1.67 | -2.37% |
| IXG | Global Financials | | 88.72 | 88 | 0.21 | 1.41 | 12.91% |
| VFH | Financials | | 103.00 | 95 | 0.18 | 1.45 | 11.64% |
| KBE | Bank | | 47.93 | 83 | 0.44 | 1.25 | 4.15% |
| FAS | Financial Bull 3X | | 112.32 | 95 | 1.81 | 4.06 | 35.9% |
| FAZ | Financial Bear 3X | | 9.75 | 10 | -1.71 | -3.75 | -28.68% |
| UYG | Financials | | 68.54 | 100 | 1.23 | 2.77 | 24.17% |
| IAT | Regional Banks | | 43.42 | 76 | -0.26 | 1.02 | 3.78% |
| KIE | Insurance | | 51.83 | 100 | 0.88 | 1.09 | 14.62% |
| PSCF | SmallCap Financials | | 49.03 | 95 | 0.28 | 1.44 | -0.31% |
| EUFN | Europe Financials | | 24.13 | 95 | 0.67 | 2.51 | 15.12% |
| PGF | Financial Preferred | | 14.81 | 52 | -0.10 | 0.68 | 1.58% |
| 12Stocks.com: Charts, Trends, Fundamental Data and Performances of Financial Stocks | |
|
We now take in-depth look at all Financial stocks including charts, multi-period performances and overall trends (as measured by Smart Investing & Trading Score). One can sort Financial stocks (click link to choose) by Daily, Weekly and by Year-to-Date performances. Also, one can sort by size of the company or by market capitalization. |
| Select Your Default Chart Type: | |||||
| |||||
| Click on stock symbol or name for detailed view. Click on to add stock symbol to your watchlist and to view watchlist. Quick View: Move mouse or cursor over "Daily" to quickly view daily Technical stock chart and over "Weekly" to view weekly Technical stock chart. | |||||

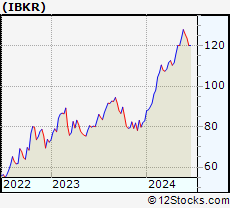 | IBKR Interactive Brokers Group, Inc. |
| Sector: Financials | |
| SubSector: Investment Brokerage - National | |
| MarketCap: 16975.7 Millions | |
| Recent Price: 123.82 Smart Investing & Trading Score: 100 | |
| Day Percent Change: 1.64% Day Change: 2.00 | |
| Week Change: 3.09% Year-to-date Change: 49.4% | |
| IBKR Links: Profile News Message Board | |
| Charts:- Daily , Weekly | |
| Add IBKR to Watchlist: View: Get Complete IBKR Trend Analysis ➞ | |
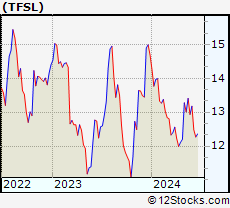 | TFSL TFS Financial Corporation |
| Sector: Financials | |
| SubSector: Regional - Midwest Banks | |
| MarketCap: 4539.1 Millions | |
| Recent Price: 13.41 Smart Investing & Trading Score: 83 | |
| Day Percent Change: 0.22% Day Change: 0.03 | |
| Week Change: 3.07% Year-to-date Change: -8.7% | |
| TFSL Links: Profile News Message Board | |
| Charts:- Daily , Weekly | |
| Add TFSL to Watchlist: View: Get Complete TFSL Trend Analysis ➞ | |
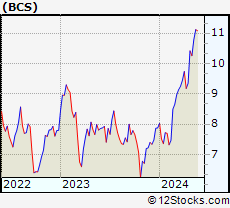 | BCS Barclays PLC |
| Sector: Financials | |
| SubSector: Foreign Money Center Banks | |
| MarketCap: 21013.4 Millions | |
| Recent Price: 11.12 Smart Investing & Trading Score: 95 | |
| Day Percent Change: 1.65% Day Change: 0.18 | |
| Week Change: 3.06% Year-to-date Change: 41.1% | |
| BCS Links: Profile News Message Board | |
| Charts:- Daily , Weekly | |
| Add BCS to Watchlist: View: Get Complete BCS Trend Analysis ➞ | |
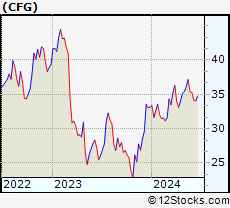 | CFG Citizens Financial Group, Inc. |
| Sector: Financials | |
| SubSector: Regional - Mid-Atlantic Banks | |
| MarketCap: 8225.19 Millions | |
| Recent Price: 37.16 Smart Investing & Trading Score: 100 | |
| Day Percent Change: 1.75% Day Change: 0.64 | |
| Week Change: 3.05% Year-to-date Change: 12.1% | |
| CFG Links: Profile News Message Board | |
| Charts:- Daily , Weekly | |
| Add CFG to Watchlist: View: Get Complete CFG Trend Analysis ➞ | |
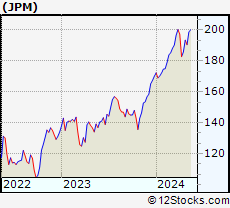 | JPM JPMorgan Chase & Co. |
| Sector: Financials | |
| SubSector: Money Center Banks | |
| MarketCap: 279736 Millions | |
| Recent Price: 204.79 Smart Investing & Trading Score: 100 | |
| Day Percent Change: 1.15% Day Change: 2.32 | |
| Week Change: 3.03% Year-to-date Change: 20.4% | |
| JPM Links: Profile News Message Board | |
| Charts:- Daily , Weekly | |
| Add JPM to Watchlist: View: Get Complete JPM Trend Analysis ➞ | |
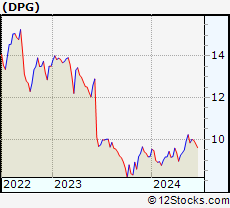 | DPG Duff & Phelps Utility and Infrastructure Fund Inc. |
| Sector: Financials | |
| SubSector: Closed-End Fund - Equity | |
| MarketCap: 301.147 Millions | |
| Recent Price: 10.22 Smart Investing & Trading Score: 95 | |
| Day Percent Change: 0.99% Day Change: 0.10 | |
| Week Change: 3.02% Year-to-date Change: 11.5% | |
| DPG Links: Profile News Message Board | |
| Charts:- Daily , Weekly | |
| Add DPG to Watchlist: View: Get Complete DPG Trend Analysis ➞ | |
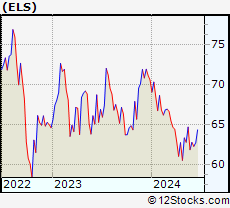 | ELS Equity LifeStyle Properties, Inc. |
| Sector: Financials | |
| SubSector: REIT - Residential | |
| MarketCap: 9570.61 Millions | |
| Recent Price: 64.68 Smart Investing & Trading Score: 74 | |
| Day Percent Change: 1.91% Day Change: 1.21 | |
| Week Change: 3.01% Year-to-date Change: -8.3% | |
| ELS Links: Profile News Message Board | |
| Charts:- Daily , Weekly | |
| Add ELS to Watchlist: View: Get Complete ELS Trend Analysis ➞ | |
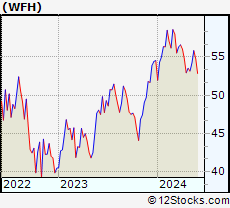 | WFH Direxion Work From Home ETF |
| Sector: Financials | |
| SubSector: Exchange Traded Fund | |
| MarketCap: 60157 Millions | |
| Recent Price: 55.86 Smart Investing & Trading Score: 64 | |
| Day Percent Change: 0.35% Day Change: 0.20 | |
| Week Change: 3.01% Year-to-date Change: 2.4% | |
| WFH Links: Profile News Message Board | |
| Charts:- Daily , Weekly | |
| Add WFH to Watchlist: View: Get Complete WFH Trend Analysis ➞ | |
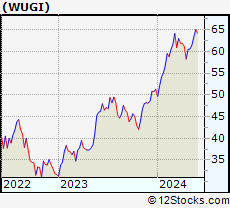 | WUGI Esoterica NextG Economy ETF |
| Sector: Financials | |
| SubSector: Exchange Traded Fund | |
| MarketCap: 60157 Millions | |
| Recent Price: 63.33 Smart Investing & Trading Score: 78 | |
| Day Percent Change: -0.67% Day Change: -0.42 | |
| Week Change: 3.01% Year-to-date Change: 23.5% | |
| WUGI Links: Profile News Message Board | |
| Charts:- Daily , Weekly | |
| Add WUGI to Watchlist: View: Get Complete WUGI Trend Analysis ➞ | |
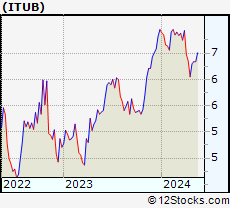 | ITUB Itau Unibanco Holding S.A. |
| Sector: Financials | |
| SubSector: Foreign Regional Banks | |
| MarketCap: 48121 Millions | |
| Recent Price: 6.53 Smart Investing & Trading Score: 44 | |
| Day Percent Change: 0.93% Day Change: 0.06 | |
| Week Change: 3% Year-to-date Change: -6.0% | |
| ITUB Links: Profile News Message Board | |
| Charts:- Daily , Weekly | |
| Add ITUB to Watchlist: View: Get Complete ITUB Trend Analysis ➞ | |
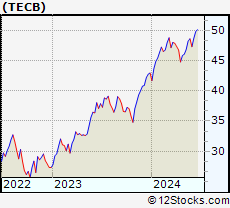 | TECB iShares U.S. Tech Breakthrough Multisector ETF |
| Sector: Financials | |
| SubSector: Exchange Traded Fund | |
| MarketCap: 60157 Millions | |
| Recent Price: 48.25 Smart Investing & Trading Score: 83 | |
| Day Percent Change: 0.25% Day Change: 0.12 | |
| Week Change: 3% Year-to-date Change: 12.3% | |
| TECB Links: Profile News Message Board | |
| Charts:- Daily , Weekly | |
| Add TECB to Watchlist: View: Get Complete TECB Trend Analysis ➞ | |
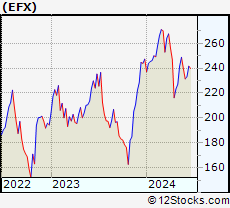 | EFX Equifax Inc. |
| Sector: Financials | |
| SubSector: Credit Services | |
| MarketCap: 13754.6 Millions | |
| Recent Price: 248.75 Smart Investing & Trading Score: 40 | |
| Day Percent Change: -0.48% Day Change: -1.19 | |
| Week Change: 2.96% Year-to-date Change: 0.6% | |
| EFX Links: Profile News Message Board | |
| Charts:- Daily , Weekly | |
| Add EFX to Watchlist: View: Get Complete EFX Trend Analysis ➞ | |
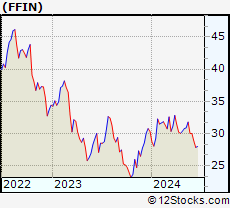 | FFIN First Financial Bankshares, Inc. |
| Sector: Financials | |
| SubSector: Regional - Southwest Banks | |
| MarketCap: 3503.75 Millions | |
| Recent Price: 31.78 Smart Investing & Trading Score: 93 | |
| Day Percent Change: 2.19% Day Change: 0.68 | |
| Week Change: 2.95% Year-to-date Change: 4.9% | |
| FFIN Links: Profile News Message Board | |
| Charts:- Daily , Weekly | |
| Add FFIN to Watchlist: View: Get Complete FFIN Trend Analysis ➞ | |
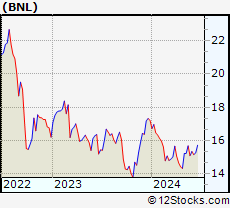 | BNL Broadstone Net Lease, Inc. |
| Sector: Financials | |
| SubSector: REIT Diversified | |
| MarketCap: 27267 Millions | |
| Recent Price: 15.69 Smart Investing & Trading Score: 83 | |
| Day Percent Change: 0.26% Day Change: 0.04 | |
| Week Change: 2.95% Year-to-date Change: -8.9% | |
| BNL Links: Profile News Message Board | |
| Charts:- Daily , Weekly | |
| Add BNL to Watchlist: View: Get Complete BNL Trend Analysis ➞ | |
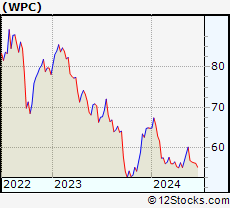 | WPC W. P. Carey Inc. |
| Sector: Financials | |
| SubSector: REIT - Diversified | |
| MarketCap: 9560.03 Millions | |
| Recent Price: 60.11 Smart Investing & Trading Score: 95 | |
| Day Percent Change: 0.92% Day Change: 0.55 | |
| Week Change: 2.95% Year-to-date Change: -7.3% | |
| WPC Links: Profile News Message Board | |
| Charts:- Daily , Weekly | |
| Add WPC to Watchlist: View: Get Complete WPC Trend Analysis ➞ | |
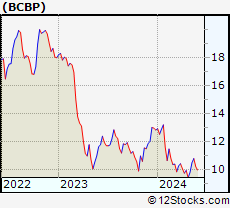 | BCBP BCB Bancorp, Inc. |
| Sector: Financials | |
| SubSector: Regional - Northeast Banks | |
| MarketCap: 196.799 Millions | |
| Recent Price: 10.82 Smart Investing & Trading Score: 100 | |
| Day Percent Change: -0.37% Day Change: -0.04 | |
| Week Change: 2.95% Year-to-date Change: -15.8% | |
| BCBP Links: Profile News Message Board | |
| Charts:- Daily , Weekly | |
| Add BCBP to Watchlist: View: Get Complete BCBP Trend Analysis ➞ | |
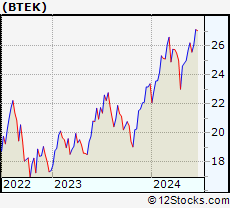 | BTEK BlackRock Future Tech ETF |
| Sector: Financials | |
| SubSector: Exchange Traded Fund | |
| MarketCap: 60157 Millions | |
| Recent Price: 25.69 Smart Investing & Trading Score: 83 | |
| Day Percent Change: -0.15% Day Change: -0.04 | |
| Week Change: 2.9% Year-to-date Change: 9.9% | |
| BTEK Links: Profile News Message Board | |
| Charts:- Daily , Weekly | |
| Add BTEK to Watchlist: View: Get Complete BTEK Trend Analysis ➞ | |
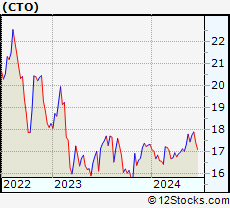 | CTO Consolidated-Tomoka Land Co. |
| Sector: Financials | |
| SubSector: Real Estate Development | |
| MarketCap: 205.119 Millions | |
| Recent Price: 17.80 Smart Investing & Trading Score: 100 | |
| Day Percent Change: -0.06% Day Change: -0.01 | |
| Week Change: 2.89% Year-to-date Change: 2.7% | |
| CTO Links: Profile News Message Board | |
| Charts:- Daily , Weekly | |
| Add CTO to Watchlist: View: Get Complete CTO Trend Analysis ➞ | |
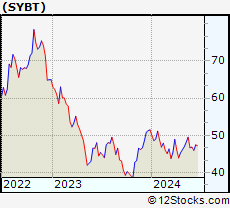 | SYBT Stock Yards Bancorp, Inc. |
| Sector: Financials | |
| SubSector: Regional - Southeast Banks | |
| MarketCap: 629.235 Millions | |
| Recent Price: 49.53 Smart Investing & Trading Score: 95 | |
| Day Percent Change: 0.94% Day Change: 0.46 | |
| Week Change: 2.89% Year-to-date Change: -3.8% | |
| SYBT Links: Profile News Message Board | |
| Charts:- Daily , Weekly | |
| Add SYBT to Watchlist: View: Get Complete SYBT Trend Analysis ➞ | |
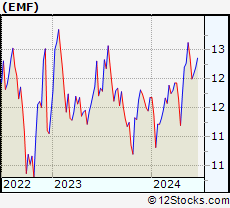 | EMF Templeton Emerging Markets Fund |
| Sector: Financials | |
| SubSector: Closed-End Fund - Foreign | |
| MarketCap: 171.047 Millions | |
| Recent Price: 12.63 Smart Investing & Trading Score: 90 | |
| Day Percent Change: -0.04% Day Change: -0.01 | |
| Week Change: 2.89% Year-to-date Change: 8.1% | |
| EMF Links: Profile News Message Board | |
| Charts:- Daily , Weekly | |
| Add EMF to Watchlist: View: Get Complete EMF Trend Analysis ➞ | |
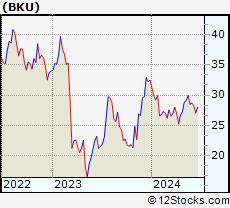 | BKU BankUnited, Inc. |
| Sector: Financials | |
| SubSector: Regional - Mid-Atlantic Banks | |
| MarketCap: 1905.99 Millions | |
| Recent Price: 29.93 Smart Investing & Trading Score: 90 | |
| Day Percent Change: -0.27% Day Change: -0.08 | |
| Week Change: 2.89% Year-to-date Change: -7.7% | |
| BKU Links: Profile News Message Board | |
| Charts:- Daily , Weekly | |
| Add BKU to Watchlist: View: Get Complete BKU Trend Analysis ➞ | |
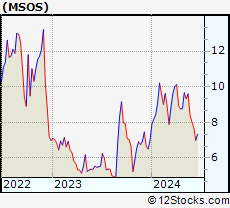 | MSOS AdvisorShares Pure US Cannabis ETF |
| Sector: Financials | |
| SubSector: Exchange Traded Fund | |
| MarketCap: 60157 Millions | |
| Recent Price: 9.60 Smart Investing & Trading Score: 71 | |
| Day Percent Change: -1.84% Day Change: -0.18 | |
| Week Change: 2.89% Year-to-date Change: 37.1% | |
| MSOS Links: Profile News Message Board | |
| Charts:- Daily , Weekly | |
| Add MSOS to Watchlist: View: Get Complete MSOS Trend Analysis ➞ | |
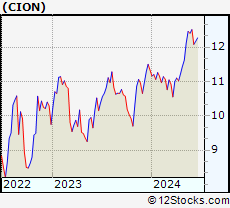 | CION CION Investment Corporation |
| Sector: Financials | |
| SubSector: Asset Management | |
| MarketCap: 563 Millions | |
| Recent Price: 12.46 Smart Investing & Trading Score: 83 | |
| Day Percent Change: 0.08% Day Change: 0.01 | |
| Week Change: 2.89% Year-to-date Change: 10.0% | |
| CION Links: Profile News Message Board | |
| Charts:- Daily , Weekly | |
| Add CION to Watchlist: View: Get Complete CION Trend Analysis ➞ | |
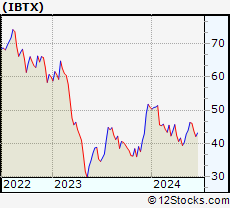 | IBTX Independent Bank Group, Inc. |
| Sector: Financials | |
| SubSector: Regional - Southeast Banks | |
| MarketCap: 1133.35 Millions | |
| Recent Price: 43.94 Smart Investing & Trading Score: 87 | |
| Day Percent Change: 1.76% Day Change: 0.76 | |
| Week Change: 2.88% Year-to-date Change: -13.6% | |
| IBTX Links: Profile News Message Board | |
| Charts:- Daily , Weekly | |
| Add IBTX to Watchlist: View: Get Complete IBTX Trend Analysis ➞ | |
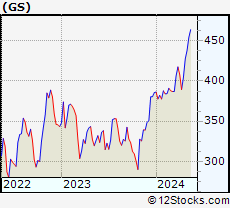 | GS The Goldman Sachs Group, Inc. |
| Sector: Financials | |
| SubSector: Investment Brokerage - National | |
| MarketCap: 54579.3 Millions | |
| Recent Price: 467.72 Smart Investing & Trading Score: 90 | |
| Day Percent Change: 0.69% Day Change: 3.20 | |
| Week Change: 2.86% Year-to-date Change: 21.2% | |
| GS Links: Profile News Message Board | |
| Charts:- Daily , Weekly | |
| Add GS to Watchlist: View: Get Complete GS Trend Analysis ➞ | |
| For tabular summary view of above stock list: Summary View ➞ 0 - 25 , 25 - 50 , 50 - 75 , 75 - 100 , 100 - 125 , 125 - 150 , 150 - 175 , 175 - 200 , 200 - 225 , 225 - 250 , 250 - 275 , 275 - 300 , 300 - 325 , 325 - 350 , 350 - 375 , 375 - 400 , 400 - 425 , 425 - 450 , 450 - 475 , 475 - 500 , 500 - 525 , 525 - 550 , 550 - 575 , 575 - 600 , 600 - 625 , 625 - 650 , 650 - 675 , 675 - 700 , 700 - 725 , 725 - 750 , 750 - 775 , 775 - 800 , 800 - 825 , 825 - 850 , 850 - 875 , 875 - 900 , 900 - 925 , 925 - 950 , 950 - 975 , 975 - 1000 , 1000 - 1025 , 1025 - 1050 , 1050 - 1075 , 1075 - 1100 , 1100 - 1125 , 1125 - 1150 , 1150 - 1175 , 1175 - 1200 , 1200 - 1225 | ||
| Click To Change The Sort Order: By Market Cap or Company Size Performance: Year-to-date, Week and Day | |
| Select Chart Type: | ||
|
Best Stocks Today 12Stocks.com |
© 2024 12Stocks.com Terms & Conditions Privacy Contact Us
All Information Provided Only For Education And Not To Be Used For Investing or Trading. See Terms & Conditions


One More Thing ... Get Best Stocks Delivered Daily!
Never Ever Miss A Move With Our Top Ten Stocks Lists
Find Best Stocks In Any Market - Bull or Bear Market
Take A Peek At Our Top Ten Stocks Lists: Daily, Weekly, Year-to-Date & Top Trends
Find Best Stocks In Any Market - Bull or Bear Market
Take A Peek At Our Top Ten Stocks Lists: Daily, Weekly, Year-to-Date & Top Trends
Financial Stocks With Best Up Trends [0-bearish to 100-bullish]: Fangdd Network[100], Xinyuan Real[100], MicroSectors Gold[100], Sprott Physical[100], Citizens & Northern[100], Sumitomo Mitsui[100], First Community[100], Chubb [100], Angel Oak[100], Sprott Physical[100], Iris Energy[100]
Best Financial Stocks Year-to-Date:
Root [526.36%], Fangdd Network[149.63%], Banco Macro[126.41%], Grupo Financiero[112.4%], Banco BBVA[110.66%], SelectQuote [110.22%], Gladstone Capital[106.92%], EverQuote [98.2%], Hippo [92.54%], Grupo Supervielle[86.95%], Vista Oil[60.93%] Best Financial Stocks This Week:
Fangdd Network[360.27%], Xinyuan Real[53.28%], Iris Energy[25.68%], Fathom [25.35%], Huize Holding[21.83%], First Foundation[18.98%], Trupanion [17.21%], Bridge [16.67%], MicroSectors Gold[15.19%], KE [13.86%], Douglas Elliman[13.56%] Best Financial Stocks Daily:
Fangdd Network[321.26%], Xinyuan Real[39.49%], MicroSectors Gold[12.02%], Fathom [9.88%], Citizens [8.53%], Hywin [8.28%], Root [6.10%], First Foundation[6.09%], Sprott Physical[6.09%], Freedom Holding[5.02%], NexGen Energy[4.99%]