
 Login Sign Up


| |||||
 |  | ||||

| 12Stocks.com Market Intelligence |
Best Financial Stocks
| In a hurry? Financial Stocks Lists: Performance Trends Table, Stock Charts
Sort Financial stocks: Daily, Weekly, Year-to-Date, Market Cap & Trends. Filter Financial stocks list by size:All Financial Large Mid-Range Small & MicroCap |
| 12Stocks.com Financial Stocks Performances & Trends Daily | |||||||||
|
|  The overall Smart Investing & Trading Score is 95 (0-bearish to 100-bullish) which puts Financial sector in short term bullish trend. The Smart Investing & Trading Score from previous trading session is 100 and a deterioration of trend continues.
| ||||||||
Here are the Smart Investing & Trading Scores of the most requested Financial stocks at 12Stocks.com (click stock name for detailed review):
|


| 12Stocks.com: Investing in Financial sector with Stocks | |
|
The following table helps investors and traders sort through current performance and trends (as measured by Smart Investing & Trading Score) of various
stocks in the Financial sector. Quick View: Move mouse or cursor over stock symbol (ticker) to view short-term Technical chart and over stock name to view long term chart. Click on  to add stock symbol to your watchlist and to add stock symbol to your watchlist and  to view watchlist. Click on any ticker or stock name for detailed market intelligence report for that stock. to view watchlist. Click on any ticker or stock name for detailed market intelligence report for that stock. |
12Stocks.com Performance of Stocks in Financial Sector
| Ticker | Stock Name | Watchlist | Category | Recent Price | Smart Investing & Trading Score | Change % | Weekly Change% |
| BBDC | Barings BDC |   | Credit Services | 9.84 | 62 | 0.20% | 1.23% |
| JOET | Virtus Terranova | | Exchange Traded Fund | 34.17 | 78 | 0.09% | 1.23% |
| CVBF | CVB | | Regional Banks | 17.43 | 83 | 0.58% | 1.22% |
| GLRE | Greenlight Capital | | Insurance | 13.26 | 95 | 1.14% | 1.22% |
| AUB | Atlantic Union | | Regional Banks | 34.37 | 100 | 1.21% | 1.22% |
| FDG | American Century | | Exchange Traded Fund | 82.77 | 78 | 0.07% | 1.21% |
| TEAF | Tortoise Essential | | Asset Mgmt | 11.92 | 95 | 0.48% | 1.21% |
| UCBI | United Community | | Regional Banks | 26.96 | 83 | 0.41% | 1.20% |
| ABCB | Ameris Bancorp | | Regional Banks | 50.45 | 90 | 0.42% | 1.20% |
| BOE | BlackRock Enhanced | | Closed-End Fund - Foreign | 10.55 | 83 | -0.09% | 1.20% |
| HTBK | Heritage Commerce | | Regional Banks | 8.50 | 100 | 1.07% | 1.19% |
| WIA | Western Asset | | Closed-End Fund - Debt | 8.11 | 70 | -0.31% | 1.19% |
| BRK.B | BERKSHIRE HTH-B | | Insurance | 416.94 | 95 | 0.92% | 1.19% |
| BRK.A | BERKSHIRE HTH-A | | Insurance | 629375.00 | 95 | 0.68% | 1.19% |
| FLV | American Century | | Exchange Traded Fund | 65.81 | 95 | 0.05% | 1.19% |
| KRC | Kilroy Realty | | REIT - Office | 34.42 | 37 | -0.95% | 1.18% |
| GLO | Clough Global | | Asset Mgmt | 5.13 | 90 | 0.00% | 1.18% |
| VPV | Invesco Pennsylvania | | Closed-End Fund - Debt | 10.33 | 95 | 0.68% | 1.18% |
| FBMS | First Bancshares | | Regional Banks | 25.80 | 90 | -0.35% | 1.18% |
| BHFAM | Brighthouse | | Insurance - Life | 16.26 | 58 | -1.39% | 1.18% |
| EVM | Eaton Vance | | Asset Mgmt | 9.55 | 90 | -0.05% | 1.17% |
| ECCC | Eagle Point | | Closed-End Fund - Debt | 22.44 | 58 | 0.49% | 1.17% |
| MBINM | Merchants Bancorp | | Banks - Regional | 26.00 | 86 | 0.39% | 1.17% |
| RLTY | Cohen & Steers s Opportunities & ome Fund | | Closed-End Fund - Debt | 13.93 | 64 | 0.80% | 1.16% |
| PMO | Putnam Municipal | | Closed-End Fund - Debt | 10.12 | 75 | -0.25% | 1.15% |
| For chart view version of above stock list: Chart View ➞ 0 - 25 , 25 - 50 , 50 - 75 , 75 - 100 , 100 - 125 , 125 - 150 , 150 - 175 , 175 - 200 , 200 - 225 , 225 - 250 , 250 - 275 , 275 - 300 , 300 - 325 , 325 - 350 , 350 - 375 , 375 - 400 , 400 - 425 , 425 - 450 , 450 - 475 , 475 - 500 , 500 - 525 , 525 - 550 , 550 - 575 , 575 - 600 , 600 - 625 , 625 - 650 , 650 - 675 , 675 - 700 , 700 - 725 , 725 - 750 , 750 - 775 , 775 - 800 , 800 - 825 , 825 - 850 , 850 - 875 , 875 - 900 , 900 - 925 , 925 - 950 , 950 - 975 , 975 - 1000 , 1000 - 1025 , 1025 - 1050 , 1050 - 1075 , 1075 - 1100 , 1100 - 1125 , 1125 - 1150 , 1150 - 1175 , 1175 - 1200 , 1200 - 1225 | ||
 | Click To Change The Sort Order: By Market Cap or Company Size Performance: Year-to-date, Week and Day |  |
|
Get the most comprehensive stock market coverage daily at 12Stocks.com ➞ Best Stocks Today ➞ Best Stocks Weekly ➞ Best Stocks Year-to-Date ➞ Best Stocks Trends ➞  Best Stocks Today 12Stocks.com Best Nasdaq Stocks ➞ Best S&P 500 Stocks ➞ Best Tech Stocks ➞ Best Biotech Stocks ➞ |
| Detailed Overview of Financial Stocks |
| Financial Technical Overview, Leaders & Laggards, Top Financial ETF Funds & Detailed Financial Stocks List, Charts, Trends & More |
| Financial Sector: Technical Analysis, Trends & YTD Performance | |
| Financial sector is composed of stocks
from banks, brokers, insurance, REITs
and services subsectors. Financial sector, as represented by XLF, an exchange-traded fund [ETF] that holds basket of Financial stocks (e.g, Bank of America, Goldman Sachs) is up by 13.01% and is currently outperforming the overall market by 2.44% year-to-date. Below is a quick view of Technical charts and trends: |
|
 XLF Weekly Chart |
|
| Long Term Trend: Very Good | |
| Medium Term Trend: Very Good | |
 XLF Daily Chart |
|
| Short Term Trend: Very Good | |
| Overall Trend Score: 95 | |
| YTD Performance: 13.01% | |
| **Trend Scores & Views Are Only For Educational Purposes And Not For Investing | |
| 12Stocks.com: Top Performing Financial Sector Stocks | ||||||||||||||||||||||||||||||||||||||||||||||||
 The top performing Financial sector stocks year to date are
Now, more recently, over last week, the top performing Financial sector stocks on the move are


|
||||||||||||||||||||||||||||||||||||||||||||||||
| 12Stocks.com: Investing in Financial Sector using Exchange Traded Funds | |
|
The following table shows list of key exchange traded funds (ETF) that
help investors track Financial Index. For detailed view, check out our ETF Funds section of our website. Quick View: Move mouse or cursor over ETF symbol (ticker) to view short-term Technical chart and over ETF name to view long term chart. Click on ticker or stock name for detailed view. Click on to add stock symbol to your watchlist and to view watchlist. |
12Stocks.com List of ETFs that track Financial Index
| Ticker | ETF Name | Watchlist | Recent Price | Smart Investing & Trading Score | Change % | Week % | Year-to-date % |
| XLF | Financial | | 42.49 | 95 | 0.73 | 1.58 | 13.01% |
| IAI | Broker-Dealers & Secs | | 119.47 | 100 | 1.08 | 2.59 | 10.08% |
| IYF | Financials | | 96.85 | 95 | 0.43 | 1.73 | 13.39% |
| IYG | Financial Services | | 67.11 | 95 | 0.15 | 1.56 | 12.34% |
| KRE | Regional Banking | | 51.19 | 83 | 0.23 | 1.67 | -2.37% |
| IXG | Global Financials | | 88.72 | 88 | 0.21 | 1.41 | 12.91% |
| VFH | Financials | | 103.00 | 95 | 0.18 | 1.45 | 11.64% |
| KBE | Bank | | 47.93 | 83 | 0.44 | 1.25 | 4.15% |
| FAS | Financial Bull 3X | | 112.32 | 95 | 1.81 | 4.06 | 35.9% |
| FAZ | Financial Bear 3X | | 9.75 | 10 | -1.71 | -3.75 | -28.68% |
| UYG | Financials | | 68.54 | 100 | 1.23 | 2.77 | 24.17% |
| IAT | Regional Banks | | 43.42 | 76 | -0.26 | 1.02 | 3.78% |
| KIE | Insurance | | 51.83 | 100 | 0.88 | 1.09 | 14.62% |
| PSCF | SmallCap Financials | | 49.03 | 95 | 0.28 | 1.44 | -0.31% |
| EUFN | Europe Financials | | 24.13 | 95 | 0.67 | 2.51 | 15.12% |
| PGF | Financial Preferred | | 14.81 | 52 | -0.10 | 0.68 | 1.58% |
| 12Stocks.com: Charts, Trends, Fundamental Data and Performances of Financial Stocks | |
|
We now take in-depth look at all Financial stocks including charts, multi-period performances and overall trends (as measured by Smart Investing & Trading Score). One can sort Financial stocks (click link to choose) by Daily, Weekly and by Year-to-Date performances. Also, one can sort by size of the company or by market capitalization. |
| Select Your Default Chart Type: | |||||
| |||||
| Click on stock symbol or name for detailed view. Click on to add stock symbol to your watchlist and to view watchlist. Quick View: Move mouse or cursor over "Daily" to quickly view daily Technical stock chart and over "Weekly" to view weekly Technical stock chart. | |||||

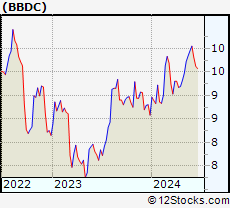 | BBDC Barings BDC, Inc. |
| Sector: Financials | |
| SubSector: Credit Services | |
| MarketCap: 332.308 Millions | |
| Recent Price: 9.84 Smart Investing & Trading Score: 62 | |
| Day Percent Change: 0.20% Day Change: 0.02 | |
| Week Change: 1.23% Year-to-date Change: 14.7% | |
| BBDC Links: Profile News Message Board | |
| Charts:- Daily , Weekly | |
| Add BBDC to Watchlist: View: Get Complete BBDC Trend Analysis ➞ | |
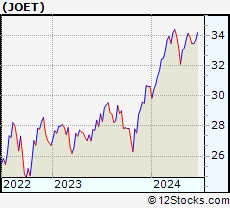 | JOET Virtus Terranova U.S. Quality Momentum ETF |
| Sector: Financials | |
| SubSector: Exchange Traded Fund | |
| MarketCap: 60157 Millions | |
| Recent Price: 34.17 Smart Investing & Trading Score: 78 | |
| Day Percent Change: 0.09% Day Change: 0.03 | |
| Week Change: 1.23% Year-to-date Change: 11.5% | |
| JOET Links: Profile News Message Board | |
| Charts:- Daily , Weekly | |
| Add JOET to Watchlist: View: Get Complete JOET Trend Analysis ➞ | |
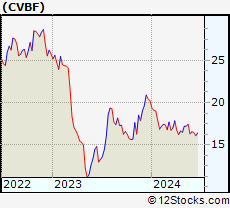 | CVBF CVB Financial Corp. |
| Sector: Financials | |
| SubSector: Regional - Pacific Banks | |
| MarketCap: 2699.99 Millions | |
| Recent Price: 17.43 Smart Investing & Trading Score: 83 | |
| Day Percent Change: 0.58% Day Change: 0.10 | |
| Week Change: 1.22% Year-to-date Change: -13.7% | |
| CVBF Links: Profile News Message Board | |
| Charts:- Daily , Weekly | |
| Add CVBF to Watchlist: View: Get Complete CVBF Trend Analysis ➞ | |
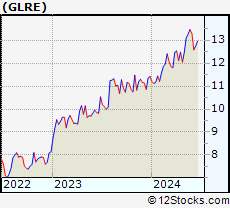 | GLRE Greenlight Capital Re, Ltd. |
| Sector: Financials | |
| SubSector: Accident & Health Insurance | |
| MarketCap: 228.66 Millions | |
| Recent Price: 13.26 Smart Investing & Trading Score: 95 | |
| Day Percent Change: 1.14% Day Change: 0.15 | |
| Week Change: 1.22% Year-to-date Change: 16.1% | |
| GLRE Links: Profile News Message Board | |
| Charts:- Daily , Weekly | |
| Add GLRE to Watchlist: View: Get Complete GLRE Trend Analysis ➞ | |
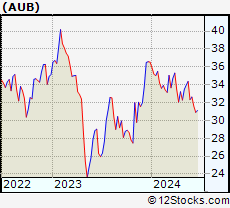 | AUB Atlantic Union Bankshares Corporation |
| Sector: Financials | |
| SubSector: Regional - Mid-Atlantic Banks | |
| MarketCap: 1728.79 Millions | |
| Recent Price: 34.37 Smart Investing & Trading Score: 100 | |
| Day Percent Change: 1.21% Day Change: 0.41 | |
| Week Change: 1.22% Year-to-date Change: -5.9% | |
| AUB Links: Profile News Message Board | |
| Charts:- Daily , Weekly | |
| Add AUB to Watchlist: View: Get Complete AUB Trend Analysis ➞ | |
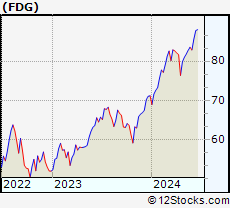 | FDG American Century Focused Dynamic Growth ETF |
| Sector: Financials | |
| SubSector: Exchange Traded Fund | |
| MarketCap: 60157 Millions | |
| Recent Price: 82.77 Smart Investing & Trading Score: 78 | |
| Day Percent Change: 0.07% Day Change: 0.06 | |
| Week Change: 1.21% Year-to-date Change: 16.3% | |
| FDG Links: Profile News Message Board | |
| Charts:- Daily , Weekly | |
| Add FDG to Watchlist: View: Get Complete FDG Trend Analysis ➞ | |
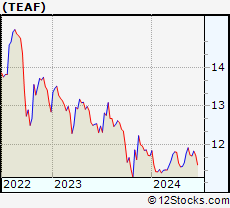 | TEAF Tortoise Essential Assets Income Term Fund |
| Sector: Financials | |
| SubSector: Asset Management | |
| MarketCap: 123.103 Millions | |
| Recent Price: 11.92 Smart Investing & Trading Score: 95 | |
| Day Percent Change: 0.48% Day Change: 0.06 | |
| Week Change: 1.21% Year-to-date Change: 1.8% | |
| TEAF Links: Profile News Message Board | |
| Charts:- Daily , Weekly | |
| Add TEAF to Watchlist: View: Get Complete TEAF Trend Analysis ➞ | |
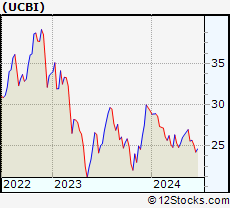 | UCBI United Community Banks, Inc. |
| Sector: Financials | |
| SubSector: Regional - Mid-Atlantic Banks | |
| MarketCap: 1593.99 Millions | |
| Recent Price: 26.96 Smart Investing & Trading Score: 83 | |
| Day Percent Change: 0.41% Day Change: 0.11 | |
| Week Change: 1.2% Year-to-date Change: -7.9% | |
| UCBI Links: Profile News Message Board | |
| Charts:- Daily , Weekly | |
| Add UCBI to Watchlist: View: Get Complete UCBI Trend Analysis ➞ | |
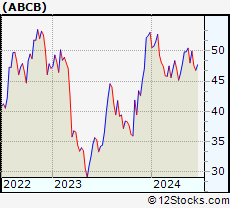 | ABCB Ameris Bancorp |
| Sector: Financials | |
| SubSector: Regional - Mid-Atlantic Banks | |
| MarketCap: 1537.79 Millions | |
| Recent Price: 50.45 Smart Investing & Trading Score: 90 | |
| Day Percent Change: 0.42% Day Change: 0.21 | |
| Week Change: 1.2% Year-to-date Change: -4.9% | |
| ABCB Links: Profile News Message Board | |
| Charts:- Daily , Weekly | |
| Add ABCB to Watchlist: View: Get Complete ABCB Trend Analysis ➞ | |
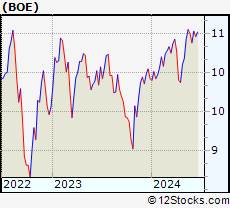 | BOE BlackRock Enhanced Global Dividend Trust |
| Sector: Financials | |
| SubSector: Closed-End Fund - Foreign | |
| MarketCap: 494.847 Millions | |
| Recent Price: 10.55 Smart Investing & Trading Score: 83 | |
| Day Percent Change: -0.09% Day Change: -0.01 | |
| Week Change: 1.2% Year-to-date Change: 6.4% | |
| BOE Links: Profile News Message Board | |
| Charts:- Daily , Weekly | |
| Add BOE to Watchlist: View: Get Complete BOE Trend Analysis ➞ | |
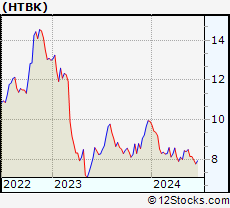 | HTBK Heritage Commerce Corp |
| Sector: Financials | |
| SubSector: Regional - Pacific Banks | |
| MarketCap: 416.129 Millions | |
| Recent Price: 8.50 Smart Investing & Trading Score: 100 | |
| Day Percent Change: 1.07% Day Change: 0.09 | |
| Week Change: 1.19% Year-to-date Change: -14.3% | |
| HTBK Links: Profile News Message Board | |
| Charts:- Daily , Weekly | |
| Add HTBK to Watchlist: View: Get Complete HTBK Trend Analysis ➞ | |
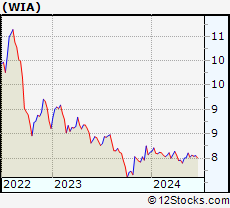 | WIA Western Asset Inflation-Linked Income Fund |
| Sector: Financials | |
| SubSector: Closed-End Fund - Debt | |
| MarketCap: 279.207 Millions | |
| Recent Price: 8.11 Smart Investing & Trading Score: 70 | |
| Day Percent Change: -0.31% Day Change: -0.03 | |
| Week Change: 1.19% Year-to-date Change: -0.2% | |
| WIA Links: Profile News Message Board | |
| Charts:- Daily , Weekly | |
| Add WIA to Watchlist: View: Get Complete WIA Trend Analysis ➞ | |
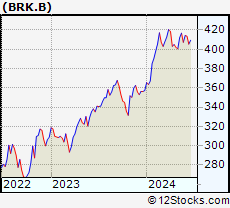 | BRK.B BERKSHIRE HTH-B |
| Sector: Financials | |
| SubSector: Insurance | |
| MarketCap: 56804 Millions | |
| Recent Price: 416.94 Smart Investing & Trading Score: 95 | |
| Day Percent Change: 0.92% Day Change: 3.82 | |
| Week Change: 1.19% Year-to-date Change: 16.7% | |
| BRK.B Links: Profile News Message Board | |
| Charts:- Daily , Weekly | |
| Add BRK.B to Watchlist: View: Get Complete BRK.B Trend Analysis ➞ | |
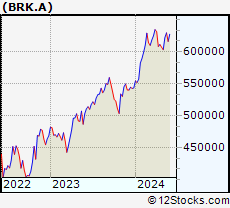 | BRK.A BERKSHIRE HTH-A |
| Sector: Financials | |
| SubSector: Insurance | |
| MarketCap: 135003 Millions | |
| Recent Price: 629375.00 Smart Investing & Trading Score: 95 | |
| Day Percent Change: 0.68% Day Change: 4275.00 | |
| Week Change: 1.19% Year-to-date Change: 15.8% | |
| BRK.A Links: Profile News Message Board | |
| Charts:- Daily , Weekly | |
| Add BRK.A to Watchlist: View: Get Complete BRK.A Trend Analysis ➞ | |
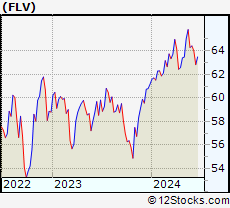 | FLV American Century Focused Large Cap Value ETF |
| Sector: Financials | |
| SubSector: Exchange Traded Fund | |
| MarketCap: 60157 Millions | |
| Recent Price: 65.81 Smart Investing & Trading Score: 95 | |
| Day Percent Change: 0.05% Day Change: 0.04 | |
| Week Change: 1.19% Year-to-date Change: 7.6% | |
| FLV Links: Profile News Message Board | |
| Charts:- Daily , Weekly | |
| Add FLV to Watchlist: View: Get Complete FLV Trend Analysis ➞ | |
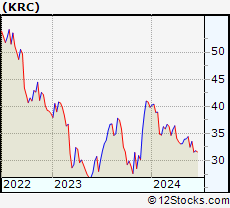 | KRC Kilroy Realty Corporation |
| Sector: Financials | |
| SubSector: REIT - Office | |
| MarketCap: 6390.46 Millions | |
| Recent Price: 34.42 Smart Investing & Trading Score: 37 | |
| Day Percent Change: -0.95% Day Change: -0.33 | |
| Week Change: 1.18% Year-to-date Change: -13.6% | |
| KRC Links: Profile News Message Board | |
| Charts:- Daily , Weekly | |
| Add KRC to Watchlist: View: Get Complete KRC Trend Analysis ➞ | |
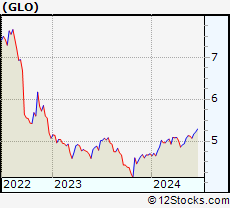 | GLO Clough Global Opportunities Fund |
| Sector: Financials | |
| SubSector: Asset Management | |
| MarketCap: 202.303 Millions | |
| Recent Price: 5.13 Smart Investing & Trading Score: 90 | |
| Day Percent Change: 0.00% Day Change: 0.00 | |
| Week Change: 1.18% Year-to-date Change: 9.2% | |
| GLO Links: Profile News Message Board | |
| Charts:- Daily , Weekly | |
| Add GLO to Watchlist: View: Get Complete GLO Trend Analysis ➞ | |
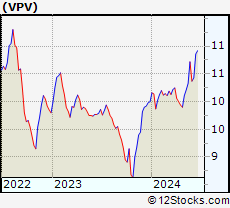 | VPV Invesco Pennsylvania Value Municipal Income Trust |
| Sector: Financials | |
| SubSector: Closed-End Fund - Debt | |
| MarketCap: 250.407 Millions | |
| Recent Price: 10.33 Smart Investing & Trading Score: 95 | |
| Day Percent Change: 0.68% Day Change: 0.07 | |
| Week Change: 1.18% Year-to-date Change: 3.3% | |
| VPV Links: Profile News Message Board | |
| Charts:- Daily , Weekly | |
| Add VPV to Watchlist: View: Get Complete VPV Trend Analysis ➞ | |
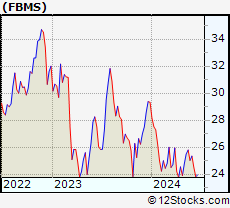 | FBMS The First Bancshares, Inc. |
| Sector: Financials | |
| SubSector: Regional - Southeast Banks | |
| MarketCap: 359.535 Millions | |
| Recent Price: 25.80 Smart Investing & Trading Score: 90 | |
| Day Percent Change: -0.35% Day Change: -0.09 | |
| Week Change: 1.18% Year-to-date Change: -12.0% | |
| FBMS Links: Profile News Message Board | |
| Charts:- Daily , Weekly | |
| Add FBMS to Watchlist: View: Get Complete FBMS Trend Analysis ➞ | |
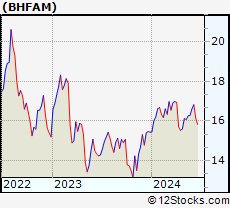 | BHFAM Brighthouse Financial, Inc. |
| Sector: Financials | |
| SubSector: Insurance - Life | |
| MarketCap: 3170 Millions | |
| Recent Price: 16.26 Smart Investing & Trading Score: 58 | |
| Day Percent Change: -1.39% Day Change: -0.23 | |
| Week Change: 1.18% Year-to-date Change: 5.3% | |
| BHFAM Links: Profile News Message Board | |
| Charts:- Daily , Weekly | |
| Add BHFAM to Watchlist: View: Get Complete BHFAM Trend Analysis ➞ | |
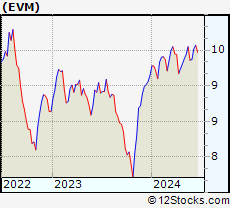 | EVM Eaton Vance California Municipal Bond Fund |
| Sector: Financials | |
| SubSector: Asset Management | |
| MarketCap: 243.903 Millions | |
| Recent Price: 9.55 Smart Investing & Trading Score: 90 | |
| Day Percent Change: -0.05% Day Change: 0.00 | |
| Week Change: 1.17% Year-to-date Change: 4.4% | |
| EVM Links: Profile News Message Board | |
| Charts:- Daily , Weekly | |
| Add EVM to Watchlist: View: Get Complete EVM Trend Analysis ➞ | |
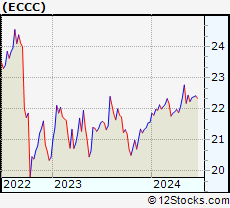 | ECCC Eagle Point Credit Company Inc. |
| Sector: Financials | |
| SubSector: Closed-End Fund - Debt | |
| MarketCap: 592 Millions | |
| Recent Price: 22.44 Smart Investing & Trading Score: 58 | |
| Day Percent Change: 0.49% Day Change: 0.11 | |
| Week Change: 1.17% Year-to-date Change: 4.0% | |
| ECCC Links: Profile News Message Board | |
| Charts:- Daily , Weekly | |
| Add ECCC to Watchlist: View: Get Complete ECCC Trend Analysis ➞ | |
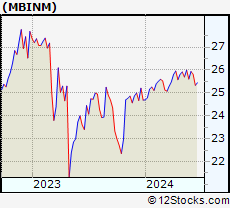 | MBINM Merchants Bancorp |
| Sector: Financials | |
| SubSector: Banks - Regional | |
| MarketCap: 1110 Millions | |
| Recent Price: 26.00 Smart Investing & Trading Score: 86 | |
| Day Percent Change: 0.39% Day Change: 0.10 | |
| Week Change: 1.17% Year-to-date Change: 5.3% | |
| MBINM Links: Profile News Message Board | |
| Charts:- Daily , Weekly | |
| Add MBINM to Watchlist: View: Get Complete MBINM Trend Analysis ➞ | |
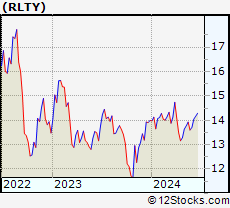 | RLTY Cohen & Steers Financials Opportunities & Income Fund |
| Sector: Financials | |
| SubSector: Closed-End Fund - Debt | |
| MarketCap: 231 Millions | |
| Recent Price: 13.93 Smart Investing & Trading Score: 64 | |
| Day Percent Change: 0.80% Day Change: 0.11 | |
| Week Change: 1.16% Year-to-date Change: -0.5% | |
| RLTY Links: Profile News Message Board | |
| Charts:- Daily , Weekly | |
| Add RLTY to Watchlist: View: Get Complete RLTY Trend Analysis ➞ | |
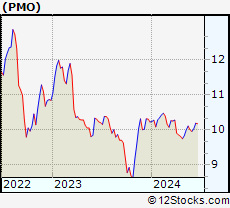 | PMO Putnam Municipal Opportunities Trust |
| Sector: Financials | |
| SubSector: Closed-End Fund - Debt | |
| MarketCap: 377.507 Millions | |
| Recent Price: 10.12 Smart Investing & Trading Score: 75 | |
| Day Percent Change: -0.25% Day Change: -0.03 | |
| Week Change: 1.15% Year-to-date Change: -1.1% | |
| PMO Links: Profile News Message Board | |
| Charts:- Daily , Weekly | |
| Add PMO to Watchlist: View: Get Complete PMO Trend Analysis ➞ | |
| For tabular summary view of above stock list: Summary View ➞ 0 - 25 , 25 - 50 , 50 - 75 , 75 - 100 , 100 - 125 , 125 - 150 , 150 - 175 , 175 - 200 , 200 - 225 , 225 - 250 , 250 - 275 , 275 - 300 , 300 - 325 , 325 - 350 , 350 - 375 , 375 - 400 , 400 - 425 , 425 - 450 , 450 - 475 , 475 - 500 , 500 - 525 , 525 - 550 , 550 - 575 , 575 - 600 , 600 - 625 , 625 - 650 , 650 - 675 , 675 - 700 , 700 - 725 , 725 - 750 , 750 - 775 , 775 - 800 , 800 - 825 , 825 - 850 , 850 - 875 , 875 - 900 , 900 - 925 , 925 - 950 , 950 - 975 , 975 - 1000 , 1000 - 1025 , 1025 - 1050 , 1050 - 1075 , 1075 - 1100 , 1100 - 1125 , 1125 - 1150 , 1150 - 1175 , 1175 - 1200 , 1200 - 1225 | ||
| Click To Change The Sort Order: By Market Cap or Company Size Performance: Year-to-date, Week and Day | |
| Select Chart Type: | ||
|
Best Stocks Today 12Stocks.com |
© 2024 12Stocks.com Terms & Conditions Privacy Contact Us
All Information Provided Only For Education And Not To Be Used For Investing or Trading. See Terms & Conditions


One More Thing ... Get Best Stocks Delivered Daily!
Never Ever Miss A Move With Our Top Ten Stocks Lists
Find Best Stocks In Any Market - Bull or Bear Market
Take A Peek At Our Top Ten Stocks Lists: Daily, Weekly, Year-to-Date & Top Trends
Find Best Stocks In Any Market - Bull or Bear Market
Take A Peek At Our Top Ten Stocks Lists: Daily, Weekly, Year-to-Date & Top Trends
Financial Stocks With Best Up Trends [0-bearish to 100-bullish]: Fangdd Network[100], Xinyuan Real[100], MicroSectors Gold[100], Sprott Physical[100], Citizens & Northern[100], Sumitomo Mitsui[100], First Community[100], Chubb [100], Angel Oak[100], Sprott Physical[100], Iris Energy[100]
Best Financial Stocks Year-to-Date:
Root [526.36%], Fangdd Network[149.63%], Banco Macro[126.41%], Grupo Financiero[112.4%], Banco BBVA[110.66%], SelectQuote [110.22%], Gladstone Capital[106.92%], EverQuote [98.2%], Hippo [92.54%], Grupo Supervielle[86.95%], Vista Oil[60.93%] Best Financial Stocks This Week:
Fangdd Network[360.27%], Xinyuan Real[53.28%], Iris Energy[25.68%], Fathom [25.35%], Huize Holding[21.83%], First Foundation[18.98%], Trupanion [17.21%], Bridge [16.67%], MicroSectors Gold[15.19%], KE [13.86%], Douglas Elliman[13.56%] Best Financial Stocks Daily:
Fangdd Network[321.26%], Xinyuan Real[39.49%], MicroSectors Gold[12.02%], Fathom [9.88%], Citizens [8.53%], Hywin [8.28%], Root [6.10%], First Foundation[6.09%], Sprott Physical[6.09%], Freedom Holding[5.02%], NexGen Energy[4.99%]