
 Login Sign Up


| |||||
 |  | ||||

| 12Stocks.com Market Intelligence |
Best Financial Stocks
| In a hurry? Financial Stocks Lists: Performance Trends Table, Stock Charts
Sort Financial stocks: Daily, Weekly, Year-to-Date, Market Cap & Trends. Filter Financial stocks list by size:All Financial Large Mid-Range Small & MicroCap |
| 12Stocks.com Financial Stocks Performances & Trends Daily | |||||||||
|
|  The overall Smart Investing & Trading Score is 95 (0-bearish to 100-bullish) which puts Financial sector in short term bullish trend. The Smart Investing & Trading Score from previous trading session is 100 and a deterioration of trend continues.
| ||||||||
Here are the Smart Investing & Trading Scores of the most requested Financial stocks at 12Stocks.com (click stock name for detailed review):
|


| 12Stocks.com: Investing in Financial sector with Stocks | |
|
The following table helps investors and traders sort through current performance and trends (as measured by Smart Investing & Trading Score) of various
stocks in the Financial sector. Quick View: Move mouse or cursor over stock symbol (ticker) to view short-term Technical chart and over stock name to view long term chart. Click on  to add stock symbol to your watchlist and to add stock symbol to your watchlist and  to view watchlist. Click on any ticker or stock name for detailed market intelligence report for that stock. to view watchlist. Click on any ticker or stock name for detailed market intelligence report for that stock. |
12Stocks.com Performance of Stocks in Financial Sector
| Ticker | Stock Name | Watchlist | Category | Recent Price | Smart Investing & Trading Score | Change % | Weekly Change% |
| AESR | Anfield U.S. |   | Exchange Traded Fund | 15.75 | 88 | 0.19% | 1.88% |
| STT | State Street | | Asset Mgmt | 78.01 | 95 | 0.49% | 1.87% |
| PLYM | Plymouth Industrial | | REIT - Industrial | 21.26 | 64 | -0.70% | 1.87% |
| PDLB | PDL Community | | REIT - Retail | 8.78 | 70 | 0.69% | 1.86% |
| NHI | National Health | | REIT | 66.51 | 83 | -0.20% | 1.85% |
| INBK | First Internet | | Regional Banks | 32.56 | 88 | 2.33% | 1.85% |
| AWP | Aberdeen Global | | Closed-End Fund - Foreign | 3.88 | 83 | 0.00% | 1.84% |
| VOYA | Voya | | Asset Mgmt | 74.80 | 95 | 1.37% | 1.84% |
| QQQJ | Invesco NASDAQ | | Exchange Traded Fund | 28.28 | 63 | -0.21% | 1.84% |
| AMTB | Amerant Bancorp | | Regional Banks | 23.34 | 88 | 0.60% | 1.83% |
| STLG | iShares Factors | | Exchange Traded Fund | 48.49 | 78 | -0.12% | 1.83% |
| SOR | Source Capital | | Closed-End Fund - Equity | 43.09 | 88 | -1.40% | 1.82% |
| BK | Bank of New York | | Asset Mgmt | 59.50 | 100 | 1.24% | 1.81% |
| WHG | Westwood | | Asset Mgmt | 12.35 | 70 | 0.65% | 1.81% |
| HQL | Tekla Life | | Closed-End Fund - Equity | 14.10 | 76 | -1.19% | 1.81% |
| NIE | AllianzGI Equity | | Asset Mgmt | 22.59 | 88 | 0.09% | 1.80% |
| STK | Columbia Seligman | | Exchange Traded Fund | 31.72 | 52 | -0.06% | 1.80% |
| ALLY | Ally | | Mortgage | 40.12 | 63 | -0.64% | 1.80% |
| GTY | Getty Realty | | REIT - Retail | 28.45 | 90 | -0.07% | 1.79% |
| DWUS | AdvisorShares Dorsey | | Exchange Traded Fund | 44.60 | 78 | -0.41% | 1.79% |
| DX | Dynex Capital | | Mortgage | 12.61 | 90 | 0.32% | 1.78% |
| FMAO | Farmers & Merchants Bancorp | | Regional Banks | 22.86 | 83 | 0.40% | 1.78% |
| BKLC | BNY | | Exchange Traded Fund | 100.76 | 83 | 0.16% | 1.78% |
| RF | Regions | | Regional Banks | 20.18 | 76 | 0.40% | 1.77% |
| UBSI | United Bankshares | | Regional Banks | 35.02 | 100 | 1.01% | 1.77% |
| For chart view version of above stock list: Chart View ➞ 0 - 25 , 25 - 50 , 50 - 75 , 75 - 100 , 100 - 125 , 125 - 150 , 150 - 175 , 175 - 200 , 200 - 225 , 225 - 250 , 250 - 275 , 275 - 300 , 300 - 325 , 325 - 350 , 350 - 375 , 375 - 400 , 400 - 425 , 425 - 450 , 450 - 475 , 475 - 500 , 500 - 525 , 525 - 550 , 550 - 575 , 575 - 600 , 600 - 625 , 625 - 650 , 650 - 675 , 675 - 700 , 700 - 725 , 725 - 750 , 750 - 775 , 775 - 800 , 800 - 825 , 825 - 850 , 850 - 875 , 875 - 900 , 900 - 925 , 925 - 950 , 950 - 975 , 975 - 1000 , 1000 - 1025 , 1025 - 1050 , 1050 - 1075 , 1075 - 1100 , 1100 - 1125 , 1125 - 1150 , 1150 - 1175 , 1175 - 1200 , 1200 - 1225 | ||
 | Click To Change The Sort Order: By Market Cap or Company Size Performance: Year-to-date, Week and Day |  |
|
Get the most comprehensive stock market coverage daily at 12Stocks.com ➞ Best Stocks Today ➞ Best Stocks Weekly ➞ Best Stocks Year-to-Date ➞ Best Stocks Trends ➞  Best Stocks Today 12Stocks.com Best Nasdaq Stocks ➞ Best S&P 500 Stocks ➞ Best Tech Stocks ➞ Best Biotech Stocks ➞ |
| Detailed Overview of Financial Stocks |
| Financial Technical Overview, Leaders & Laggards, Top Financial ETF Funds & Detailed Financial Stocks List, Charts, Trends & More |
| Financial Sector: Technical Analysis, Trends & YTD Performance | |
| Financial sector is composed of stocks
from banks, brokers, insurance, REITs
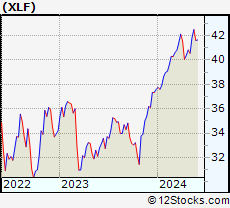
and services subsectors. Financial sector, as represented by XLF, an exchange-traded fund [ETF] that holds basket of Financial stocks (e.g, Bank of America, Goldman Sachs) is up by 13.01% and is currently outperforming the overall market by 2.44% year-to-date. Below is a quick view of Technical charts and trends: |
|
 XLF Weekly Chart |
|
| Long Term Trend: Very Good | |
| Medium Term Trend: Very Good | |
 XLF Daily Chart |
|
| Short Term Trend: Very Good | |
| Overall Trend Score: 95 | |
| YTD Performance: 13.01% | |
| **Trend Scores & Views Are Only For Educational Purposes And Not For Investing | |
| 12Stocks.com: Top Performing Financial Sector Stocks | ||||||||||||||||||||||||||||||||||||||||||||||||
 The top performing Financial sector stocks year to date are
Now, more recently, over last week, the top performing Financial sector stocks on the move are


|
||||||||||||||||||||||||||||||||||||||||||||||||
| 12Stocks.com: Investing in Financial Sector using Exchange Traded Funds | |
|
The following table shows list of key exchange traded funds (ETF) that
help investors track Financial Index. For detailed view, check out our ETF Funds section of our website. Quick View: Move mouse or cursor over ETF symbol (ticker) to view short-term Technical chart and over ETF name to view long term chart. Click on ticker or stock name for detailed view. Click on to add stock symbol to your watchlist and to view watchlist. |
12Stocks.com List of ETFs that track Financial Index
| Ticker | ETF Name | Watchlist | Recent Price | Smart Investing & Trading Score | Change % | Week % | Year-to-date % |
| XLF | Financial | | 42.49 | 95 | 0.73 | 1.58 | 13.01% |
| IAI | Broker-Dealers & Secs | | 119.47 | 100 | 1.08 | 2.59 | 10.08% |
| IYF | Financials | | 96.85 | 95 | 0.43 | 1.73 | 13.39% |
| IYG | Financial Services | | 67.11 | 95 | 0.15 | 1.56 | 12.34% |
| KRE | Regional Banking | | 51.19 | 83 | 0.23 | 1.67 | -2.37% |
| IXG | Global Financials | | 88.72 | 88 | 0.21 | 1.41 | 12.91% |
| VFH | Financials | | 103.00 | 95 | 0.18 | 1.45 | 11.64% |
| KBE | Bank | | 47.93 | 83 | 0.44 | 1.25 | 4.15% |
| FAS | Financial Bull 3X | | 112.32 | 95 | 1.81 | 4.06 | 35.9% |
| FAZ | Financial Bear 3X | | 9.75 | 10 | -1.71 | -3.75 | -28.68% |
| UYG | Financials | | 68.54 | 100 | 1.23 | 2.77 | 24.17% |
| IAT | Regional Banks | | 43.42 | 76 | -0.26 | 1.02 | 3.78% |
| KIE | Insurance | | 51.83 | 100 | 0.88 | 1.09 | 14.62% |
| PSCF | SmallCap Financials | | 49.03 | 95 | 0.28 | 1.44 | -0.31% |
| EUFN | Europe Financials | | 24.13 | 95 | 0.67 | 2.51 | 15.12% |
| PGF | Financial Preferred | | 14.81 | 52 | -0.10 | 0.68 | 1.58% |
| 12Stocks.com: Charts, Trends, Fundamental Data and Performances of Financial Stocks | |
|
We now take in-depth look at all Financial stocks including charts, multi-period performances and overall trends (as measured by Smart Investing & Trading Score). One can sort Financial stocks (click link to choose) by Daily, Weekly and by Year-to-Date performances. Also, one can sort by size of the company or by market capitalization. |
| Select Your Default Chart Type: | |||||
| |||||
| Click on stock symbol or name for detailed view. Click on to add stock symbol to your watchlist and to view watchlist. Quick View: Move mouse or cursor over "Daily" to quickly view daily Technical stock chart and over "Weekly" to view weekly Technical stock chart. | |||||

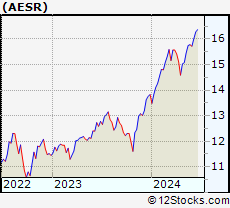 | AESR Anfield U.S. Equity Sector Rotation ETF |
| Sector: Financials | |
| SubSector: Exchange Traded Fund | |
| MarketCap: 60157 Millions | |
| Recent Price: 15.75 Smart Investing & Trading Score: 88 | |
| Day Percent Change: 0.19% Day Change: 0.03 | |
| Week Change: 1.88% Year-to-date Change: 13.9% | |
| AESR Links: Profile News Message Board | |
| Charts:- Daily , Weekly | |
| Add AESR to Watchlist: View: Get Complete AESR Trend Analysis ➞ | |
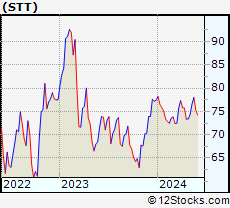 | STT State Street Corporation |
| Sector: Financials | |
| SubSector: Asset Management | |
| MarketCap: 18623 Millions | |
| Recent Price: 78.01 Smart Investing & Trading Score: 95 | |
| Day Percent Change: 0.49% Day Change: 0.38 | |
| Week Change: 1.87% Year-to-date Change: 0.7% | |
| STT Links: Profile News Message Board | |
| Charts:- Daily , Weekly | |
| Add STT to Watchlist: View: Get Complete STT Trend Analysis ➞ | |
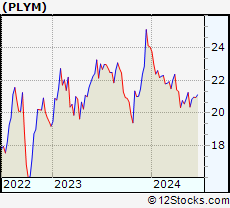 | PLYM Plymouth Industrial REIT, Inc. |
| Sector: Financials | |
| SubSector: REIT - Industrial | |
| MarketCap: 153.449 Millions | |
| Recent Price: 21.26 Smart Investing & Trading Score: 64 | |
| Day Percent Change: -0.70% Day Change: -0.15 | |
| Week Change: 1.87% Year-to-date Change: -11.7% | |
| PLYM Links: Profile News Message Board | |
| Charts:- Daily , Weekly | |
| Add PLYM to Watchlist: View: Get Complete PLYM Trend Analysis ➞ | |
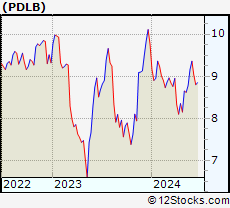 | PDLB PDL Community Bancorp |
| Sector: Financials | |
| SubSector: REIT - Retail | |
| MarketCap: 206.114 Millions | |
| Recent Price: 8.78 Smart Investing & Trading Score: 70 | |
| Day Percent Change: 0.69% Day Change: 0.06 | |
| Week Change: 1.86% Year-to-date Change: -10.0% | |
| PDLB Links: Profile News Message Board | |
| Charts:- Daily , Weekly | |
| Add PDLB to Watchlist: View: Get Complete PDLB Trend Analysis ➞ | |
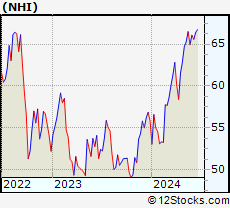 | NHI National Health Investors, Inc. |
| Sector: Financials | |
| SubSector: REIT - Healthcare Facilities | |
| MarketCap: 2156.54 Millions | |
| Recent Price: 66.51 Smart Investing & Trading Score: 83 | |
| Day Percent Change: -0.20% Day Change: -0.13 | |
| Week Change: 1.85% Year-to-date Change: 19.1% | |
| NHI Links: Profile News Message Board | |
| Charts:- Daily , Weekly | |
| Add NHI to Watchlist: View: Get Complete NHI Trend Analysis ➞ | |
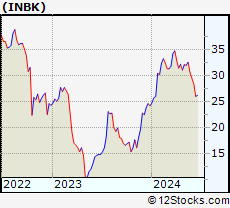 | INBK First Internet Bancorp |
| Sector: Financials | |
| SubSector: Regional - Midwest Banks | |
| MarketCap: 149.07 Millions | |
| Recent Price: 32.56 Smart Investing & Trading Score: 88 | |
| Day Percent Change: 2.33% Day Change: 0.74 | |
| Week Change: 1.85% Year-to-date Change: 34.6% | |
| INBK Links: Profile News Message Board | |
| Charts:- Daily , Weekly | |
| Add INBK to Watchlist: View: Get Complete INBK Trend Analysis ➞ | |
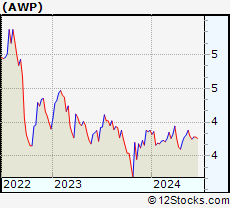 | AWP Aberdeen Global Premier Properties Fund |
| Sector: Financials | |
| SubSector: Closed-End Fund - Foreign | |
| MarketCap: 313.447 Millions | |
| Recent Price: 3.88 Smart Investing & Trading Score: 83 | |
| Day Percent Change: 0.00% Day Change: 0.00 | |
| Week Change: 1.84% Year-to-date Change: 0.0% | |
| AWP Links: Profile News Message Board | |
| Charts:- Daily , Weekly | |
| Add AWP to Watchlist: View: Get Complete AWP Trend Analysis ➞ | |
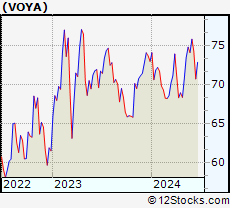 | VOYA Voya Financial, Inc. |
| Sector: Financials | |
| SubSector: Asset Management | |
| MarketCap: 4771.23 Millions | |
| Recent Price: 74.80 Smart Investing & Trading Score: 95 | |
| Day Percent Change: 1.37% Day Change: 1.01 | |
| Week Change: 1.84% Year-to-date Change: 2.5% | |
| VOYA Links: Profile News Message Board | |
| Charts:- Daily , Weekly | |
| Add VOYA to Watchlist: View: Get Complete VOYA Trend Analysis ➞ | |
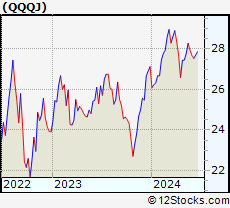 | QQQJ Invesco NASDAQ Next Gen 100 ETF |
| Sector: Financials | |
| SubSector: Exchange Traded Fund | |
| MarketCap: 60157 Millions | |
| Recent Price: 28.28 Smart Investing & Trading Score: 63 | |
| Day Percent Change: -0.21% Day Change: -0.06 | |
| Week Change: 1.84% Year-to-date Change: 4.2% | |
| QQQJ Links: Profile News Message Board | |
| Charts:- Daily , Weekly | |
| Add QQQJ to Watchlist: View: Get Complete QQQJ Trend Analysis ➞ | |
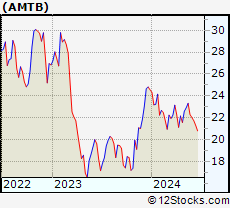 | AMTB Amerant Bancorp Inc. |
| Sector: Financials | |
| SubSector: Regional - Midwest Banks | |
| MarketCap: 653.87 Millions | |
| Recent Price: 23.34 Smart Investing & Trading Score: 88 | |
| Day Percent Change: 0.60% Day Change: 0.14 | |
| Week Change: 1.83% Year-to-date Change: -5.0% | |
| AMTB Links: Profile News Message Board | |
| Charts:- Daily , Weekly | |
| Add AMTB to Watchlist: View: Get Complete AMTB Trend Analysis ➞ | |
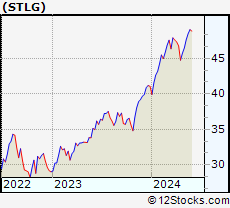 | STLG iShares Factors US Growth Style ETF |
| Sector: Financials | |
| SubSector: Exchange Traded Fund | |
| MarketCap: 60157 Millions | |
| Recent Price: 48.49 Smart Investing & Trading Score: 78 | |
| Day Percent Change: -0.12% Day Change: -0.06 | |
| Week Change: 1.83% Year-to-date Change: 18.0% | |
| STLG Links: Profile News Message Board | |
| Charts:- Daily , Weekly | |
| Add STLG to Watchlist: View: Get Complete STLG Trend Analysis ➞ | |
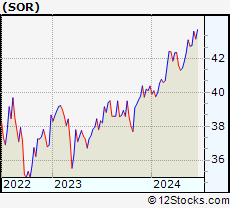 | SOR Source Capital, Inc. |
| Sector: Financials | |
| SubSector: Closed-End Fund - Equity | |
| MarketCap: 229.147 Millions | |
| Recent Price: 43.09 Smart Investing & Trading Score: 88 | |
| Day Percent Change: -1.40% Day Change: -0.61 | |
| Week Change: 1.82% Year-to-date Change: 6.7% | |
| SOR Links: Profile News Message Board | |
| Charts:- Daily , Weekly | |
| Add SOR to Watchlist: View: Get Complete SOR Trend Analysis ➞ | |
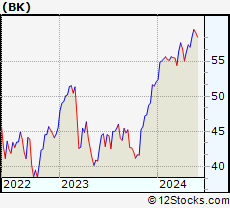 | BK The Bank of New York Mellon Corporation |
| Sector: Financials | |
| SubSector: Asset Management | |
| MarketCap: 29807.5 Millions | |
| Recent Price: 59.50 Smart Investing & Trading Score: 100 | |
| Day Percent Change: 1.24% Day Change: 0.73 | |
| Week Change: 1.81% Year-to-date Change: 14.3% | |
| BK Links: Profile News Message Board | |
| Charts:- Daily , Weekly | |
| Add BK to Watchlist: View: Get Complete BK Trend Analysis ➞ | |
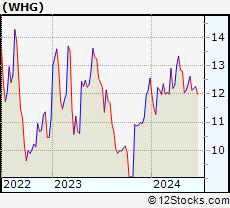 | WHG Westwood Holdings Group, Inc. |
| Sector: Financials | |
| SubSector: Asset Management | |
| MarketCap: 172.103 Millions | |
| Recent Price: 12.35 Smart Investing & Trading Score: 70 | |
| Day Percent Change: 0.65% Day Change: 0.08 | |
| Week Change: 1.81% Year-to-date Change: -1.8% | |
| WHG Links: Profile News Message Board | |
| Charts:- Daily , Weekly | |
| Add WHG to Watchlist: View: Get Complete WHG Trend Analysis ➞ | |
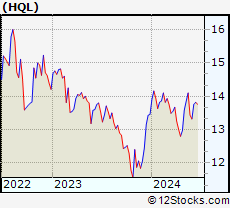 | HQL Tekla Life Sciences Investors |
| Sector: Financials | |
| SubSector: Closed-End Fund - Equity | |
| MarketCap: 289.947 Millions | |
| Recent Price: 14.10 Smart Investing & Trading Score: 76 | |
| Day Percent Change: -1.19% Day Change: -0.17 | |
| Week Change: 1.81% Year-to-date Change: 4.8% | |
| HQL Links: Profile News Message Board | |
| Charts:- Daily , Weekly | |
| Add HQL to Watchlist: View: Get Complete HQL Trend Analysis ➞ | |
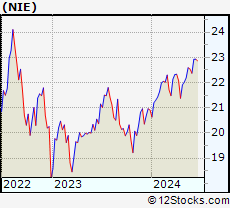 | NIE AllianzGI Equity & Convertible Income Fund |
| Sector: Financials | |
| SubSector: Asset Management | |
| MarketCap: 461.003 Millions | |
| Recent Price: 22.59 Smart Investing & Trading Score: 88 | |
| Day Percent Change: 0.09% Day Change: 0.02 | |
| Week Change: 1.8% Year-to-date Change: 8.0% | |
| NIE Links: Profile News Message Board | |
| Charts:- Daily , Weekly | |
| Add NIE to Watchlist: View: Get Complete NIE Trend Analysis ➞ | |
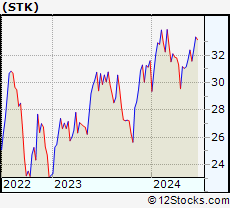 | STK Columbia Seligman Premium Technology Growth Fund |
| Sector: Financials | |
| SubSector: Exchange Traded Fund | |
| MarketCap: 239.751 Millions | |
| Recent Price: 31.72 Smart Investing & Trading Score: 52 | |
| Day Percent Change: -0.06% Day Change: -0.02 | |
| Week Change: 1.8% Year-to-date Change: 0.4% | |
| STK Links: Profile News Message Board | |
| Charts:- Daily , Weekly | |
| Add STK to Watchlist: View: Get Complete STK Trend Analysis ➞ | |
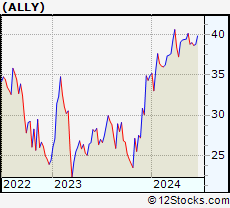 | ALLY Ally Financial Inc. |
| Sector: Financials | |
| SubSector: Mortgage Investment | |
| MarketCap: 4643.99 Millions | |
| Recent Price: 40.12 Smart Investing & Trading Score: 63 | |
| Day Percent Change: -0.64% Day Change: -0.26 | |
| Week Change: 1.8% Year-to-date Change: 14.9% | |
| ALLY Links: Profile News Message Board | |
| Charts:- Daily , Weekly | |
| Add ALLY to Watchlist: View: Get Complete ALLY Trend Analysis ➞ | |
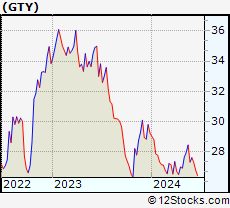 | GTY Getty Realty Corp. |
| Sector: Financials | |
| SubSector: REIT - Retail | |
| MarketCap: 926.114 Millions | |
| Recent Price: 28.45 Smart Investing & Trading Score: 90 | |
| Day Percent Change: -0.07% Day Change: -0.02 | |
| Week Change: 1.79% Year-to-date Change: -2.6% | |
| GTY Links: Profile News Message Board | |
| Charts:- Daily , Weekly | |
| Add GTY to Watchlist: View: Get Complete GTY Trend Analysis ➞ | |
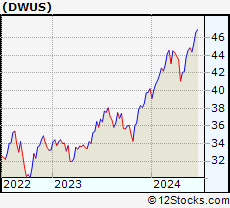 | DWUS AdvisorShares Dorsey Wright FSM US Core ETF |
| Sector: Financials | |
| SubSector: Exchange Traded Fund | |
| MarketCap: 60157 Millions | |
| Recent Price: 44.60 Smart Investing & Trading Score: 78 | |
| Day Percent Change: -0.41% Day Change: -0.18 | |
| Week Change: 1.79% Year-to-date Change: 10.9% | |
| DWUS Links: Profile News Message Board | |
| Charts:- Daily , Weekly | |
| Add DWUS to Watchlist: View: Get Complete DWUS Trend Analysis ➞ | |
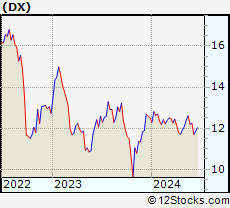 | DX Dynex Capital, Inc. |
| Sector: Financials | |
| SubSector: Mortgage Investment | |
| MarketCap: 327.839 Millions | |
| Recent Price: 12.61 Smart Investing & Trading Score: 90 | |
| Day Percent Change: 0.32% Day Change: 0.04 | |
| Week Change: 1.78% Year-to-date Change: 0.7% | |
| DX Links: Profile News Message Board | |
| Charts:- Daily , Weekly | |
| Add DX to Watchlist: View: Get Complete DX Trend Analysis ➞ | |
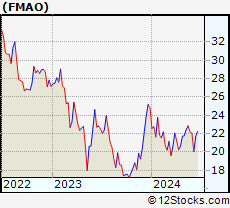 | FMAO Farmers & Merchants Bancorp, Inc. |
| Sector: Financials | |
| SubSector: Regional - Midwest Banks | |
| MarketCap: 280.27 Millions | |
| Recent Price: 22.86 Smart Investing & Trading Score: 83 | |
| Day Percent Change: 0.40% Day Change: 0.09 | |
| Week Change: 1.78% Year-to-date Change: -7.8% | |
| FMAO Links: Profile News Message Board | |
| Charts:- Daily , Weekly | |
| Add FMAO to Watchlist: View: Get Complete FMAO Trend Analysis ➞ | |
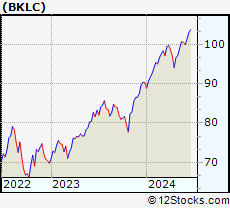 | BKLC BNY Mellon US Large Cap Core Equity ETF |
| Sector: Financials | |
| SubSector: Exchange Traded Fund | |
| MarketCap: 60157 Millions | |
| Recent Price: 100.76 Smart Investing & Trading Score: 83 | |
| Day Percent Change: 0.16% Day Change: 0.16 | |
| Week Change: 1.78% Year-to-date Change: 11.5% | |
| BKLC Links: Profile News Message Board | |
| Charts:- Daily , Weekly | |
| Add BKLC to Watchlist: View: Get Complete BKLC Trend Analysis ➞ | |
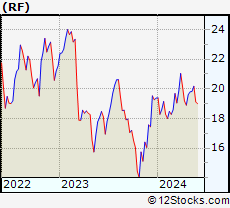 | RF Regions Financial Corporation |
| Sector: Financials | |
| SubSector: Regional - Southeast Banks | |
| MarketCap: 8936.25 Millions | |
| Recent Price: 20.18 Smart Investing & Trading Score: 76 | |
| Day Percent Change: 0.40% Day Change: 0.08 | |
| Week Change: 1.77% Year-to-date Change: 4.1% | |
| RF Links: Profile News Message Board | |
| Charts:- Daily , Weekly | |
| Add RF to Watchlist: View: Get Complete RF Trend Analysis ➞ | |
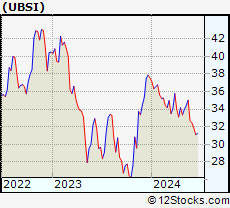 | UBSI United Bankshares, Inc. |
| Sector: Financials | |
| SubSector: Regional - Mid-Atlantic Banks | |
| MarketCap: 2286.79 Millions | |
| Recent Price: 35.02 Smart Investing & Trading Score: 100 | |
| Day Percent Change: 1.01% Day Change: 0.35 | |
| Week Change: 1.77% Year-to-date Change: -6.7% | |
| UBSI Links: Profile News Message Board | |
| Charts:- Daily , Weekly | |
| Add UBSI to Watchlist: View: Get Complete UBSI Trend Analysis ➞ | |
| For tabular summary view of above stock list: Summary View ➞ 0 - 25 , 25 - 50 , 50 - 75 , 75 - 100 , 100 - 125 , 125 - 150 , 150 - 175 , 175 - 200 , 200 - 225 , 225 - 250 , 250 - 275 , 275 - 300 , 300 - 325 , 325 - 350 , 350 - 375 , 375 - 400 , 400 - 425 , 425 - 450 , 450 - 475 , 475 - 500 , 500 - 525 , 525 - 550 , 550 - 575 , 575 - 600 , 600 - 625 , 625 - 650 , 650 - 675 , 675 - 700 , 700 - 725 , 725 - 750 , 750 - 775 , 775 - 800 , 800 - 825 , 825 - 850 , 850 - 875 , 875 - 900 , 900 - 925 , 925 - 950 , 950 - 975 , 975 - 1000 , 1000 - 1025 , 1025 - 1050 , 1050 - 1075 , 1075 - 1100 , 1100 - 1125 , 1125 - 1150 , 1150 - 1175 , 1175 - 1200 , 1200 - 1225 | ||
| Click To Change The Sort Order: By Market Cap or Company Size Performance: Year-to-date, Week and Day | |
| Select Chart Type: | ||
|
Best Stocks Today 12Stocks.com |
© 2024 12Stocks.com Terms & Conditions Privacy Contact Us
All Information Provided Only For Education And Not To Be Used For Investing or Trading. See Terms & Conditions


One More Thing ... Get Best Stocks Delivered Daily!
Never Ever Miss A Move With Our Top Ten Stocks Lists
Find Best Stocks In Any Market - Bull or Bear Market
Take A Peek At Our Top Ten Stocks Lists: Daily, Weekly, Year-to-Date & Top Trends
Find Best Stocks In Any Market - Bull or Bear Market
Take A Peek At Our Top Ten Stocks Lists: Daily, Weekly, Year-to-Date & Top Trends
Financial Stocks With Best Up Trends [0-bearish to 100-bullish]: Fangdd Network[100], Xinyuan Real[100], MicroSectors Gold[100], Sprott Physical[100], Citizens & Northern[100], Sumitomo Mitsui[100], First Community[100], Chubb [100], Angel Oak[100], Sprott Physical[100], Iris Energy[100]
Best Financial Stocks Year-to-Date:
Root [526.36%], Fangdd Network[149.63%], Banco Macro[126.41%], Grupo Financiero[112.4%], Banco BBVA[110.66%], SelectQuote [110.22%], Gladstone Capital[106.92%], EverQuote [98.2%], Hippo [92.54%], Grupo Supervielle[86.95%], Vista Oil[60.93%] Best Financial Stocks This Week:
Fangdd Network[360.27%], Xinyuan Real[53.28%], Iris Energy[25.68%], Fathom [25.35%], Huize Holding[21.83%], First Foundation[18.98%], Trupanion [17.21%], Bridge [16.67%], MicroSectors Gold[15.19%], KE [13.86%], Douglas Elliman[13.56%] Best Financial Stocks Daily:
Fangdd Network[321.26%], Xinyuan Real[39.49%], MicroSectors Gold[12.02%], Fathom [9.88%], Citizens [8.53%], Hywin [8.28%], Root [6.10%], First Foundation[6.09%], Sprott Physical[6.09%], Freedom Holding[5.02%], NexGen Energy[4.99%]