
 Login Sign Up


| |||||
 |  | ||||

| 12Stocks.com Market Intelligence |
Best Financial Stocks
| In a hurry? Financial Stocks Lists: Performance Trends Table, Stock Charts
Sort Financial stocks: Daily, Weekly, Year-to-Date, Market Cap & Trends. Filter Financial stocks list by size:All Financial Large Mid-Range Small & MicroCap |
| 12Stocks.com Financial Stocks Performances & Trends Daily | |||||||||
|
|  The overall Smart Investing & Trading Score is 95 (0-bearish to 100-bullish) which puts Financial sector in short term bullish trend. The Smart Investing & Trading Score from previous trading session is 100 and a deterioration of trend continues.
| ||||||||
Here are the Smart Investing & Trading Scores of the most requested Financial stocks at 12Stocks.com (click stock name for detailed review):
|


| 12Stocks.com: Investing in Financial sector with Stocks | |
|
The following table helps investors and traders sort through current performance and trends (as measured by Smart Investing & Trading Score) of various
stocks in the Financial sector. Quick View: Move mouse or cursor over stock symbol (ticker) to view short-term Technical chart and over stock name to view long term chart. Click on  to add stock symbol to your watchlist and to add stock symbol to your watchlist and  to view watchlist. Click on any ticker or stock name for detailed market intelligence report for that stock. to view watchlist. Click on any ticker or stock name for detailed market intelligence report for that stock. |
12Stocks.com Performance of Stocks in Financial Sector
| Ticker | Stock Name | Watchlist | Category | Recent Price | Smart Investing & Trading Score | Change % | Weekly Change% |
| SIFI | SI |   | S&L | 43.09 | 34 | -0.28% | 0.57% |
| BTO | John Hancock | | Closed-End Fund - Equity | 28.83 | 83 | 0.17% | 0.56% |
| HYB | New America | | Closed-End Fund - Debt | 7.21 | 40 | 0.14% | 0.56% |
| EMBD | Global X | | Exchange Traded Fund | 22.54 | 71 | -0.42% | 0.56% |
| BDJ | BlackRock Enhanced | | Closed-End Fund - Equity | 8.29 | 58 | 0.00% | 0.55% |
| TRV | Travelers | | Insurance | 219.71 | 75 | 0.22% | 0.55% |
| ROCL | Roth Ch | | SPAC | 10.96 | 66 | 0.55% | 0.55% |
| AIG | American | | Insurance | 80.54 | 93 | 2.29% | 0.54% |
| NAD | Nuveen Quality | | Investments | 11.27 | 57 | -0.09% | 0.54% |
| PMX | PIMCO Municipal | | Closed-End Fund - Debt | 7.49 | 50 | -0.13% | 0.54% |
| EMD | Western Asset | | Closed-End Fund - Debt | 9.32 | 71 | -0.43% | 0.53% |
| FSP | Franklin Street | | REIT - Office | 1.92 | 17 | 0.52% | 0.52% |
| VBF | Invesco Bond | | Closed-End Fund - Debt | 15.50 | 40 | -0.19% | 0.52% |
| EVV | Eaton Vance | | Asset Mgmt | 9.77 | 57 | -0.10% | 0.51% |
| GRX | Gabelli Healthcare | | Closed-End Fund - Equity | 9.80 | 63 | -0.81% | 0.51% |
| JEPI | JPMorgan Equity | | Exchange Traded Fund | 57.39 | 70 | 0.21% | 0.51% |
| SIXS | 6 Meridian | | Exchange Traded Fund | 46.99 | 76 | -0.28% | 0.51% |
| DCOM | Dime Community | | S&L | 19.99 | 90 | 1.01% | 0.50% |
| DMF | BNY | | Asset Mgmt | 6.89 | 83 | 0.29% | 0.50% |
| FIBK | First Interstate | | Regional Banks | 27.89 | 83 | 0.87% | 0.50% |
| EQR | Equity Residential | | REIT | 67.13 | 76 | 0.06% | 0.49% |
| CBSH | Commerce Bancshares | | Regional Banks | 56.96 | 86 | 1.24% | 0.49% |
| COLB | Columbia Banking | | S&L | 20.42 | 75 | 0.39% | 0.49% |
| CBNK | Capital Bancorp | | S&L | 20.46 | 63 | -0.63% | 0.49% |
| PDI | PIMCO Dynamic | | Closed-End Fund - Debt | 19.17 | 51 | 0.16% | 0.49% |
| For chart view version of above stock list: Chart View ➞ 0 - 25 , 25 - 50 , 50 - 75 , 75 - 100 , 100 - 125 , 125 - 150 , 150 - 175 , 175 - 200 , 200 - 225 , 225 - 250 , 250 - 275 , 275 - 300 , 300 - 325 , 325 - 350 , 350 - 375 , 375 - 400 , 400 - 425 , 425 - 450 , 450 - 475 , 475 - 500 , 500 - 525 , 525 - 550 , 550 - 575 , 575 - 600 , 600 - 625 , 625 - 650 , 650 - 675 , 675 - 700 , 700 - 725 , 725 - 750 , 750 - 775 , 775 - 800 , 800 - 825 , 825 - 850 , 850 - 875 , 875 - 900 , 900 - 925 , 925 - 950 , 950 - 975 , 975 - 1000 , 1000 - 1025 , 1025 - 1050 , 1050 - 1075 , 1075 - 1100 , 1100 - 1125 , 1125 - 1150 , 1150 - 1175 , 1175 - 1200 , 1200 - 1225 | ||
 | Click To Change The Sort Order: By Market Cap or Company Size Performance: Year-to-date, Week and Day |  |
|
Get the most comprehensive stock market coverage daily at 12Stocks.com ➞ Best Stocks Today ➞ Best Stocks Weekly ➞ Best Stocks Year-to-Date ➞ Best Stocks Trends ➞  Best Stocks Today 12Stocks.com Best Nasdaq Stocks ➞ Best S&P 500 Stocks ➞ Best Tech Stocks ➞ Best Biotech Stocks ➞ |
| Detailed Overview of Financial Stocks |
| Financial Technical Overview, Leaders & Laggards, Top Financial ETF Funds & Detailed Financial Stocks List, Charts, Trends & More |
| Financial Sector: Technical Analysis, Trends & YTD Performance | |
| Financial sector is composed of stocks
from banks, brokers, insurance, REITs
and services subsectors. Financial sector, as represented by XLF, an exchange-traded fund [ETF] that holds basket of Financial stocks (e.g, Bank of America, Goldman Sachs) is up by 13.01% and is currently outperforming the overall market by 2.44% year-to-date. Below is a quick view of Technical charts and trends: |
|
 XLF Weekly Chart |
|
| Long Term Trend: Very Good | |
| Medium Term Trend: Very Good | |
 XLF Daily Chart |
|
| Short Term Trend: Very Good | |
| Overall Trend Score: 95 | |
| YTD Performance: 13.01% | |
| **Trend Scores & Views Are Only For Educational Purposes And Not For Investing | |
| 12Stocks.com: Top Performing Financial Sector Stocks | ||||||||||||||||||||||||||||||||||||||||||||||||
 The top performing Financial sector stocks year to date are
Now, more recently, over last week, the top performing Financial sector stocks on the move are


|
||||||||||||||||||||||||||||||||||||||||||||||||
| 12Stocks.com: Investing in Financial Sector using Exchange Traded Funds | |
|
The following table shows list of key exchange traded funds (ETF) that
help investors track Financial Index. For detailed view, check out our ETF Funds section of our website. Quick View: Move mouse or cursor over ETF symbol (ticker) to view short-term Technical chart and over ETF name to view long term chart. Click on ticker or stock name for detailed view. Click on to add stock symbol to your watchlist and to view watchlist. |
12Stocks.com List of ETFs that track Financial Index
| Ticker | ETF Name | Watchlist | Recent Price | Smart Investing & Trading Score | Change % | Week % | Year-to-date % |
| XLF | Financial | | 42.49 | 95 | 0.73 | 1.58 | 13.01% |
| IAI | Broker-Dealers & Secs | | 119.47 | 100 | 1.08 | 2.59 | 10.08% |
| IYF | Financials | | 96.85 | 95 | 0.43 | 1.73 | 13.39% |
| IYG | Financial Services | | 67.11 | 95 | 0.15 | 1.56 | 12.34% |
| KRE | Regional Banking | | 51.19 | 83 | 0.23 | 1.67 | -2.37% |
| IXG | Global Financials | | 88.72 | 88 | 0.21 | 1.41 | 12.91% |
| VFH | Financials | | 103.00 | 95 | 0.18 | 1.45 | 11.64% |
| KBE | Bank | | 47.93 | 83 | 0.44 | 1.25 | 4.15% |
| FAS | Financial Bull 3X | | 112.32 | 95 | 1.81 | 4.06 | 35.9% |
| FAZ | Financial Bear 3X | | 9.75 | 10 | -1.71 | -3.75 | -28.68% |
| UYG | Financials | | 68.54 | 100 | 1.23 | 2.77 | 24.17% |
| IAT | Regional Banks | | 43.42 | 76 | -0.26 | 1.02 | 3.78% |
| KIE | Insurance | | 51.83 | 100 | 0.88 | 1.09 | 14.62% |
| PSCF | SmallCap Financials | | 49.03 | 95 | 0.28 | 1.44 | -0.31% |
| EUFN | Europe Financials | | 24.13 | 95 | 0.67 | 2.51 | 15.12% |
| PGF | Financial Preferred | | 14.81 | 52 | -0.10 | 0.68 | 1.58% |
| 12Stocks.com: Charts, Trends, Fundamental Data and Performances of Financial Stocks | |
|
We now take in-depth look at all Financial stocks including charts, multi-period performances and overall trends (as measured by Smart Investing & Trading Score). One can sort Financial stocks (click link to choose) by Daily, Weekly and by Year-to-Date performances. Also, one can sort by size of the company or by market capitalization. |
| Select Your Default Chart Type: | |||||
| |||||
| Click on stock symbol or name for detailed view. Click on to add stock symbol to your watchlist and to view watchlist. Quick View: Move mouse or cursor over "Daily" to quickly view daily Technical stock chart and over "Weekly" to view weekly Technical stock chart. | |||||

 | SIFI SI Financial Group, Inc. |
| Sector: Financials | |
| SubSector: Savings & Loans | |
| MarketCap: 171.5 Millions | |
| Recent Price: 43.09 Smart Investing & Trading Score: 34 | |
| Day Percent Change: -0.28% Day Change: -0.12 | |
| Week Change: 0.57% Year-to-date Change: -0.8% | |
| SIFI Links: Profile News Message Board | |
| Charts:- Daily , Weekly | |
| Add SIFI to Watchlist: View: Get Complete SIFI Trend Analysis ➞ | |
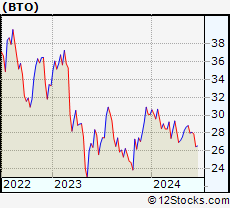 | BTO John Hancock Financial Opportunities Fund |
| Sector: Financials | |
| SubSector: Closed-End Fund - Equity | |
| MarketCap: 326.747 Millions | |
| Recent Price: 28.83 Smart Investing & Trading Score: 83 | |
| Day Percent Change: 0.17% Day Change: 0.05 | |
| Week Change: 0.56% Year-to-date Change: -4.2% | |
| BTO Links: Profile News Message Board | |
| Charts:- Daily , Weekly | |
| Add BTO to Watchlist: View: Get Complete BTO Trend Analysis ➞ | |
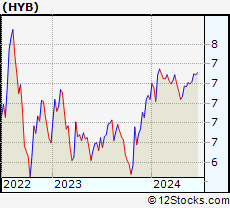 | HYB The New America High Income Fund Inc. |
| Sector: Financials | |
| SubSector: Closed-End Fund - Debt | |
| MarketCap: 141.107 Millions | |
| Recent Price: 7.21 Smart Investing & Trading Score: 40 | |
| Day Percent Change: 0.14% Day Change: 0.01 | |
| Week Change: 0.56% Year-to-date Change: 2.4% | |
| HYB Links: Profile News Message Board | |
| Charts:- Daily , Weekly | |
| Add HYB to Watchlist: View: Get Complete HYB Trend Analysis ➞ | |
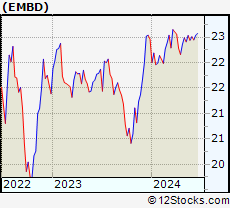 | EMBD Global X Emerging Markets Bond ETF |
| Sector: Financials | |
| SubSector: Exchange Traded Fund | |
| MarketCap: 60157 Millions | |
| Recent Price: 22.54 Smart Investing & Trading Score: 71 | |
| Day Percent Change: -0.42% Day Change: -0.09 | |
| Week Change: 0.56% Year-to-date Change: 0.3% | |
| EMBD Links: Profile News Message Board | |
| Charts:- Daily , Weekly | |
| Add EMBD to Watchlist: View: Get Complete EMBD Trend Analysis ➞ | |
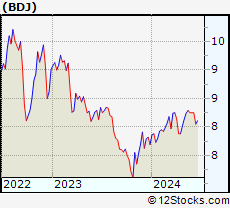 | BDJ BlackRock Enhanced Equity Dividend Trust |
| Sector: Financials | |
| SubSector: Closed-End Fund - Equity | |
| MarketCap: 1031.47 Millions | |
| Recent Price: 8.29 Smart Investing & Trading Score: 58 | |
| Day Percent Change: 0.00% Day Change: 0.00 | |
| Week Change: 0.55% Year-to-date Change: 7.8% | |
| BDJ Links: Profile News Message Board | |
| Charts:- Daily , Weekly | |
| Add BDJ to Watchlist: View: Get Complete BDJ Trend Analysis ➞ | |
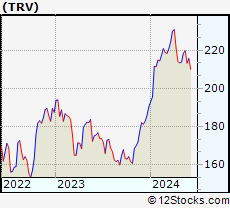 | TRV The Travelers Companies, Inc. |
| Sector: Financials | |
| SubSector: Property & Casualty Insurance | |
| MarketCap: 25155.9 Millions | |
| Recent Price: 219.71 Smart Investing & Trading Score: 75 | |
| Day Percent Change: 0.22% Day Change: 0.49 | |
| Week Change: 0.55% Year-to-date Change: 15.3% | |
| TRV Links: Profile News Message Board | |
| Charts:- Daily , Weekly | |
| Add TRV to Watchlist: View: Get Complete TRV Trend Analysis ➞ | |
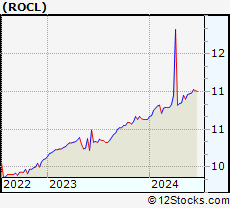 | ROCL Roth Ch Acquisition V Co. |
| Sector: Financials | |
| SubSector: SPAC | |
| MarketCap: 153 Millions | |
| Recent Price: 10.96 Smart Investing & Trading Score: 66 | |
| Day Percent Change: 0.55% Day Change: 0.06 | |
| Week Change: 0.55% Year-to-date Change: 3.1% | |
| ROCL Links: Profile News Message Board | |
| Charts:- Daily , Weekly | |
| Add ROCL to Watchlist: View: Get Complete ROCL Trend Analysis ➞ | |
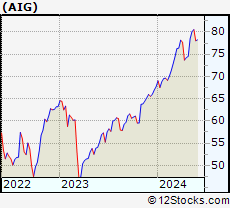 | AIG American International Group, Inc. |
| Sector: Financials | |
| SubSector: Property & Casualty Insurance | |
| MarketCap: 21219 Millions | |
| Recent Price: 80.54 Smart Investing & Trading Score: 93 | |
| Day Percent Change: 2.29% Day Change: 1.80 | |
| Week Change: 0.54% Year-to-date Change: 18.9% | |
| AIG Links: Profile News Message Board | |
| Charts:- Daily , Weekly | |
| Add AIG to Watchlist: View: Get Complete AIG Trend Analysis ➞ | |
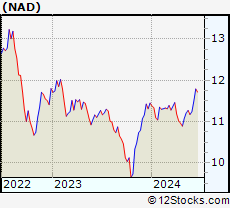 | NAD Nuveen Quality Municipal Income Fund |
| Sector: Financials | |
| SubSector: Diversified Investments | |
| MarketCap: 2464.7 Millions | |
| Recent Price: 11.27 Smart Investing & Trading Score: 57 | |
| Day Percent Change: -0.09% Day Change: -0.01 | |
| Week Change: 0.54% Year-to-date Change: -1.6% | |
| NAD Links: Profile News Message Board | |
| Charts:- Daily , Weekly | |
| Add NAD to Watchlist: View: Get Complete NAD Trend Analysis ➞ | |
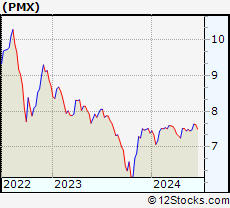 | PMX PIMCO Municipal Income Fund III |
| Sector: Financials | |
| SubSector: Closed-End Fund - Debt | |
| MarketCap: 309.807 Millions | |
| Recent Price: 7.49 Smart Investing & Trading Score: 50 | |
| Day Percent Change: -0.13% Day Change: -0.01 | |
| Week Change: 0.54% Year-to-date Change: 1.4% | |
| PMX Links: Profile News Message Board | |
| Charts:- Daily , Weekly | |
| Add PMX to Watchlist: View: Get Complete PMX Trend Analysis ➞ | |
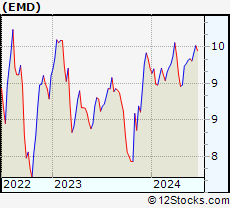 | EMD Western Asset Emerging Markets Debt Fund Inc. |
| Sector: Financials | |
| SubSector: Closed-End Fund - Debt | |
| MarketCap: 595.907 Millions | |
| Recent Price: 9.32 Smart Investing & Trading Score: 71 | |
| Day Percent Change: -0.43% Day Change: -0.04 | |
| Week Change: 0.53% Year-to-date Change: 1.2% | |
| EMD Links: Profile News Message Board | |
| Charts:- Daily , Weekly | |
| Add EMD to Watchlist: View: Get Complete EMD Trend Analysis ➞ | |
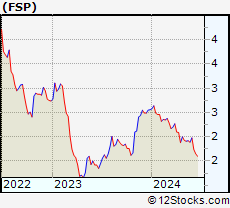 | FSP Franklin Street Properties Corp. |
| Sector: Financials | |
| SubSector: REIT - Office | |
| MarketCap: 636.366 Millions | |
| Recent Price: 1.92 Smart Investing & Trading Score: 17 | |
| Day Percent Change: 0.52% Day Change: 0.01 | |
| Week Change: 0.52% Year-to-date Change: -25.0% | |
| FSP Links: Profile News Message Board | |
| Charts:- Daily , Weekly | |
| Add FSP to Watchlist: View: Get Complete FSP Trend Analysis ➞ | |
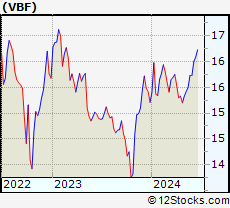 | VBF Invesco Bond Fund |
| Sector: Financials | |
| SubSector: Closed-End Fund - Debt | |
| MarketCap: 177.307 Millions | |
| Recent Price: 15.50 Smart Investing & Trading Score: 40 | |
| Day Percent Change: -0.19% Day Change: -0.03 | |
| Week Change: 0.52% Year-to-date Change: 1.9% | |
| VBF Links: Profile News Message Board | |
| Charts:- Daily , Weekly | |
| Add VBF to Watchlist: View: Get Complete VBF Trend Analysis ➞ | |
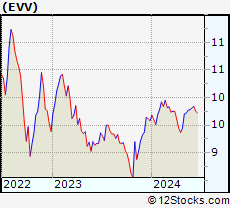 | EVV Eaton Vance Limited Duration Income Fund |
| Sector: Financials | |
| SubSector: Asset Management | |
| MarketCap: 1022.03 Millions | |
| Recent Price: 9.77 Smart Investing & Trading Score: 57 | |
| Day Percent Change: -0.10% Day Change: -0.01 | |
| Week Change: 0.51% Year-to-date Change: 2.0% | |
| EVV Links: Profile News Message Board | |
| Charts:- Daily , Weekly | |
| Add EVV to Watchlist: View: Get Complete EVV Trend Analysis ➞ | |
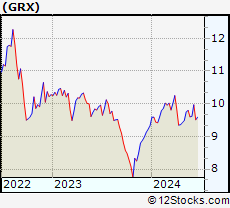 | GRX The Gabelli Healthcare & Wellness Trust |
| Sector: Financials | |
| SubSector: Closed-End Fund - Equity | |
| MarketCap: 138.547 Millions | |
| Recent Price: 9.80 Smart Investing & Trading Score: 63 | |
| Day Percent Change: -0.81% Day Change: -0.08 | |
| Week Change: 0.51% Year-to-date Change: 5.0% | |
| GRX Links: Profile News Message Board | |
| Charts:- Daily , Weekly | |
| Add GRX to Watchlist: View: Get Complete GRX Trend Analysis ➞ | |
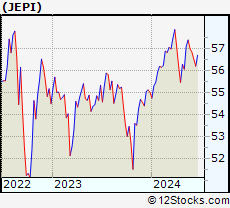 | JEPI JPMorgan Equity Premium Income ETF |
| Sector: Financials | |
| SubSector: Exchange Traded Fund | |
| MarketCap: 60157 Millions | |
| Recent Price: 57.39 Smart Investing & Trading Score: 70 | |
| Day Percent Change: 0.21% Day Change: 0.12 | |
| Week Change: 0.51% Year-to-date Change: 4.3% | |
| JEPI Links: Profile News Message Board | |
| Charts:- Daily , Weekly | |
| Add JEPI to Watchlist: View: Get Complete JEPI Trend Analysis ➞ | |
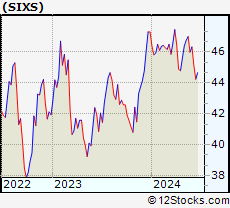 | SIXS 6 Meridian Small Cap Equity ETF |
| Sector: Financials | |
| SubSector: Exchange Traded Fund | |
| MarketCap: 60157 Millions | |
| Recent Price: 46.99 Smart Investing & Trading Score: 76 | |
| Day Percent Change: -0.28% Day Change: -0.13 | |
| Week Change: 0.51% Year-to-date Change: -0.6% | |
| SIXS Links: Profile News Message Board | |
| Charts:- Daily , Weekly | |
| Add SIXS to Watchlist: View: Get Complete SIXS Trend Analysis ➞ | |
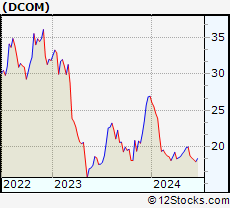 | DCOM Dime Community Bancshares, Inc. |
| Sector: Financials | |
| SubSector: Savings & Loans | |
| MarketCap: 477.83 Millions | |
| Recent Price: 19.99 Smart Investing & Trading Score: 90 | |
| Day Percent Change: 1.01% Day Change: 0.20 | |
| Week Change: 0.5% Year-to-date Change: -25.8% | |
| DCOM Links: Profile News Message Board | |
| Charts:- Daily , Weekly | |
| Add DCOM to Watchlist: View: Get Complete DCOM Trend Analysis ➞ | |
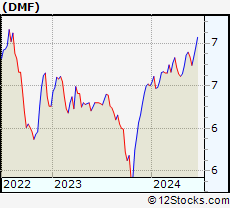 | DMF BNY Mellon Municipal Income, Inc. |
| Sector: Financials | |
| SubSector: Asset Management | |
| MarketCap: 146.403 Millions | |
| Recent Price: 6.89 Smart Investing & Trading Score: 83 | |
| Day Percent Change: 0.29% Day Change: 0.02 | |
| Week Change: 0.5% Year-to-date Change: 6.1% | |
| DMF Links: Profile News Message Board | |
| Charts:- Daily , Weekly | |
| Add DMF to Watchlist: View: Get Complete DMF Trend Analysis ➞ | |
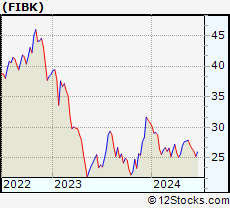 | FIBK First Interstate BancSystem, Inc. |
| Sector: Financials | |
| SubSector: Regional - Pacific Banks | |
| MarketCap: 1797.69 Millions | |
| Recent Price: 27.89 Smart Investing & Trading Score: 83 | |
| Day Percent Change: 0.87% Day Change: 0.24 | |
| Week Change: 0.5% Year-to-date Change: -9.3% | |
| FIBK Links: Profile News Message Board | |
| Charts:- Daily , Weekly | |
| Add FIBK to Watchlist: View: Get Complete FIBK Trend Analysis ➞ | |
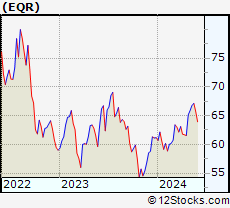 | EQR Equity Residential |
| Sector: Financials | |
| SubSector: REIT - Residential | |
| MarketCap: 22061.9 Millions | |
| Recent Price: 67.13 Smart Investing & Trading Score: 76 | |
| Day Percent Change: 0.06% Day Change: 0.04 | |
| Week Change: 0.49% Year-to-date Change: 9.8% | |
| EQR Links: Profile News Message Board | |
| Charts:- Daily , Weekly | |
| Add EQR to Watchlist: View: Get Complete EQR Trend Analysis ➞ | |
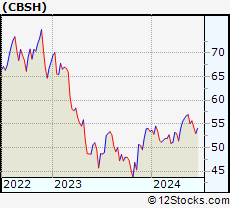 | CBSH Commerce Bancshares, Inc. |
| Sector: Financials | |
| SubSector: Regional - Midwest Banks | |
| MarketCap: 6201.5 Millions | |
| Recent Price: 56.96 Smart Investing & Trading Score: 86 | |
| Day Percent Change: 1.24% Day Change: 0.70 | |
| Week Change: 0.49% Year-to-date Change: 6.7% | |
| CBSH Links: Profile News Message Board | |
| Charts:- Daily , Weekly | |
| Add CBSH to Watchlist: View: Get Complete CBSH Trend Analysis ➞ | |
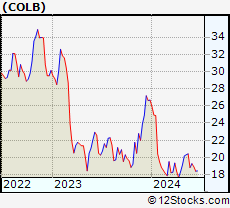 | COLB Columbia Banking System, Inc. |
| Sector: Financials | |
| SubSector: Savings & Loans | |
| MarketCap: 1868.3 Millions | |
| Recent Price: 20.42 Smart Investing & Trading Score: 75 | |
| Day Percent Change: 0.39% Day Change: 0.08 | |
| Week Change: 0.49% Year-to-date Change: -23.5% | |
| COLB Links: Profile News Message Board | |
| Charts:- Daily , Weekly | |
| Add COLB to Watchlist: View: Get Complete COLB Trend Analysis ➞ | |
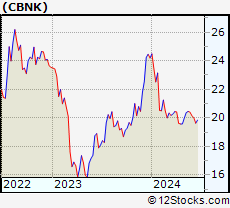 | CBNK Capital Bancorp, Inc. |
| Sector: Financials | |
| SubSector: Savings & Loans | |
| MarketCap: 174.93 Millions | |
| Recent Price: 20.46 Smart Investing & Trading Score: 63 | |
| Day Percent Change: -0.63% Day Change: -0.13 | |
| Week Change: 0.49% Year-to-date Change: -15.5% | |
| CBNK Links: Profile News Message Board | |
| Charts:- Daily , Weekly | |
| Add CBNK to Watchlist: View: Get Complete CBNK Trend Analysis ➞ | |
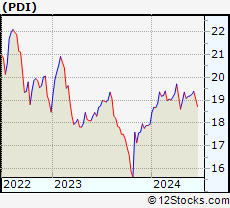 | PDI PIMCO Dynamic Income Fund |
| Sector: Financials | |
| SubSector: Closed-End Fund - Debt | |
| MarketCap: 1135.47 Millions | |
| Recent Price: 19.17 Smart Investing & Trading Score: 51 | |
| Day Percent Change: 0.16% Day Change: 0.03 | |
| Week Change: 0.49% Year-to-date Change: 6.8% | |
| PDI Links: Profile News Message Board | |
| Charts:- Daily , Weekly | |
| Add PDI to Watchlist: View: Get Complete PDI Trend Analysis ➞ | |
| For tabular summary view of above stock list: Summary View ➞ 0 - 25 , 25 - 50 , 50 - 75 , 75 - 100 , 100 - 125 , 125 - 150 , 150 - 175 , 175 - 200 , 200 - 225 , 225 - 250 , 250 - 275 , 275 - 300 , 300 - 325 , 325 - 350 , 350 - 375 , 375 - 400 , 400 - 425 , 425 - 450 , 450 - 475 , 475 - 500 , 500 - 525 , 525 - 550 , 550 - 575 , 575 - 600 , 600 - 625 , 625 - 650 , 650 - 675 , 675 - 700 , 700 - 725 , 725 - 750 , 750 - 775 , 775 - 800 , 800 - 825 , 825 - 850 , 850 - 875 , 875 - 900 , 900 - 925 , 925 - 950 , 950 - 975 , 975 - 1000 , 1000 - 1025 , 1025 - 1050 , 1050 - 1075 , 1075 - 1100 , 1100 - 1125 , 1125 - 1150 , 1150 - 1175 , 1175 - 1200 , 1200 - 1225 | ||
| Click To Change The Sort Order: By Market Cap or Company Size Performance: Year-to-date, Week and Day | |
| Select Chart Type: | ||
|
Best Stocks Today 12Stocks.com |
© 2024 12Stocks.com Terms & Conditions Privacy Contact Us
All Information Provided Only For Education And Not To Be Used For Investing or Trading. See Terms & Conditions


One More Thing ... Get Best Stocks Delivered Daily!
Never Ever Miss A Move With Our Top Ten Stocks Lists
Find Best Stocks In Any Market - Bull or Bear Market
Take A Peek At Our Top Ten Stocks Lists: Daily, Weekly, Year-to-Date & Top Trends
Find Best Stocks In Any Market - Bull or Bear Market
Take A Peek At Our Top Ten Stocks Lists: Daily, Weekly, Year-to-Date & Top Trends
Financial Stocks With Best Up Trends [0-bearish to 100-bullish]: Fangdd Network[100], Xinyuan Real[100], MicroSectors Gold[100], Sprott Physical[100], Citizens & Northern[100], Sumitomo Mitsui[100], First Community[100], Chubb [100], Angel Oak[100], Sprott Physical[100], Iris Energy[100]
Best Financial Stocks Year-to-Date:
Root [526.36%], Fangdd Network[149.63%], Banco Macro[126.41%], Grupo Financiero[112.4%], Banco BBVA[110.66%], SelectQuote [110.22%], Gladstone Capital[106.92%], EverQuote [98.2%], Hippo [92.54%], Grupo Supervielle[86.95%], Vista Oil[60.93%] Best Financial Stocks This Week:
Fangdd Network[360.27%], Xinyuan Real[53.28%], Iris Energy[25.68%], Fathom [25.35%], Huize Holding[21.83%], First Foundation[18.98%], Trupanion [17.21%], Bridge [16.67%], MicroSectors Gold[15.19%], KE [13.86%], Douglas Elliman[13.56%] Best Financial Stocks Daily:
Fangdd Network[321.26%], Xinyuan Real[39.49%], MicroSectors Gold[12.02%], Fathom [9.88%], Citizens [8.53%], Hywin [8.28%], Root [6.10%], First Foundation[6.09%], Sprott Physical[6.09%], Freedom Holding[5.02%], NexGen Energy[4.99%]