
 Login Sign Up


| |||||
 |  | ||||

| 12Stocks.com Market Intelligence |
Best Financial Stocks
| In a hurry? Financial Stocks Lists: Performance Trends Table, Stock Charts
Sort Financial stocks: Daily, Weekly, Year-to-Date, Market Cap & Trends. Filter Financial stocks list by size:All Financial Large Mid-Range Small & MicroCap |
| 12Stocks.com Financial Stocks Performances & Trends Daily | |||||||||
|
|  The overall Smart Investing & Trading Score is 95 (0-bearish to 100-bullish) which puts Financial sector in short term bullish trend. The Smart Investing & Trading Score from previous trading session is 100 and a deterioration of trend continues.
| ||||||||
Here are the Smart Investing & Trading Scores of the most requested Financial stocks at 12Stocks.com (click stock name for detailed review):
|


| 12Stocks.com: Investing in Financial sector with Stocks | |
|
The following table helps investors and traders sort through current performance and trends (as measured by Smart Investing & Trading Score) of various
stocks in the Financial sector. Quick View: Move mouse or cursor over stock symbol (ticker) to view short-term Technical chart and over stock name to view long term chart. Click on  to add stock symbol to your watchlist and to add stock symbol to your watchlist and  to view watchlist. Click on any ticker or stock name for detailed market intelligence report for that stock. to view watchlist. Click on any ticker or stock name for detailed market intelligence report for that stock. |
12Stocks.com Performance of Stocks in Financial Sector
| Ticker | Stock Name | Watchlist | Category | Recent Price | Smart Investing & Trading Score | Change % | Weekly Change% |
| NOAH | Noah |   | Asset Mgmt | 15.10 | 95 | 0.53% | 6.26% |
| CIB | Bancolombia S.A | | Foreign Banks | 36.33 | 100 | 1.20% | 6.17% |
| ABR | Arbor Realty | | Mortgage | 13.89 | 68 | 0.58% | 6.03% |
| SAMG | Silvercrest Asset | | Asset Mgmt | 15.90 | 74 | -0.25% | 5.93% |
| CRBG | Corebridge | | Asset Mgmt | 31.30 | 83 | -3.72% | 5.92% |
| EHTH | eHealth | | Insurance | 5.46 | 54 | -0.55% | 5.81% |
| ASA | ASA Gold | | Asset Mgmt | 19.16 | 100 | 2.90% | 5.80% |
| NREF | NexPoint Real | | REIT | 14.13 | 87 | 0.07% | 5.76% |
| CHMI | Cherry Hill | | Mortgage | 3.70 | 100 | 1.09% | 5.71% |
| GERM | ETFMG Treatments | | Exchange Traded Fund | 19.23 | 83 | -1.53% | 5.64% |
| EQIX | Equinix . | | REIT - | 799.83 | 52 | 0.04% | 5.56% |
| RCS | PIMCO Strategic | | Closed-End Fund - Debt | 6.11 | 90 | 1.66% | 5.53% |
| MMI | Marcus & Millichap | | Real Estatet | 35.54 | 69 | 0.71% | 5.52% |
| LAZ | Lazard | | Asset Mgmt | 40.81 | 100 | 0.29% | 5.51% |
| TRNO | Terreno Realty | | REIT - Industrial | 58.10 | 64 | 0.35% | 5.50% |
| LC | LendingClub | | Credit Services | 9.50 | 90 | 1.39% | 5.44% |
| AMT | American Tower | | REIT - | 194.51 | 69 | -0.22% | 5.43% |
| PFIS | Peoples | | Regional Banks | 40.75 | 100 | 0.00% | 5.43% |
| CEF | Sprott Physical | | Asset Mgmt | 23.21 | 100 | 3.34% | 5.31% |
| COLD | Americold Realty | | REIT - Industrial | 25.39 | 87 | 2.54% | 5.29% |
| JLL | Jones Lang | | Property Mgmt | 206.20 | 88 | -0.65% | 5.28% |
| LGIH | LGI Homes | | Real Estatet | 104.63 | 47 | -0.58% | 5.27% |
| FG | F&G Annuities | | Insurance - Life | 42.76 | 95 | 4.96% | 5.22% |
| BSAC | Banco Santander-Chile | | Banks | 19.98 | 88 | 0.00% | 5.21% |
| AROW | Arrow | | Regional Banks | 24.97 | 100 | 0.40% | 5.18% |
| For chart view version of above stock list: Chart View ➞ 0 - 25 , 25 - 50 , 50 - 75 , 75 - 100 , 100 - 125 , 125 - 150 , 150 - 175 , 175 - 200 , 200 - 225 , 225 - 250 , 250 - 275 , 275 - 300 , 300 - 325 , 325 - 350 , 350 - 375 , 375 - 400 , 400 - 425 , 425 - 450 , 450 - 475 , 475 - 500 , 500 - 525 , 525 - 550 , 550 - 575 , 575 - 600 , 600 - 625 , 625 - 650 , 650 - 675 , 675 - 700 , 700 - 725 , 725 - 750 , 750 - 775 , 775 - 800 , 800 - 825 , 825 - 850 , 850 - 875 , 875 - 900 , 900 - 925 , 925 - 950 , 950 - 975 , 975 - 1000 , 1000 - 1025 , 1025 - 1050 , 1050 - 1075 , 1075 - 1100 , 1100 - 1125 , 1125 - 1150 , 1150 - 1175 , 1175 - 1200 , 1200 - 1225 | ||
 | Click To Change The Sort Order: By Market Cap or Company Size Performance: Year-to-date, Week and Day |  |
|
Get the most comprehensive stock market coverage daily at 12Stocks.com ➞ Best Stocks Today ➞ Best Stocks Weekly ➞ Best Stocks Year-to-Date ➞ Best Stocks Trends ➞  Best Stocks Today 12Stocks.com Best Nasdaq Stocks ➞ Best S&P 500 Stocks ➞ Best Tech Stocks ➞ Best Biotech Stocks ➞ |
| Detailed Overview of Financial Stocks |
| Financial Technical Overview, Leaders & Laggards, Top Financial ETF Funds & Detailed Financial Stocks List, Charts, Trends & More |
| Financial Sector: Technical Analysis, Trends & YTD Performance | |
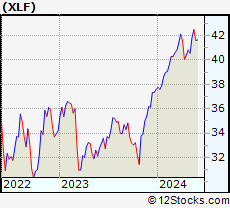
| Financial sector is composed of stocks
from banks, brokers, insurance, REITs
and services subsectors. Financial sector, as represented by XLF, an exchange-traded fund [ETF] that holds basket of Financial stocks (e.g, Bank of America, Goldman Sachs) is up by 13.01% and is currently outperforming the overall market by 2.44% year-to-date. Below is a quick view of Technical charts and trends: |
|
 XLF Weekly Chart |
|
| Long Term Trend: Very Good | |
| Medium Term Trend: Very Good | |
 XLF Daily Chart |
|
| Short Term Trend: Very Good | |
| Overall Trend Score: 95 | |
| YTD Performance: 13.01% | |
| **Trend Scores & Views Are Only For Educational Purposes And Not For Investing | |
| 12Stocks.com: Top Performing Financial Sector Stocks | ||||||||||||||||||||||||||||||||||||||||||||||||
 The top performing Financial sector stocks year to date are
Now, more recently, over last week, the top performing Financial sector stocks on the move are


|
||||||||||||||||||||||||||||||||||||||||||||||||
| 12Stocks.com: Investing in Financial Sector using Exchange Traded Funds | |
|
The following table shows list of key exchange traded funds (ETF) that
help investors track Financial Index. For detailed view, check out our ETF Funds section of our website. Quick View: Move mouse or cursor over ETF symbol (ticker) to view short-term Technical chart and over ETF name to view long term chart. Click on ticker or stock name for detailed view. Click on to add stock symbol to your watchlist and to view watchlist. |
12Stocks.com List of ETFs that track Financial Index
| Ticker | ETF Name | Watchlist | Recent Price | Smart Investing & Trading Score | Change % | Week % | Year-to-date % |
| XLF | Financial | | 42.49 | 95 | 0.73 | 1.58 | 13.01% |
| IAI | Broker-Dealers & Secs | | 119.47 | 100 | 1.08 | 2.59 | 10.08% |
| IYF | Financials | | 96.85 | 95 | 0.43 | 1.73 | 13.39% |
| IYG | Financial Services | | 67.11 | 95 | 0.15 | 1.56 | 12.34% |
| KRE | Regional Banking | | 51.19 | 83 | 0.23 | 1.67 | -2.37% |
| IXG | Global Financials | | 88.72 | 88 | 0.21 | 1.41 | 12.91% |
| VFH | Financials | | 103.00 | 95 | 0.18 | 1.45 | 11.64% |
| KBE | Bank | | 47.93 | 83 | 0.44 | 1.25 | 4.15% |
| FAS | Financial Bull 3X | | 112.32 | 95 | 1.81 | 4.06 | 35.9% |
| FAZ | Financial Bear 3X | | 9.75 | 10 | -1.71 | -3.75 | -28.68% |
| UYG | Financials | | 68.54 | 100 | 1.23 | 2.77 | 24.17% |
| IAT | Regional Banks | | 43.42 | 76 | -0.26 | 1.02 | 3.78% |
| KIE | Insurance | | 51.83 | 100 | 0.88 | 1.09 | 14.62% |
| PSCF | SmallCap Financials | | 49.03 | 95 | 0.28 | 1.44 | -0.31% |
| EUFN | Europe Financials | | 24.13 | 95 | 0.67 | 2.51 | 15.12% |
| PGF | Financial Preferred | | 14.81 | 52 | -0.10 | 0.68 | 1.58% |
| 12Stocks.com: Charts, Trends, Fundamental Data and Performances of Financial Stocks | |
|
We now take in-depth look at all Financial stocks including charts, multi-period performances and overall trends (as measured by Smart Investing & Trading Score). One can sort Financial stocks (click link to choose) by Daily, Weekly and by Year-to-Date performances. Also, one can sort by size of the company or by market capitalization. |
| Select Your Default Chart Type: | |||||
| |||||
| Click on stock symbol or name for detailed view. Click on to add stock symbol to your watchlist and to view watchlist. Quick View: Move mouse or cursor over "Daily" to quickly view daily Technical stock chart and over "Weekly" to view weekly Technical stock chart. | |||||

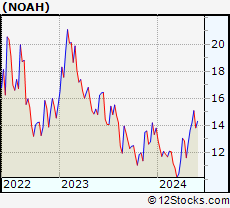 | NOAH Noah Holdings Limited |
| Sector: Financials | |
| SubSector: Asset Management | |
| MarketCap: 1495.33 Millions | |
| Recent Price: 15.10 Smart Investing & Trading Score: 95 | |
| Day Percent Change: 0.53% Day Change: 0.08 | |
| Week Change: 6.26% Year-to-date Change: 9.3% | |
| NOAH Links: Profile News Message Board | |
| Charts:- Daily , Weekly | |
| Add NOAH to Watchlist: View: Get Complete NOAH Trend Analysis ➞ | |
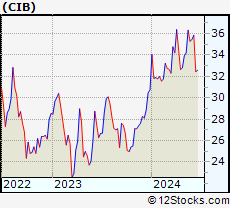 | CIB Bancolombia S.A. |
| Sector: Financials | |
| SubSector: Foreign Regional Banks | |
| MarketCap: 5031.99 Millions | |
| Recent Price: 36.33 Smart Investing & Trading Score: 100 | |
| Day Percent Change: 1.20% Day Change: 0.43 | |
| Week Change: 6.17% Year-to-date Change: 18.1% | |
| CIB Links: Profile News Message Board | |
| Charts:- Daily , Weekly | |
| Add CIB to Watchlist: View: Get Complete CIB Trend Analysis ➞ | |
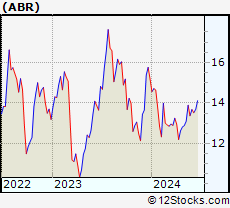 | ABR Arbor Realty Trust, Inc. |
| Sector: Financials | |
| SubSector: Mortgage Investment | |
| MarketCap: 648.939 Millions | |
| Recent Price: 13.89 Smart Investing & Trading Score: 68 | |
| Day Percent Change: 0.58% Day Change: 0.08 | |
| Week Change: 6.03% Year-to-date Change: -8.5% | |
| ABR Links: Profile News Message Board | |
| Charts:- Daily , Weekly | |
| Add ABR to Watchlist: View: Get Complete ABR Trend Analysis ➞ | |
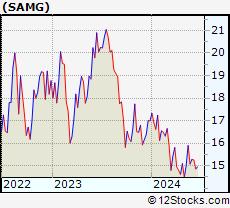 | SAMG Silvercrest Asset Management Group Inc. |
| Sector: Financials | |
| SubSector: Asset Management | |
| MarketCap: 116.303 Millions | |
| Recent Price: 15.90 Smart Investing & Trading Score: 74 | |
| Day Percent Change: -0.25% Day Change: -0.04 | |
| Week Change: 5.93% Year-to-date Change: -6.5% | |
| SAMG Links: Profile News Message Board | |
| Charts:- Daily , Weekly | |
| Add SAMG to Watchlist: View: Get Complete SAMG Trend Analysis ➞ | |
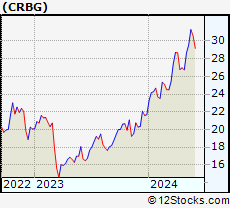 | CRBG Corebridge Financial, Inc. |
| Sector: Financials | |
| SubSector: Asset Management | |
| MarketCap: 11170 Millions | |
| Recent Price: 31.30 Smart Investing & Trading Score: 83 | |
| Day Percent Change: -3.72% Day Change: -1.21 | |
| Week Change: 5.92% Year-to-date Change: 44.4% | |
| CRBG Links: Profile News Message Board | |
| Charts:- Daily , Weekly | |
| Add CRBG to Watchlist: View: Get Complete CRBG Trend Analysis ➞ | |
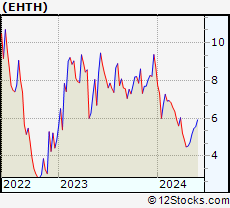 | EHTH eHealth, Inc. |
| Sector: Financials | |
| SubSector: Insurance Brokers | |
| MarketCap: 2813.57 Millions | |
| Recent Price: 5.46 Smart Investing & Trading Score: 54 | |
| Day Percent Change: -0.55% Day Change: -0.03 | |
| Week Change: 5.81% Year-to-date Change: -37.4% | |
| EHTH Links: Profile News Message Board | |
| Charts:- Daily , Weekly | |
| Add EHTH to Watchlist: View: Get Complete EHTH Trend Analysis ➞ | |
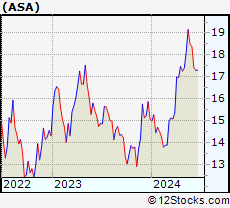 | ASA ASA Gold and Precious Metals Limited |
| Sector: Financials | |
| SubSector: Asset Management | |
| MarketCap: 175.503 Millions | |
| Recent Price: 19.16 Smart Investing & Trading Score: 100 | |
| Day Percent Change: 2.90% Day Change: 0.54 | |
| Week Change: 5.8% Year-to-date Change: 27.2% | |
| ASA Links: Profile News Message Board | |
| Charts:- Daily , Weekly | |
| Add ASA to Watchlist: View: Get Complete ASA Trend Analysis ➞ | |
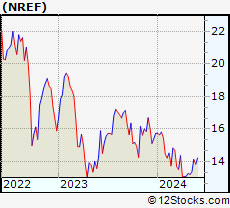 | NREF NexPoint Real Estate Finance, Inc. |
| Sector: Financials | |
| SubSector: REIT Diversified | |
| MarketCap: 97267 Millions | |
| Recent Price: 14.13 Smart Investing & Trading Score: 87 | |
| Day Percent Change: 0.07% Day Change: 0.01 | |
| Week Change: 5.76% Year-to-date Change: -10.2% | |
| NREF Links: Profile News Message Board | |
| Charts:- Daily , Weekly | |
| Add NREF to Watchlist: View: Get Complete NREF Trend Analysis ➞ | |
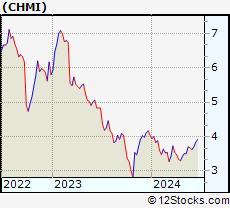 | CHMI Cherry Hill Mortgage Investment Corporation |
| Sector: Financials | |
| SubSector: Mortgage Investment | |
| MarketCap: 124.839 Millions | |
| Recent Price: 3.70 Smart Investing & Trading Score: 100 | |
| Day Percent Change: 1.09% Day Change: 0.04 | |
| Week Change: 5.71% Year-to-date Change: -8.4% | |
| CHMI Links: Profile News Message Board | |
| Charts:- Daily , Weekly | |
| Add CHMI to Watchlist: View: Get Complete CHMI Trend Analysis ➞ | |
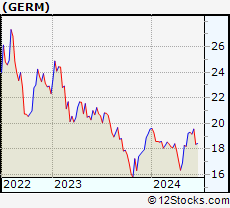 | GERM ETFMG Treatments, Testing and Advancements ETF |
| Sector: Financials | |
| SubSector: Exchange Traded Fund | |
| MarketCap: 60157 Millions | |
| Recent Price: 19.23 Smart Investing & Trading Score: 83 | |
| Day Percent Change: -1.53% Day Change: -0.30 | |
| Week Change: 5.64% Year-to-date Change: -1.7% | |
| GERM Links: Profile News Message Board | |
| Charts:- Daily , Weekly | |
| Add GERM to Watchlist: View: Get Complete GERM Trend Analysis ➞ | |
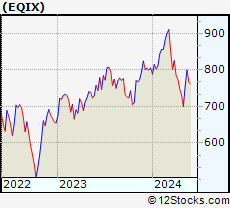 | EQIX Equinix, Inc. (REIT) |
| Sector: Financials | |
| SubSector: REIT - Diversified | |
| MarketCap: 45855.3 Millions | |
| Recent Price: 799.83 Smart Investing & Trading Score: 52 | |
| Day Percent Change: 0.04% Day Change: 0.33 | |
| Week Change: 5.56% Year-to-date Change: -0.7% | |
| EQIX Links: Profile News Message Board | |
| Charts:- Daily , Weekly | |
| Add EQIX to Watchlist: View: Get Complete EQIX Trend Analysis ➞ | |
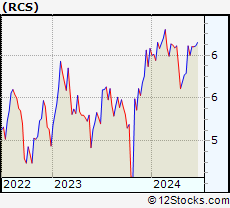 | RCS PIMCO Strategic Income Fund, Inc. |
| Sector: Financials | |
| SubSector: Closed-End Fund - Debt | |
| MarketCap: 246.607 Millions | |
| Recent Price: 6.11 Smart Investing & Trading Score: 90 | |
| Day Percent Change: 1.66% Day Change: 0.10 | |
| Week Change: 5.53% Year-to-date Change: 0.5% | |
| RCS Links: Profile News Message Board | |
| Charts:- Daily , Weekly | |
| Add RCS to Watchlist: View: Get Complete RCS Trend Analysis ➞ | |
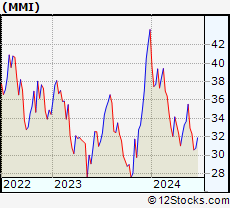 | MMI Marcus & Millichap, Inc. |
| Sector: Financials | |
| SubSector: Real Estate Development | |
| MarketCap: 1005.19 Millions | |
| Recent Price: 35.54 Smart Investing & Trading Score: 69 | |
| Day Percent Change: 0.71% Day Change: 0.25 | |
| Week Change: 5.52% Year-to-date Change: -18.6% | |
| MMI Links: Profile News Message Board | |
| Charts:- Daily , Weekly | |
| Add MMI to Watchlist: View: Get Complete MMI Trend Analysis ➞ | |
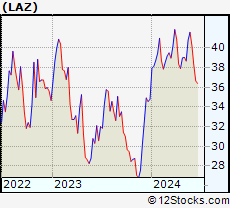 | LAZ Lazard Ltd |
| Sector: Financials | |
| SubSector: Asset Management | |
| MarketCap: 3061.13 Millions | |
| Recent Price: 40.81 Smart Investing & Trading Score: 100 | |
| Day Percent Change: 0.29% Day Change: 0.12 | |
| Week Change: 5.51% Year-to-date Change: 17.3% | |
| LAZ Links: Profile News Message Board | |
| Charts:- Daily , Weekly | |
| Add LAZ to Watchlist: View: Get Complete LAZ Trend Analysis ➞ | |
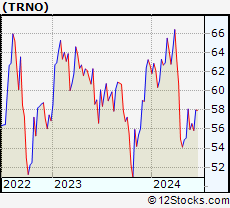 | TRNO Terreno Realty Corporation |
| Sector: Financials | |
| SubSector: REIT - Industrial | |
| MarketCap: 3359.69 Millions | |
| Recent Price: 58.10 Smart Investing & Trading Score: 64 | |
| Day Percent Change: 0.35% Day Change: 0.20 | |
| Week Change: 5.5% Year-to-date Change: -7.3% | |
| TRNO Links: Profile News Message Board | |
| Charts:- Daily , Weekly | |
| Add TRNO to Watchlist: View: Get Complete TRNO Trend Analysis ➞ | |
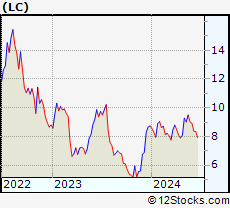 | LC LendingClub Corporation |
| Sector: Financials | |
| SubSector: Credit Services | |
| MarketCap: 852.308 Millions | |
| Recent Price: 9.50 Smart Investing & Trading Score: 90 | |
| Day Percent Change: 1.39% Day Change: 0.13 | |
| Week Change: 5.44% Year-to-date Change: 8.7% | |
| LC Links: Profile News Message Board | |
| Charts:- Daily , Weekly | |
| Add LC to Watchlist: View: Get Complete LC Trend Analysis ➞ | |
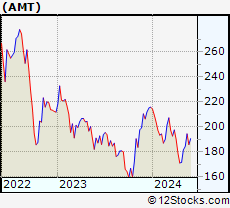 | AMT American Tower Corporation (REIT) |
| Sector: Financials | |
| SubSector: REIT - Diversified | |
| MarketCap: 92527 Millions | |
| Recent Price: 194.51 Smart Investing & Trading Score: 69 | |
| Day Percent Change: -0.22% Day Change: -0.43 | |
| Week Change: 5.43% Year-to-date Change: -9.9% | |
| AMT Links: Profile News Message Board | |
| Charts:- Daily , Weekly | |
| Add AMT to Watchlist: View: Get Complete AMT Trend Analysis ➞ | |
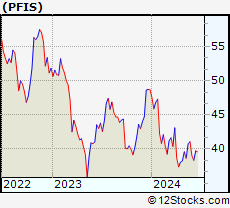 | PFIS Peoples Financial Services Corp. |
| Sector: Financials | |
| SubSector: Regional - Northeast Banks | |
| MarketCap: 305.499 Millions | |
| Recent Price: 40.75 Smart Investing & Trading Score: 100 | |
| Day Percent Change: 0.00% Day Change: 0.00 | |
| Week Change: 5.43% Year-to-date Change: -16.3% | |
| PFIS Links: Profile News Message Board | |
| Charts:- Daily , Weekly | |
| Add PFIS to Watchlist: View: Get Complete PFIS Trend Analysis ➞ | |
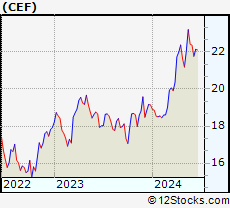 | CEF Sprott Physical Gold and Silver Trust |
| Sector: Financials | |
| SubSector: Asset Management | |
| MarketCap: 2485.33 Millions | |
| Recent Price: 23.21 Smart Investing & Trading Score: 100 | |
| Day Percent Change: 3.34% Day Change: 0.75 | |
| Week Change: 5.31% Year-to-date Change: 21.2% | |
| CEF Links: Profile News Message Board | |
| Charts:- Daily , Weekly | |
| Add CEF to Watchlist: View: Get Complete CEF Trend Analysis ➞ | |
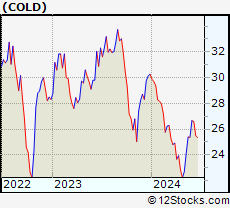 | COLD Americold Realty Trust |
| Sector: Financials | |
| SubSector: REIT - Industrial | |
| MarketCap: 6569.69 Millions | |
| Recent Price: 25.39 Smart Investing & Trading Score: 87 | |
| Day Percent Change: 2.54% Day Change: 0.63 | |
| Week Change: 5.29% Year-to-date Change: -16.1% | |
| COLD Links: Profile News Message Board | |
| Charts:- Daily , Weekly | |
| Add COLD to Watchlist: View: Get Complete COLD Trend Analysis ➞ | |
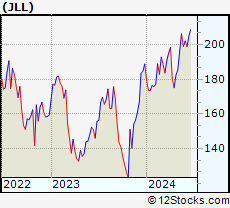 | JLL Jones Lang LaSalle Incorporated |
| Sector: Financials | |
| SubSector: Property Management | |
| MarketCap: 5259.32 Millions | |
| Recent Price: 206.20 Smart Investing & Trading Score: 88 | |
| Day Percent Change: -0.65% Day Change: -1.34 | |
| Week Change: 5.28% Year-to-date Change: 9.2% | |
| JLL Links: Profile News Message Board | |
| Charts:- Daily , Weekly | |
| Add JLL to Watchlist: View: Get Complete JLL Trend Analysis ➞ | |
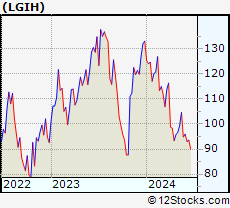 | LGIH LGI Homes, Inc. |
| Sector: Financials | |
| SubSector: Real Estate Development | |
| MarketCap: 1316.49 Millions | |
| Recent Price: 104.63 Smart Investing & Trading Score: 47 | |
| Day Percent Change: -0.58% Day Change: -0.61 | |
| Week Change: 5.27% Year-to-date Change: -21.4% | |
| LGIH Links: Profile News Message Board | |
| Charts:- Daily , Weekly | |
| Add LGIH to Watchlist: View: Get Complete LGIH Trend Analysis ➞ | |
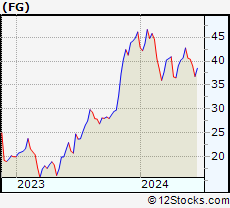 | FG F&G Annuities & Life, Inc. |
| Sector: Financials | |
| SubSector: Insurance - Life | |
| MarketCap: 2960 Millions | |
| Recent Price: 42.76 Smart Investing & Trading Score: 95 | |
| Day Percent Change: 4.96% Day Change: 2.02 | |
| Week Change: 5.22% Year-to-date Change: -7.3% | |
| FG Links: Profile News Message Board | |
| Charts:- Daily , Weekly | |
| Add FG to Watchlist: View: Get Complete FG Trend Analysis ➞ | |
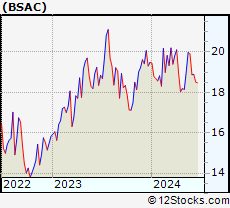 | BSAC Banco Santander-Chile |
| Sector: Financials | |
| SubSector: Money Center Banks | |
| MarketCap: 6987.59 Millions | |
| Recent Price: 19.98 Smart Investing & Trading Score: 88 | |
| Day Percent Change: 0.00% Day Change: 0.00 | |
| Week Change: 5.21% Year-to-date Change: 2.5% | |
| BSAC Links: Profile News Message Board | |
| Charts:- Daily , Weekly | |
| Add BSAC to Watchlist: View: Get Complete BSAC Trend Analysis ➞ | |
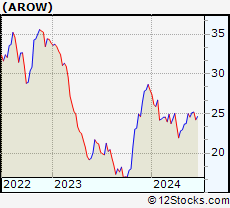 | AROW Arrow Financial Corporation |
| Sector: Financials | |
| SubSector: Regional - Northeast Banks | |
| MarketCap: 413.999 Millions | |
| Recent Price: 24.97 Smart Investing & Trading Score: 100 | |
| Day Percent Change: 0.40% Day Change: 0.10 | |
| Week Change: 5.18% Year-to-date Change: -10.6% | |
| AROW Links: Profile News Message Board | |
| Charts:- Daily , Weekly | |
| Add AROW to Watchlist: View: Get Complete AROW Trend Analysis ➞ | |
| For tabular summary view of above stock list: Summary View ➞ 0 - 25 , 25 - 50 , 50 - 75 , 75 - 100 , 100 - 125 , 125 - 150 , 150 - 175 , 175 - 200 , 200 - 225 , 225 - 250 , 250 - 275 , 275 - 300 , 300 - 325 , 325 - 350 , 350 - 375 , 375 - 400 , 400 - 425 , 425 - 450 , 450 - 475 , 475 - 500 , 500 - 525 , 525 - 550 , 550 - 575 , 575 - 600 , 600 - 625 , 625 - 650 , 650 - 675 , 675 - 700 , 700 - 725 , 725 - 750 , 750 - 775 , 775 - 800 , 800 - 825 , 825 - 850 , 850 - 875 , 875 - 900 , 900 - 925 , 925 - 950 , 950 - 975 , 975 - 1000 , 1000 - 1025 , 1025 - 1050 , 1050 - 1075 , 1075 - 1100 , 1100 - 1125 , 1125 - 1150 , 1150 - 1175 , 1175 - 1200 , 1200 - 1225 | ||
| Click To Change The Sort Order: By Market Cap or Company Size Performance: Year-to-date, Week and Day | |
| Select Chart Type: | ||
|
Best Stocks Today 12Stocks.com |
© 2024 12Stocks.com Terms & Conditions Privacy Contact Us
All Information Provided Only For Education And Not To Be Used For Investing or Trading. See Terms & Conditions


One More Thing ... Get Best Stocks Delivered Daily!
Never Ever Miss A Move With Our Top Ten Stocks Lists
Find Best Stocks In Any Market - Bull or Bear Market
Take A Peek At Our Top Ten Stocks Lists: Daily, Weekly, Year-to-Date & Top Trends
Find Best Stocks In Any Market - Bull or Bear Market
Take A Peek At Our Top Ten Stocks Lists: Daily, Weekly, Year-to-Date & Top Trends
Financial Stocks With Best Up Trends [0-bearish to 100-bullish]: Fangdd Network[100], Xinyuan Real[100], MicroSectors Gold[100], Sprott Physical[100], Citizens & Northern[100], Sumitomo Mitsui[100], First Community[100], Chubb [100], Angel Oak[100], Sprott Physical[100], Iris Energy[100]
Best Financial Stocks Year-to-Date:
Root [526.36%], Fangdd Network[149.63%], Banco Macro[126.41%], Grupo Financiero[112.4%], Banco BBVA[110.66%], SelectQuote [110.22%], Gladstone Capital[106.92%], EverQuote [98.2%], Hippo [92.54%], Grupo Supervielle[86.95%], Vista Oil[60.93%] Best Financial Stocks This Week:
Fangdd Network[360.27%], Xinyuan Real[53.28%], Iris Energy[25.68%], Fathom [25.35%], Huize Holding[21.83%], First Foundation[18.98%], Trupanion [17.21%], Bridge [16.67%], MicroSectors Gold[15.19%], KE [13.86%], Douglas Elliman[13.56%] Best Financial Stocks Daily:
Fangdd Network[321.26%], Xinyuan Real[39.49%], MicroSectors Gold[12.02%], Fathom [9.88%], Citizens [8.53%], Hywin [8.28%], Root [6.10%], First Foundation[6.09%], Sprott Physical[6.09%], Freedom Holding[5.02%], NexGen Energy[4.99%]