
 Login Sign Up


| |||||
 |  | ||||

| 12Stocks.com Market Intelligence |
Best Financial Stocks
| In a hurry? Financial Stocks Lists: Performance Trends Table, Stock Charts
Sort Financial stocks: Daily, Weekly, Year-to-Date, Market Cap & Trends. Filter Financial stocks list by size:All Financial Large Mid-Range Small & MicroCap |
| 12Stocks.com Financial Stocks Performances & Trends Daily | |||||||||
|
|  The overall Smart Investing & Trading Score is 95 (0-bearish to 100-bullish) which puts Financial sector in short term bullish trend. The Smart Investing & Trading Score from previous trading session is 100 and a deterioration of trend continues.
| ||||||||
Here are the Smart Investing & Trading Scores of the most requested Financial stocks at 12Stocks.com (click stock name for detailed review):
|


| 12Stocks.com: Investing in Financial sector with Stocks | |
|
The following table helps investors and traders sort through current performance and trends (as measured by Smart Investing & Trading Score) of various
stocks in the Financial sector. Quick View: Move mouse or cursor over stock symbol (ticker) to view short-term Technical chart and over stock name to view long term chart. Click on  to add stock symbol to your watchlist and to add stock symbol to your watchlist and  to view watchlist. Click on any ticker or stock name for detailed market intelligence report for that stock. to view watchlist. Click on any ticker or stock name for detailed market intelligence report for that stock. |
12Stocks.com Performance of Stocks in Financial Sector
| Ticker | Stock Name | Watchlist | Category | Recent Price | Smart Investing & Trading Score | Change % | Weekly Change% |
| INAQ | INSU Acquisition |   | SPAC | 11.05 | 34 | -1.78% | -5.07% |
| WRLD | World Acceptance | | Credit Services | 130.91 | 26 | -0.28% | -5.27% |
| GOCO | GoHealth | | Insurance | 8.53 | 10 | -4.32% | -5.33% |
| UNIT | Uniti | | REIT - Industrial | 3.65 | 10 | 0.55% | -5.68% |
| MCI | Barings Corporate | | Closed-End Fund - Debt | 17.62 | 0 | -0.06% | -6.09% |
| UNB | Union Bankshares | | Regional Banks | 23.80 | 0 | -1.73% | -6.11% |
| BAP | Credicorp | | Banks | 164.00 | 0 | -5.00% | -6.24% |
| GPMT | Granite Point | | Mortgage | 3.41 | 32 | 2.40% | -6.32% |
| GHLD | Guild | | Mortgage Finance | 14.06 | 48 | -0.92% | -6.45% |
| CNF | CNFinance | | Credit Services | 1.57 | 0 | -2.48% | -7.65% |
| AWH | Allied World | | Insurance | 2.66 | 10 | 0.76% | -10.44% |
| RILY | B. Riley | | Asset Mgmt | 28.41 | 36 | -0.39% | -11.61% |
| ATLC | Atlanticus | | Credit Services | 24.89 | 7 | 3.69% | -13.92% |
| OPAD | Offerpad | | Financials Services | 5.88 | 10 | -2.81% | -17.53% |
| OPRT | Oportun | | Credit Services | 3.59 | 35 | -4.52% | -18.78% |
| SRG | Seritage Growth | | REIT - | 6.14 | 10 | -1.13% | -34.12% |
| For chart view version of above stock list: Chart View ➞ 0 - 25 , 25 - 50 , 50 - 75 , 75 - 100 , 100 - 125 , 125 - 150 , 150 - 175 , 175 - 200 , 200 - 225 , 225 - 250 , 250 - 275 , 275 - 300 , 300 - 325 , 325 - 350 , 350 - 375 , 375 - 400 , 400 - 425 , 425 - 450 , 450 - 475 , 475 - 500 , 500 - 525 , 525 - 550 , 550 - 575 , 575 - 600 , 600 - 625 , 625 - 650 , 650 - 675 , 675 - 700 , 700 - 725 , 725 - 750 , 750 - 775 , 775 - 800 , 800 - 825 , 825 - 850 , 850 - 875 , 875 - 900 , 900 - 925 , 925 - 950 , 950 - 975 , 975 - 1000 , 1000 - 1025 , 1025 - 1050 , 1050 - 1075 , 1075 - 1100 , 1100 - 1125 , 1125 - 1150 , 1150 - 1175 , 1175 - 1200 , 1200 - 1225 | ||
 | Click To Change The Sort Order: By Market Cap or Company Size Performance: Year-to-date, Week and Day |  |
|
Get the most comprehensive stock market coverage daily at 12Stocks.com ➞ Best Stocks Today ➞ Best Stocks Weekly ➞ Best Stocks Year-to-Date ➞ Best Stocks Trends ➞  Best Stocks Today 12Stocks.com Best Nasdaq Stocks ➞ Best S&P 500 Stocks ➞ Best Tech Stocks ➞ Best Biotech Stocks ➞ |
| Detailed Overview of Financial Stocks |
| Financial Technical Overview, Leaders & Laggards, Top Financial ETF Funds & Detailed Financial Stocks List, Charts, Trends & More |
| Financial Sector: Technical Analysis, Trends & YTD Performance | |
| Financial sector is composed of stocks
from banks, brokers, insurance, REITs
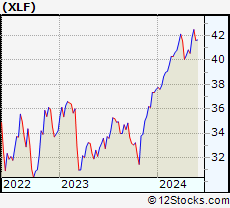
and services subsectors. Financial sector, as represented by XLF, an exchange-traded fund [ETF] that holds basket of Financial stocks (e.g, Bank of America, Goldman Sachs) is up by 13.01% and is currently outperforming the overall market by 2.44% year-to-date. Below is a quick view of Technical charts and trends: |
|
 XLF Weekly Chart |
|
| Long Term Trend: Very Good | |
| Medium Term Trend: Very Good | |
 XLF Daily Chart |
|
| Short Term Trend: Very Good | |
| Overall Trend Score: 95 | |
| YTD Performance: 13.01% | |
| **Trend Scores & Views Are Only For Educational Purposes And Not For Investing | |
| 12Stocks.com: Top Performing Financial Sector Stocks | ||||||||||||||||||||||||||||||||||||||||||||||||
 The top performing Financial sector stocks year to date are
Now, more recently, over last week, the top performing Financial sector stocks on the move are


|
||||||||||||||||||||||||||||||||||||||||||||||||
| 12Stocks.com: Investing in Financial Sector using Exchange Traded Funds | |
|
The following table shows list of key exchange traded funds (ETF) that
help investors track Financial Index. For detailed view, check out our ETF Funds section of our website. Quick View: Move mouse or cursor over ETF symbol (ticker) to view short-term Technical chart and over ETF name to view long term chart. Click on ticker or stock name for detailed view. Click on to add stock symbol to your watchlist and to view watchlist. |
12Stocks.com List of ETFs that track Financial Index
| Ticker | ETF Name | Watchlist | Recent Price | Smart Investing & Trading Score | Change % | Week % | Year-to-date % |
| XLF | Financial | | 42.49 | 95 | 0.73 | 1.58 | 13.01% |
| IAI | Broker-Dealers & Secs | | 119.47 | 100 | 1.08 | 2.59 | 10.08% |
| IYF | Financials | | 96.85 | 95 | 0.43 | 1.73 | 13.39% |
| IYG | Financial Services | | 67.11 | 95 | 0.15 | 1.56 | 12.34% |
| KRE | Regional Banking | | 51.19 | 83 | 0.23 | 1.67 | -2.37% |
| IXG | Global Financials | | 88.72 | 88 | 0.21 | 1.41 | 12.91% |
| VFH | Financials | | 103.00 | 95 | 0.18 | 1.45 | 11.64% |
| KBE | Bank | | 47.93 | 83 | 0.44 | 1.25 | 4.15% |
| FAS | Financial Bull 3X | | 112.32 | 95 | 1.81 | 4.06 | 35.9% |
| FAZ | Financial Bear 3X | | 9.75 | 10 | -1.71 | -3.75 | -28.68% |
| UYG | Financials | | 68.54 | 100 | 1.23 | 2.77 | 24.17% |
| IAT | Regional Banks | | 43.42 | 76 | -0.26 | 1.02 | 3.78% |
| KIE | Insurance | | 51.83 | 100 | 0.88 | 1.09 | 14.62% |
| PSCF | SmallCap Financials | | 49.03 | 95 | 0.28 | 1.44 | -0.31% |
| EUFN | Europe Financials | | 24.13 | 95 | 0.67 | 2.51 | 15.12% |
| PGF | Financial Preferred | | 14.81 | 52 | -0.10 | 0.68 | 1.58% |
| 12Stocks.com: Charts, Trends, Fundamental Data and Performances of Financial Stocks | |
|
We now take in-depth look at all Financial stocks including charts, multi-period performances and overall trends (as measured by Smart Investing & Trading Score). One can sort Financial stocks (click link to choose) by Daily, Weekly and by Year-to-Date performances. Also, one can sort by size of the company or by market capitalization. |
| Select Your Default Chart Type: | |||||
| |||||
| Click on stock symbol or name for detailed view. Click on to add stock symbol to your watchlist and to view watchlist. Quick View: Move mouse or cursor over "Daily" to quickly view daily Technical stock chart and over "Weekly" to view weekly Technical stock chart. | |||||

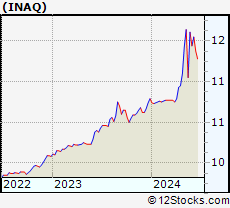 | INAQ INSU Acquisition Corp. II |
| Sector: Financials | |
| SubSector: SPAC | |
| MarketCap: 29157 Millions | |
| Recent Price: 11.05 Smart Investing & Trading Score: 34 | |
| Day Percent Change: -1.78% Day Change: -0.20 | |
| Week Change: -5.07% Year-to-date Change: 2.4% | |
| INAQ Links: Profile News Message Board | |
| Charts:- Daily , Weekly | |
| Add INAQ to Watchlist: View: Get Complete INAQ Trend Analysis ➞ | |
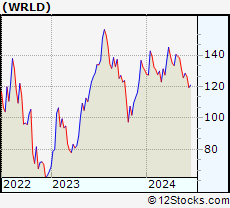 | WRLD World Acceptance Corporation |
| Sector: Financials | |
| SubSector: Credit Services | |
| MarketCap: 486.408 Millions | |
| Recent Price: 130.91 Smart Investing & Trading Score: 26 | |
| Day Percent Change: -0.28% Day Change: -0.37 | |
| Week Change: -5.27% Year-to-date Change: 0.3% | |
| WRLD Links: Profile News Message Board | |
| Charts:- Daily , Weekly | |
| Add WRLD to Watchlist: View: Get Complete WRLD Trend Analysis ➞ | |
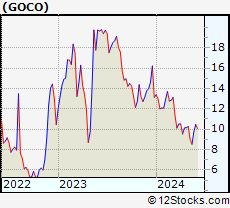 | GOCO GoHealth, Inc. |
| Sector: Financials | |
| SubSector: Insurance Brokers | |
| MarketCap: 44157 Millions | |
| Recent Price: 8.53 Smart Investing & Trading Score: 10 | |
| Day Percent Change: -4.32% Day Change: -0.38 | |
| Week Change: -5.33% Year-to-date Change: -35.0% | |
| GOCO Links: Profile News Message Board | |
| Charts:- Daily , Weekly | |
| Add GOCO to Watchlist: View: Get Complete GOCO Trend Analysis ➞ | |
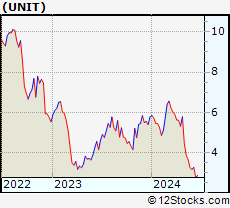 | UNIT Uniti Group Inc. |
| Sector: Financials | |
| SubSector: REIT - Industrial | |
| MarketCap: 1363.09 Millions | |
| Recent Price: 3.65 Smart Investing & Trading Score: 10 | |
| Day Percent Change: 0.55% Day Change: 0.02 | |
| Week Change: -5.68% Year-to-date Change: -36.9% | |
| UNIT Links: Profile News Message Board | |
| Charts:- Daily , Weekly | |
| Add UNIT to Watchlist: View: Get Complete UNIT Trend Analysis ➞ | |
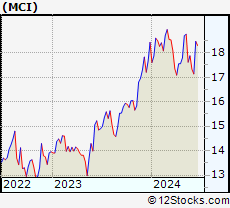 | MCI Barings Corporate Investors |
| Sector: Financials | |
| SubSector: Closed-End Fund - Debt | |
| MarketCap: 207.607 Millions | |
| Recent Price: 17.62 Smart Investing & Trading Score: 0 | |
| Day Percent Change: -0.06% Day Change: -0.01 | |
| Week Change: -6.09% Year-to-date Change: -4.4% | |
| MCI Links: Profile News Message Board | |
| Charts:- Daily , Weekly | |
| Add MCI to Watchlist: View: Get Complete MCI Trend Analysis ➞ | |
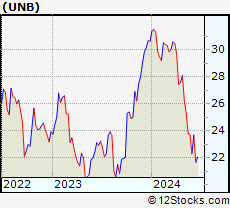 | UNB Union Bankshares, Inc. |
| Sector: Financials | |
| SubSector: Regional - Northeast Banks | |
| MarketCap: 130.499 Millions | |
| Recent Price: 23.80 Smart Investing & Trading Score: 0 | |
| Day Percent Change: -1.73% Day Change: -0.42 | |
| Week Change: -6.11% Year-to-date Change: -22.4% | |
| UNB Links: Profile News Message Board | |
| Charts:- Daily , Weekly | |
| Add UNB to Watchlist: View: Get Complete UNB Trend Analysis ➞ | |
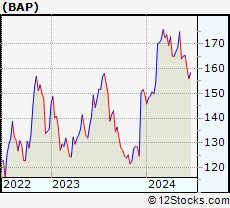 | BAP Credicorp Ltd. |
| Sector: Financials | |
| SubSector: Money Center Banks | |
| MarketCap: 11809.9 Millions | |
| Recent Price: 164.00 Smart Investing & Trading Score: 0 | |
| Day Percent Change: -5.00% Day Change: -8.63 | |
| Week Change: -6.24% Year-to-date Change: 9.4% | |
| BAP Links: Profile News Message Board | |
| Charts:- Daily , Weekly | |
| Add BAP to Watchlist: View: Get Complete BAP Trend Analysis ➞ | |
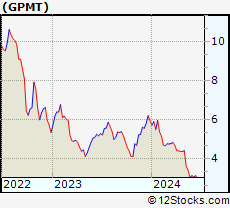 | GPMT Granite Point Mortgage Trust Inc. |
| Sector: Financials | |
| SubSector: Mortgage Investment | |
| MarketCap: 289.739 Millions | |
| Recent Price: 3.41 Smart Investing & Trading Score: 32 | |
| Day Percent Change: 2.40% Day Change: 0.08 | |
| Week Change: -6.32% Year-to-date Change: -42.6% | |
| GPMT Links: Profile News Message Board | |
| Charts:- Daily , Weekly | |
| Add GPMT to Watchlist: View: Get Complete GPMT Trend Analysis ➞ | |
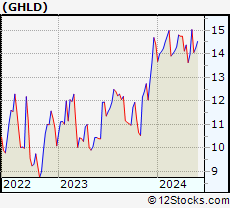 | GHLD Guild Holdings Company |
| Sector: Financials | |
| SubSector: Mortgage Finance | |
| MarketCap: 91157 Millions | |
| Recent Price: 14.06 Smart Investing & Trading Score: 48 | |
| Day Percent Change: -0.92% Day Change: -0.13 | |
| Week Change: -6.45% Year-to-date Change: -2.5% | |
| GHLD Links: Profile News Message Board | |
| Charts:- Daily , Weekly | |
| Add GHLD to Watchlist: View: Get Complete GHLD Trend Analysis ➞ | |
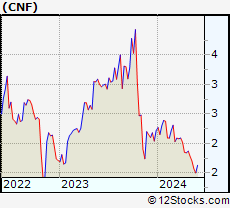 | CNF CNFinance Holdings Limited |
| Sector: Financials | |
| SubSector: Credit Services | |
| MarketCap: 277.408 Millions | |
| Recent Price: 1.57 Smart Investing & Trading Score: 0 | |
| Day Percent Change: -2.48% Day Change: -0.04 | |
| Week Change: -7.65% Year-to-date Change: -29.3% | |
| CNF Links: Profile News Message Board | |
| Charts:- Daily , Weekly | |
| Add CNF to Watchlist: View: Get Complete CNF Trend Analysis ➞ | |
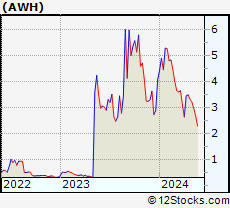 | AWH Allied World Assurance Company Holdings, AG |
| Sector: Financials | |
| SubSector: Property & Casualty Insurance | |
| MarketCap: 4663.47 Millions | |
| Recent Price: 2.66 Smart Investing & Trading Score: 10 | |
| Day Percent Change: 0.76% Day Change: 0.02 | |
| Week Change: -10.44% Year-to-date Change: -34.8% | |
| AWH Links: Profile News Message Board | |
| Charts:- Daily , Weekly | |
| Add AWH to Watchlist: View: Get Complete AWH Trend Analysis ➞ | |
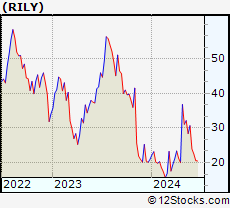 | RILY B. Riley Financial, Inc. |
| Sector: Financials | |
| SubSector: Asset Management | |
| MarketCap: 443.703 Millions | |
| Recent Price: 28.41 Smart Investing & Trading Score: 36 | |
| Day Percent Change: -0.39% Day Change: -0.11 | |
| Week Change: -11.61% Year-to-date Change: 35.4% | |
| RILY Links: Profile News Message Board | |
| Charts:- Daily , Weekly | |
| Add RILY to Watchlist: View: Get Complete RILY Trend Analysis ➞ | |
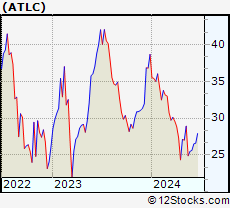 | ATLC Atlanticus Holdings Corporation |
| Sector: Financials | |
| SubSector: Credit Services | |
| MarketCap: 122.008 Millions | |
| Recent Price: 24.89 Smart Investing & Trading Score: 7 | |
| Day Percent Change: 3.69% Day Change: 0.89 | |
| Week Change: -13.92% Year-to-date Change: -35.7% | |
| ATLC Links: Profile News Message Board | |
| Charts:- Daily , Weekly | |
| Add ATLC to Watchlist: View: Get Complete ATLC Trend Analysis ➞ | |
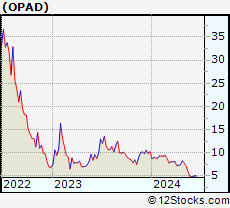 | OPAD Offerpad Solutions Inc. |
| Sector: Financials | |
| SubSector: Financials Services | |
| MarketCap: 345 Millions | |
| Recent Price: 5.88 Smart Investing & Trading Score: 10 | |
| Day Percent Change: -2.81% Day Change: -0.17 | |
| Week Change: -17.53% Year-to-date Change: -42.6% | |
| OPAD Links: Profile News Message Board | |
| Charts:- Daily , Weekly | |
| Add OPAD to Watchlist: View: Get Complete OPAD Trend Analysis ➞ | |
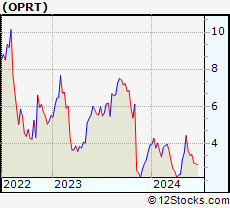 | OPRT Oportun Financial Corporation |
| Sector: Financials | |
| SubSector: Credit Services | |
| MarketCap: 360.208 Millions | |
| Recent Price: 3.59 Smart Investing & Trading Score: 35 | |
| Day Percent Change: -4.52% Day Change: -0.17 | |
| Week Change: -18.78% Year-to-date Change: -8.2% | |
| OPRT Links: Profile News Message Board | |
| Charts:- Daily , Weekly | |
| Add OPRT to Watchlist: View: Get Complete OPRT Trend Analysis ➞ | |
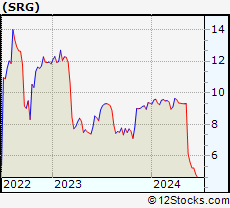 | SRG Seritage Growth Properties |
| Sector: Financials | |
| SubSector: REIT - Diversified | |
| MarketCap: 293.453 Millions | |
| Recent Price: 6.14 Smart Investing & Trading Score: 10 | |
| Day Percent Change: -1.13% Day Change: -0.07 | |
| Week Change: -34.12% Year-to-date Change: -34.3% | |
| SRG Links: Profile News Message Board | |
| Charts:- Daily , Weekly | |
| Add SRG to Watchlist: View: Get Complete SRG Trend Analysis ➞ | |
| For tabular summary view of above stock list: Summary View ➞ 0 - 25 , 25 - 50 , 50 - 75 , 75 - 100 , 100 - 125 , 125 - 150 , 150 - 175 , 175 - 200 , 200 - 225 , 225 - 250 , 250 - 275 , 275 - 300 , 300 - 325 , 325 - 350 , 350 - 375 , 375 - 400 , 400 - 425 , 425 - 450 , 450 - 475 , 475 - 500 , 500 - 525 , 525 - 550 , 550 - 575 , 575 - 600 , 600 - 625 , 625 - 650 , 650 - 675 , 675 - 700 , 700 - 725 , 725 - 750 , 750 - 775 , 775 - 800 , 800 - 825 , 825 - 850 , 850 - 875 , 875 - 900 , 900 - 925 , 925 - 950 , 950 - 975 , 975 - 1000 , 1000 - 1025 , 1025 - 1050 , 1050 - 1075 , 1075 - 1100 , 1100 - 1125 , 1125 - 1150 , 1150 - 1175 , 1175 - 1200 , 1200 - 1225 | ||
| Click To Change The Sort Order: By Market Cap or Company Size Performance: Year-to-date, Week and Day | |
| Select Chart Type: | ||
|
Best Stocks Today 12Stocks.com |
© 2024 12Stocks.com Terms & Conditions Privacy Contact Us
All Information Provided Only For Education And Not To Be Used For Investing or Trading. See Terms & Conditions


One More Thing ... Get Best Stocks Delivered Daily!
Never Ever Miss A Move With Our Top Ten Stocks Lists
Find Best Stocks In Any Market - Bull or Bear Market
Take A Peek At Our Top Ten Stocks Lists: Daily, Weekly, Year-to-Date & Top Trends
Find Best Stocks In Any Market - Bull or Bear Market
Take A Peek At Our Top Ten Stocks Lists: Daily, Weekly, Year-to-Date & Top Trends
Financial Stocks With Best Up Trends [0-bearish to 100-bullish]: Fangdd Network[100], Xinyuan Real[100], MicroSectors Gold[100], Sprott Physical[100], Citizens & Northern[100], Sumitomo Mitsui[100], First Community[100], Chubb [100], Angel Oak[100], Sprott Physical[100], Iris Energy[100]
Best Financial Stocks Year-to-Date:
Root [526.36%], Fangdd Network[149.63%], Banco Macro[126.41%], Grupo Financiero[112.4%], Banco BBVA[110.66%], SelectQuote [110.22%], Gladstone Capital[106.92%], EverQuote [98.2%], Hippo [92.54%], Grupo Supervielle[86.95%], Vista Oil[60.93%] Best Financial Stocks This Week:
Fangdd Network[360.27%], Xinyuan Real[53.28%], Iris Energy[25.68%], Fathom [25.35%], Huize Holding[21.83%], First Foundation[18.98%], Trupanion [17.21%], Bridge [16.67%], MicroSectors Gold[15.19%], KE [13.86%], Douglas Elliman[13.56%] Best Financial Stocks Daily:
Fangdd Network[321.26%], Xinyuan Real[39.49%], MicroSectors Gold[12.02%], Fathom [9.88%], Citizens [8.53%], Hywin [8.28%], Root [6.10%], First Foundation[6.09%], Sprott Physical[6.09%], Freedom Holding[5.02%], NexGen Energy[4.99%]