
 Login Sign Up


| |||||
 |  | ||||

| 12Stocks.com Market Intelligence |
Best Financial Stocks
| In a hurry? Financial Stocks Lists: Performance Trends Table, Stock Charts
Sort Financial stocks: Daily, Weekly, Year-to-Date, Market Cap & Trends. Filter Financial stocks list by size:All Financial Large Mid-Range Small & MicroCap |
| 12Stocks.com Financial Stocks Performances & Trends Daily | |||||||||
|
|  The overall Smart Investing & Trading Score is 95 (0-bearish to 100-bullish) which puts Financial sector in short term bullish trend. The Smart Investing & Trading Score from previous trading session is 100 and a deterioration of trend continues.
| ||||||||
Here are the Smart Investing & Trading Scores of the most requested Financial stocks at 12Stocks.com (click stock name for detailed review):
|


| 12Stocks.com: Investing in Financial sector with Stocks | |
|
The following table helps investors and traders sort through current performance and trends (as measured by Smart Investing & Trading Score) of various
stocks in the Financial sector. Quick View: Move mouse or cursor over stock symbol (ticker) to view short-term Technical chart and over stock name to view long term chart. Click on  to add stock symbol to your watchlist and to add stock symbol to your watchlist and  to view watchlist. Click on any ticker or stock name for detailed market intelligence report for that stock. to view watchlist. Click on any ticker or stock name for detailed market intelligence report for that stock. |
12Stocks.com Performance of Stocks in Financial Sector
| Ticker | Stock Name | Watchlist | Category | Recent Price | Smart Investing & Trading Score | Change % | Weekly Change% |
| IBN | ICICI Bank |   | Banks | 27.21 | 93 | 0.41% | 1.57% |
| BMO | Bank of Montreal | | Banks | 95.22 | 88 | 0.82% | 1.57% |
| HONE | HarborOne Bancorp | | S&L | 11.02 | 90 | 0.73% | 1.57% |
| VIRS | Pacer BioThreat | | Exchange Traded Fund | 36.05 | 90 | 0.22% | 1.56% |
| KB | KB | | Foreign Banks | 58.81 | 83 | -0.86% | 1.55% |
| RORO | ATAC US | | Exchange Traded Fund | 17.70 | 40 | -0.65% | 1.55% |
| KYN | Kayne Anderson | | Closed-End Fund - Equity | 9.95 | 100 | 0.91% | 1.54% |
| IRT | Independence Realty | | REIT | 17.11 | 76 | -0.12% | 1.54% |
| MSTB | LHA Market | | Exchange Traded Fund | 31.41 | 83 | -0.16% | 1.54% |
| AKR | Acadia Realty | | Property Mgmt | 17.29 | 66 | 0.17% | 1.53% |
| MPB | Mid Penn | | Regional Banks | 21.85 | 83 | -0.25% | 1.53% |
| FSD | First Trust | | Closed-End Fund - Debt | 11.95 | 90 | 0.34% | 1.53% |
| DWAW | AdvisorShares Dorsey | | Exchange Traded Fund | 37.21 | 83 | -0.22% | 1.53% |
| IQSI | IQ Candriam | | Exchange Traded Fund | 30.28 | 83 | -0.05% | 1.53% |
| DFAU | Dimensional US | | Exchange Traded Fund | 36.84 | 83 | 0.11% | 1.52% |
| CCBG | Capital City | | Regional Banks | 28.15 | 87 | -0.25% | 1.51% |
| GDV | Gabelli Dividend | | Closed-End Fund - Equity | 22.87 | 88 | 0.04% | 1.51% |
| ETG | Eaton Vance | | Closed-End Fund - Equity | 18.45 | 90 | -0.24% | 1.51% |
| CIGI | Colliers | | Property Mgmt | 115.89 | 70 | -0.60% | 1.51% |
| GBAB | Guggenheim Taxable | | Closed-End Fund - Debt | 16.10 | 58 | 0.25% | 1.51% |
| AMTR | ETRACS Alerian | | Exchange Traded Fund | 60.09 | 100 | 0.69% | 1.51% |
| NPFD | Nuveen Variable | | Closed-End Fund - Equity | 17.82 | 95 | 0.62% | 1.51% |
| TCBI | Texas Capital | | Regional - Southwest Banks | 62.36 | 83 | 0.02% | 1.50% |
| MFG | Mizuho | | Foreign Banks | 4.06 | 85 | 2.78% | 1.50% |
| BTA | BlackRock Long-Term | | Closed-End Fund - Debt | 10.30 | 95 | 0.49% | 1.48% |
| For chart view version of above stock list: Chart View ➞ 0 - 25 , 25 - 50 , 50 - 75 , 75 - 100 , 100 - 125 , 125 - 150 , 150 - 175 , 175 - 200 , 200 - 225 , 225 - 250 , 250 - 275 , 275 - 300 , 300 - 325 , 325 - 350 , 350 - 375 , 375 - 400 , 400 - 425 , 425 - 450 , 450 - 475 , 475 - 500 , 500 - 525 , 525 - 550 , 550 - 575 , 575 - 600 , 600 - 625 , 625 - 650 , 650 - 675 , 675 - 700 , 700 - 725 , 725 - 750 , 750 - 775 , 775 - 800 , 800 - 825 , 825 - 850 , 850 - 875 , 875 - 900 , 900 - 925 , 925 - 950 , 950 - 975 , 975 - 1000 , 1000 - 1025 , 1025 - 1050 , 1050 - 1075 , 1075 - 1100 , 1100 - 1125 , 1125 - 1150 , 1150 - 1175 , 1175 - 1200 , 1200 - 1225 | ||
 | Click To Change The Sort Order: By Market Cap or Company Size Performance: Year-to-date, Week and Day |  |
|
Get the most comprehensive stock market coverage daily at 12Stocks.com ➞ Best Stocks Today ➞ Best Stocks Weekly ➞ Best Stocks Year-to-Date ➞ Best Stocks Trends ➞  Best Stocks Today 12Stocks.com Best Nasdaq Stocks ➞ Best S&P 500 Stocks ➞ Best Tech Stocks ➞ Best Biotech Stocks ➞ |
| Detailed Overview of Financial Stocks |
| Financial Technical Overview, Leaders & Laggards, Top Financial ETF Funds & Detailed Financial Stocks List, Charts, Trends & More |
| Financial Sector: Technical Analysis, Trends & YTD Performance | |
| Financial sector is composed of stocks
from banks, brokers, insurance, REITs
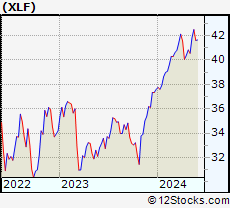
and services subsectors. Financial sector, as represented by XLF, an exchange-traded fund [ETF] that holds basket of Financial stocks (e.g, Bank of America, Goldman Sachs) is up by 13.01% and is currently outperforming the overall market by 2.44% year-to-date. Below is a quick view of Technical charts and trends: |
|
 XLF Weekly Chart |
|
| Long Term Trend: Very Good | |
| Medium Term Trend: Very Good | |
 XLF Daily Chart |
|
| Short Term Trend: Very Good | |
| Overall Trend Score: 95 | |
| YTD Performance: 13.01% | |
| **Trend Scores & Views Are Only For Educational Purposes And Not For Investing | |
| 12Stocks.com: Top Performing Financial Sector Stocks | ||||||||||||||||||||||||||||||||||||||||||||||||
 The top performing Financial sector stocks year to date are
Now, more recently, over last week, the top performing Financial sector stocks on the move are


|
||||||||||||||||||||||||||||||||||||||||||||||||
| 12Stocks.com: Investing in Financial Sector using Exchange Traded Funds | |
|
The following table shows list of key exchange traded funds (ETF) that
help investors track Financial Index. For detailed view, check out our ETF Funds section of our website. Quick View: Move mouse or cursor over ETF symbol (ticker) to view short-term Technical chart and over ETF name to view long term chart. Click on ticker or stock name for detailed view. Click on to add stock symbol to your watchlist and to view watchlist. |
12Stocks.com List of ETFs that track Financial Index
| Ticker | ETF Name | Watchlist | Recent Price | Smart Investing & Trading Score | Change % | Week % | Year-to-date % |
| XLF | Financial | | 42.49 | 95 | 0.73 | 1.58 | 13.01% |
| IAI | Broker-Dealers & Secs | | 119.47 | 100 | 1.08 | 2.59 | 10.08% |
| IYF | Financials | | 96.85 | 95 | 0.43 | 1.73 | 13.39% |
| IYG | Financial Services | | 67.11 | 95 | 0.15 | 1.56 | 12.34% |
| KRE | Regional Banking | | 51.19 | 83 | 0.23 | 1.67 | -2.37% |
| IXG | Global Financials | | 88.72 | 88 | 0.21 | 1.41 | 12.91% |
| VFH | Financials | | 103.00 | 95 | 0.18 | 1.45 | 11.64% |
| KBE | Bank | | 47.93 | 83 | 0.44 | 1.25 | 4.15% |
| FAS | Financial Bull 3X | | 112.32 | 95 | 1.81 | 4.06 | 35.9% |
| FAZ | Financial Bear 3X | | 9.75 | 10 | -1.71 | -3.75 | -28.68% |
| UYG | Financials | | 68.54 | 100 | 1.23 | 2.77 | 24.17% |
| IAT | Regional Banks | | 43.42 | 76 | -0.26 | 1.02 | 3.78% |
| KIE | Insurance | | 51.83 | 100 | 0.88 | 1.09 | 14.62% |
| PSCF | SmallCap Financials | | 49.03 | 95 | 0.28 | 1.44 | -0.31% |
| EUFN | Europe Financials | | 24.13 | 95 | 0.67 | 2.51 | 15.12% |
| PGF | Financial Preferred | | 14.81 | 52 | -0.10 | 0.68 | 1.58% |
| 12Stocks.com: Charts, Trends, Fundamental Data and Performances of Financial Stocks | |
|
We now take in-depth look at all Financial stocks including charts, multi-period performances and overall trends (as measured by Smart Investing & Trading Score). One can sort Financial stocks (click link to choose) by Daily, Weekly and by Year-to-Date performances. Also, one can sort by size of the company or by market capitalization. |
| Select Your Default Chart Type: | |||||
| |||||
| Click on stock symbol or name for detailed view. Click on to add stock symbol to your watchlist and to view watchlist. Quick View: Move mouse or cursor over "Daily" to quickly view daily Technical stock chart and over "Weekly" to view weekly Technical stock chart. | |||||

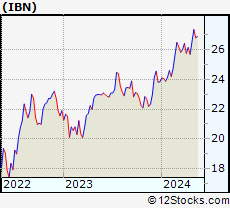 | IBN ICICI Bank Limited |
| Sector: Financials | |
| SubSector: Money Center Banks | |
| MarketCap: 31194.1 Millions | |
| Recent Price: 27.21 Smart Investing & Trading Score: 93 | |
| Day Percent Change: 0.41% Day Change: 0.11 | |
| Week Change: 1.57% Year-to-date Change: 14.1% | |
| IBN Links: Profile News Message Board | |
| Charts:- Daily , Weekly | |
| Add IBN to Watchlist: View: Get Complete IBN Trend Analysis ➞ | |
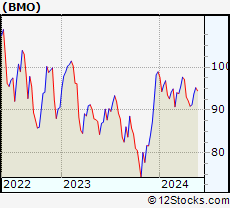 | BMO Bank of Montreal |
| Sector: Financials | |
| SubSector: Money Center Banks | |
| MarketCap: 32830.2 Millions | |
| Recent Price: 95.22 Smart Investing & Trading Score: 88 | |
| Day Percent Change: 0.82% Day Change: 0.77 | |
| Week Change: 1.57% Year-to-date Change: -3.8% | |
| BMO Links: Profile News Message Board | |
| Charts:- Daily , Weekly | |
| Add BMO to Watchlist: View: Get Complete BMO Trend Analysis ➞ | |
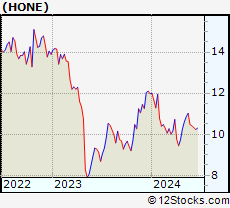 | HONE HarborOne Bancorp, Inc. |
| Sector: Financials | |
| SubSector: Savings & Loans | |
| MarketCap: 456.03 Millions | |
| Recent Price: 11.02 Smart Investing & Trading Score: 90 | |
| Day Percent Change: 0.73% Day Change: 0.08 | |
| Week Change: 1.57% Year-to-date Change: -8.0% | |
| HONE Links: Profile News Message Board | |
| Charts:- Daily , Weekly | |
| Add HONE to Watchlist: View: Get Complete HONE Trend Analysis ➞ | |
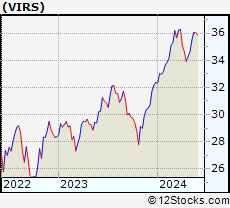 | VIRS Pacer BioThreat Strategy ETF |
| Sector: Financials | |
| SubSector: Exchange Traded Fund | |
| MarketCap: 60157 Millions | |
| Recent Price: 36.05 Smart Investing & Trading Score: 90 | |
| Day Percent Change: 0.22% Day Change: 0.08 | |
| Week Change: 1.56% Year-to-date Change: 11.3% | |
| VIRS Links: Profile News Message Board | |
| Charts:- Daily , Weekly | |
| Add VIRS to Watchlist: View: Get Complete VIRS Trend Analysis ➞ | |
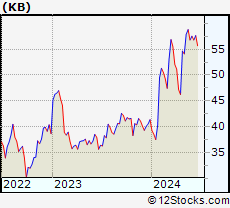 | KB KB Financial Group Inc. |
| Sector: Financials | |
| SubSector: Foreign Regional Banks | |
| MarketCap: 10853.9 Millions | |
| Recent Price: 58.81 Smart Investing & Trading Score: 83 | |
| Day Percent Change: -0.86% Day Change: -0.51 | |
| Week Change: 1.55% Year-to-date Change: 42.2% | |
| KB Links: Profile News Message Board | |
| Charts:- Daily , Weekly | |
| Add KB to Watchlist: View: Get Complete KB Trend Analysis ➞ | |
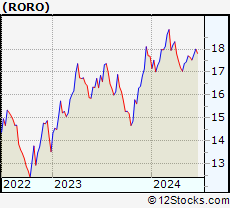 | RORO ATAC US Rotation ETF |
| Sector: Financials | |
| SubSector: Exchange Traded Fund | |
| MarketCap: 60157 Millions | |
| Recent Price: 17.70 Smart Investing & Trading Score: 40 | |
| Day Percent Change: -0.65% Day Change: -0.12 | |
| Week Change: 1.55% Year-to-date Change: 0.1% | |
| RORO Links: Profile News Message Board | |
| Charts:- Daily , Weekly | |
| Add RORO to Watchlist: View: Get Complete RORO Trend Analysis ➞ | |
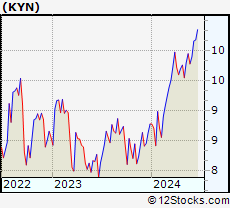 | KYN Kayne Anderson MLP/Midstream Investment Company |
| Sector: Financials | |
| SubSector: Closed-End Fund - Equity | |
| MarketCap: 440.947 Millions | |
| Recent Price: 9.95 Smart Investing & Trading Score: 100 | |
| Day Percent Change: 0.91% Day Change: 0.09 | |
| Week Change: 1.54% Year-to-date Change: 13.3% | |
| KYN Links: Profile News Message Board | |
| Charts:- Daily , Weekly | |
| Add KYN to Watchlist: View: Get Complete KYN Trend Analysis ➞ | |
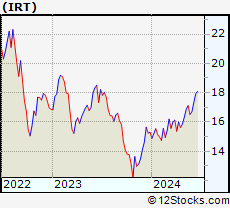 | IRT Independence Realty Trust, Inc. |
| Sector: Financials | |
| SubSector: REIT - Residential | |
| MarketCap: 980.161 Millions | |
| Recent Price: 17.11 Smart Investing & Trading Score: 76 | |
| Day Percent Change: -0.12% Day Change: -0.02 | |
| Week Change: 1.54% Year-to-date Change: 11.8% | |
| IRT Links: Profile News Message Board | |
| Charts:- Daily , Weekly | |
| Add IRT to Watchlist: View: Get Complete IRT Trend Analysis ➞ | |
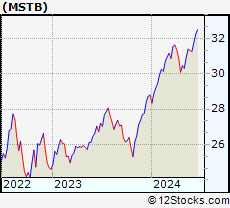 | MSTB LHA Market State Tactical Beta ETF |
| Sector: Financials | |
| SubSector: Exchange Traded Fund | |
| MarketCap: 60157 Millions | |
| Recent Price: 31.41 Smart Investing & Trading Score: 83 | |
| Day Percent Change: -0.16% Day Change: -0.05 | |
| Week Change: 1.54% Year-to-date Change: 9.0% | |
| MSTB Links: Profile News Message Board | |
| Charts:- Daily , Weekly | |
| Add MSTB to Watchlist: View: Get Complete MSTB Trend Analysis ➞ | |
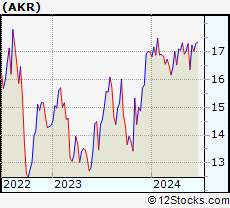 | AKR Acadia Realty Trust |
| Sector: Financials | |
| SubSector: Property Management | |
| MarketCap: 1367.42 Millions | |
| Recent Price: 17.29 Smart Investing & Trading Score: 66 | |
| Day Percent Change: 0.17% Day Change: 0.03 | |
| Week Change: 1.53% Year-to-date Change: 1.8% | |
| AKR Links: Profile News Message Board | |
| Charts:- Daily , Weekly | |
| Add AKR to Watchlist: View: Get Complete AKR Trend Analysis ➞ | |
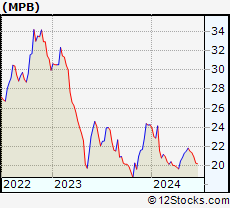 | MPB Mid Penn Bancorp, Inc. |
| Sector: Financials | |
| SubSector: Regional - Northeast Banks | |
| MarketCap: 187.699 Millions | |
| Recent Price: 21.85 Smart Investing & Trading Score: 83 | |
| Day Percent Change: -0.25% Day Change: -0.05 | |
| Week Change: 1.53% Year-to-date Change: -10.0% | |
| MPB Links: Profile News Message Board | |
| Charts:- Daily , Weekly | |
| Add MPB to Watchlist: View: Get Complete MPB Trend Analysis ➞ | |
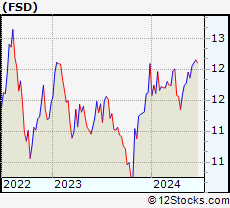 | FSD First Trust High Income Long/Short Fund |
| Sector: Financials | |
| SubSector: Closed-End Fund - Debt | |
| MarketCap: 362.607 Millions | |
| Recent Price: 11.95 Smart Investing & Trading Score: 90 | |
| Day Percent Change: 0.34% Day Change: 0.04 | |
| Week Change: 1.53% Year-to-date Change: -1.2% | |
| FSD Links: Profile News Message Board | |
| Charts:- Daily , Weekly | |
| Add FSD to Watchlist: View: Get Complete FSD Trend Analysis ➞ | |
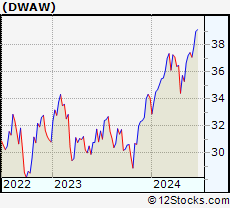 | DWAW AdvisorShares Dorsey Wright FSM All Cap World ETF |
| Sector: Financials | |
| SubSector: Exchange Traded Fund | |
| MarketCap: 60157 Millions | |
| Recent Price: 37.21 Smart Investing & Trading Score: 83 | |
| Day Percent Change: -0.22% Day Change: -0.08 | |
| Week Change: 1.53% Year-to-date Change: 9.2% | |
| DWAW Links: Profile News Message Board | |
| Charts:- Daily , Weekly | |
| Add DWAW to Watchlist: View: Get Complete DWAW Trend Analysis ➞ | |
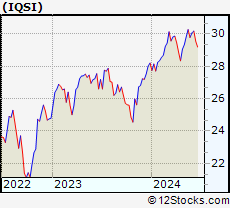 | IQSI IQ Candriam ESG International Equity ETF |
| Sector: Financials | |
| SubSector: Exchange Traded Fund | |
| MarketCap: 60157 Millions | |
| Recent Price: 30.28 Smart Investing & Trading Score: 83 | |
| Day Percent Change: -0.05% Day Change: -0.01 | |
| Week Change: 1.53% Year-to-date Change: 7.3% | |
| IQSI Links: Profile News Message Board | |
| Charts:- Daily , Weekly | |
| Add IQSI to Watchlist: View: Get Complete IQSI Trend Analysis ➞ | |
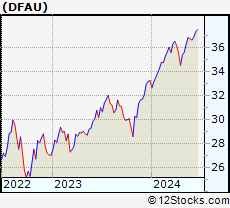 | DFAU Dimensional US Core Equity Market ETF |
| Sector: Financials | |
| SubSector: Exchange Traded Fund | |
| MarketCap: 60157 Millions | |
| Recent Price: 36.84 Smart Investing & Trading Score: 83 | |
| Day Percent Change: 0.11% Day Change: 0.04 | |
| Week Change: 1.52% Year-to-date Change: 10.8% | |
| DFAU Links: Profile News Message Board | |
| Charts:- Daily , Weekly | |
| Add DFAU to Watchlist: View: Get Complete DFAU Trend Analysis ➞ | |
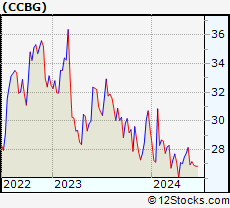 | CCBG Capital City Bank Group, Inc. |
| Sector: Financials | |
| SubSector: Regional - Mid-Atlantic Banks | |
| MarketCap: 314.459 Millions | |
| Recent Price: 28.15 Smart Investing & Trading Score: 87 | |
| Day Percent Change: -0.25% Day Change: -0.07 | |
| Week Change: 1.51% Year-to-date Change: -4.4% | |
| CCBG Links: Profile News Message Board | |
| Charts:- Daily , Weekly | |
| Add CCBG to Watchlist: View: Get Complete CCBG Trend Analysis ➞ | |
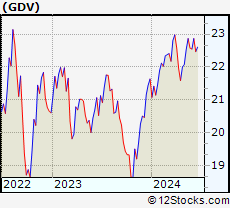 | GDV The Gabelli Dividend & Income Trust |
| Sector: Financials | |
| SubSector: Closed-End Fund - Equity | |
| MarketCap: 1079.97 Millions | |
| Recent Price: 22.87 Smart Investing & Trading Score: 88 | |
| Day Percent Change: 0.04% Day Change: 0.01 | |
| Week Change: 1.51% Year-to-date Change: 5.7% | |
| GDV Links: Profile News Message Board | |
| Charts:- Daily , Weekly | |
| Add GDV to Watchlist: View: Get Complete GDV Trend Analysis ➞ | |
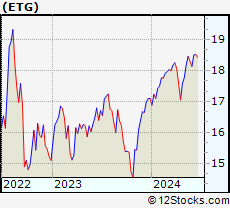 | ETG Eaton Vance Tax-Advantaged Global Dividend Income Fund |
| Sector: Financials | |
| SubSector: Closed-End Fund - Equity | |
| MarketCap: 759.147 Millions | |
| Recent Price: 18.45 Smart Investing & Trading Score: 90 | |
| Day Percent Change: -0.24% Day Change: -0.05 | |
| Week Change: 1.51% Year-to-date Change: 7.9% | |
| ETG Links: Profile News Message Board | |
| Charts:- Daily , Weekly | |
| Add ETG to Watchlist: View: Get Complete ETG Trend Analysis ➞ | |
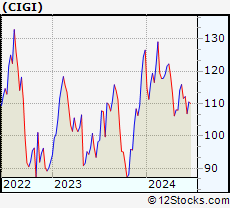 | CIGI Colliers International Group Inc. |
| Sector: Financials | |
| SubSector: Property Management | |
| MarketCap: 1928.42 Millions | |
| Recent Price: 115.89 Smart Investing & Trading Score: 70 | |
| Day Percent Change: -0.60% Day Change: -0.70 | |
| Week Change: 1.51% Year-to-date Change: -8.4% | |
| CIGI Links: Profile News Message Board | |
| Charts:- Daily , Weekly | |
| Add CIGI to Watchlist: View: Get Complete CIGI Trend Analysis ➞ | |
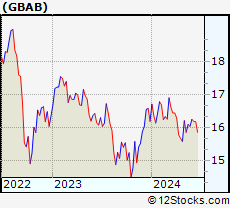 | GBAB Guggenheim Taxable Municipal Managed Duration Trust |
| Sector: Financials | |
| SubSector: Closed-End Fund - Debt | |
| MarketCap: 344.607 Millions | |
| Recent Price: 16.10 Smart Investing & Trading Score: 58 | |
| Day Percent Change: 0.25% Day Change: 0.04 | |
| Week Change: 1.51% Year-to-date Change: -0.6% | |
| GBAB Links: Profile News Message Board | |
| Charts:- Daily , Weekly | |
| Add GBAB to Watchlist: View: Get Complete GBAB Trend Analysis ➞ | |
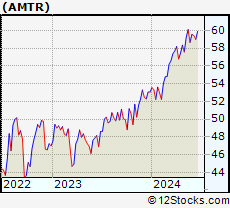 | AMTR ETRACS Alerian Midstream Energy Total Return Index ETN |
| Sector: Financials | |
| SubSector: Exchange Traded Fund | |
| MarketCap: 60157 Millions | |
| Recent Price: 60.09 Smart Investing & Trading Score: 100 | |
| Day Percent Change: 0.69% Day Change: 0.41 | |
| Week Change: 1.51% Year-to-date Change: 13.3% | |
| AMTR Links: Profile News Message Board | |
| Charts:- Daily , Weekly | |
| Add AMTR to Watchlist: View: Get Complete AMTR Trend Analysis ➞ | |
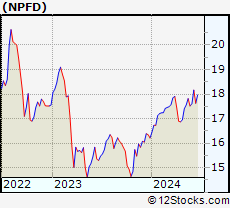 | NPFD Nuveen Variable Rate Preferred & Income Fund |
| Sector: Financials | |
| SubSector: Closed-End Fund - Equity | |
| MarketCap: 374 Millions | |
| Recent Price: 17.82 Smart Investing & Trading Score: 95 | |
| Day Percent Change: 0.62% Day Change: 0.11 | |
| Week Change: 1.51% Year-to-date Change: 9.9% | |
| NPFD Links: Profile News Message Board | |
| Charts:- Daily , Weekly | |
| Add NPFD to Watchlist: View: Get Complete NPFD Trend Analysis ➞ | |
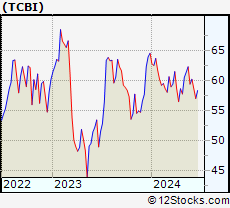 | TCBI Texas Capital Bancshares, Inc. |
| Sector: Financials | |
| SubSector: Regional - Southwest Banks | |
| MarketCap: 1202.75 Millions | |
| Recent Price: 62.36 Smart Investing & Trading Score: 83 | |
| Day Percent Change: 0.02% Day Change: 0.01 | |
| Week Change: 1.5% Year-to-date Change: -3.5% | |
| TCBI Links: Profile News Message Board | |
| Charts:- Daily , Weekly | |
| Add TCBI to Watchlist: View: Get Complete TCBI Trend Analysis ➞ | |
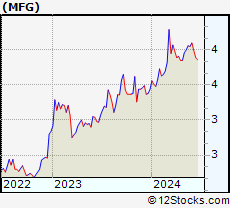 | MFG Mizuho Financial Group, Inc. |
| Sector: Financials | |
| SubSector: Foreign Regional Banks | |
| MarketCap: 27893.1 Millions | |
| Recent Price: 4.06 Smart Investing & Trading Score: 85 | |
| Day Percent Change: 2.78% Day Change: 0.11 | |
| Week Change: 1.5% Year-to-date Change: 18.0% | |
| MFG Links: Profile News Message Board | |
| Charts:- Daily , Weekly | |
| Add MFG to Watchlist: View: Get Complete MFG Trend Analysis ➞ | |
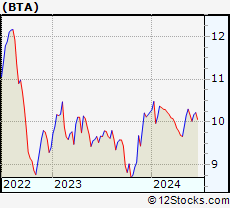 | BTA BlackRock Long-Term Municipal Advantage Trust |
| Sector: Financials | |
| SubSector: Closed-End Fund - Debt | |
| MarketCap: 133.907 Millions | |
| Recent Price: 10.30 Smart Investing & Trading Score: 95 | |
| Day Percent Change: 0.49% Day Change: 0.05 | |
| Week Change: 1.48% Year-to-date Change: 0.7% | |
| BTA Links: Profile News Message Board | |
| Charts:- Daily , Weekly | |
| Add BTA to Watchlist: View: Get Complete BTA Trend Analysis ➞ | |
| For tabular summary view of above stock list: Summary View ➞ 0 - 25 , 25 - 50 , 50 - 75 , 75 - 100 , 100 - 125 , 125 - 150 , 150 - 175 , 175 - 200 , 200 - 225 , 225 - 250 , 250 - 275 , 275 - 300 , 300 - 325 , 325 - 350 , 350 - 375 , 375 - 400 , 400 - 425 , 425 - 450 , 450 - 475 , 475 - 500 , 500 - 525 , 525 - 550 , 550 - 575 , 575 - 600 , 600 - 625 , 625 - 650 , 650 - 675 , 675 - 700 , 700 - 725 , 725 - 750 , 750 - 775 , 775 - 800 , 800 - 825 , 825 - 850 , 850 - 875 , 875 - 900 , 900 - 925 , 925 - 950 , 950 - 975 , 975 - 1000 , 1000 - 1025 , 1025 - 1050 , 1050 - 1075 , 1075 - 1100 , 1100 - 1125 , 1125 - 1150 , 1150 - 1175 , 1175 - 1200 , 1200 - 1225 | ||
| Click To Change The Sort Order: By Market Cap or Company Size Performance: Year-to-date, Week and Day | |
| Select Chart Type: | ||
|
Best Stocks Today 12Stocks.com |
© 2024 12Stocks.com Terms & Conditions Privacy Contact Us
All Information Provided Only For Education And Not To Be Used For Investing or Trading. See Terms & Conditions


One More Thing ... Get Best Stocks Delivered Daily!
Never Ever Miss A Move With Our Top Ten Stocks Lists
Find Best Stocks In Any Market - Bull or Bear Market
Take A Peek At Our Top Ten Stocks Lists: Daily, Weekly, Year-to-Date & Top Trends
Find Best Stocks In Any Market - Bull or Bear Market
Take A Peek At Our Top Ten Stocks Lists: Daily, Weekly, Year-to-Date & Top Trends
Financial Stocks With Best Up Trends [0-bearish to 100-bullish]: Fangdd Network[100], Xinyuan Real[100], MicroSectors Gold[100], Sprott Physical[100], Citizens & Northern[100], Sumitomo Mitsui[100], First Community[100], Chubb [100], Angel Oak[100], Sprott Physical[100], Iris Energy[100]
Best Financial Stocks Year-to-Date:
Root [526.36%], Fangdd Network[149.63%], Banco Macro[126.41%], Grupo Financiero[112.4%], Banco BBVA[110.66%], SelectQuote [110.22%], Gladstone Capital[106.92%], EverQuote [98.2%], Hippo [92.54%], Grupo Supervielle[86.95%], Vista Oil[60.93%] Best Financial Stocks This Week:
Fangdd Network[360.27%], Xinyuan Real[53.28%], Iris Energy[25.68%], Fathom [25.35%], Huize Holding[21.83%], First Foundation[18.98%], Trupanion [17.21%], Bridge [16.67%], MicroSectors Gold[15.19%], KE [13.86%], Douglas Elliman[13.56%] Best Financial Stocks Daily:
Fangdd Network[321.26%], Xinyuan Real[39.49%], MicroSectors Gold[12.02%], Fathom [9.88%], Citizens [8.53%], Hywin [8.28%], Root [6.10%], First Foundation[6.09%], Sprott Physical[6.09%], Freedom Holding[5.02%], NexGen Energy[4.99%]