
 Login Sign Up


| |||||
 |  | ||||

| 12Stocks.com Market Intelligence |
Best Financial Stocks
| In a hurry? Financial Stocks Lists: Performance Trends Table, Stock Charts
Sort Financial stocks: Daily, Weekly, Year-to-Date, Market Cap & Trends. Filter Financial stocks list by size:All Financial Large Mid-Range Small & MicroCap |
| 12Stocks.com Financial Stocks Performances & Trends Daily | |||||||||
|
|  The overall Smart Investing & Trading Score is 95 (0-bearish to 100-bullish) which puts Financial sector in short term bullish trend. The Smart Investing & Trading Score from previous trading session is 100 and a deterioration of trend continues.
| ||||||||
Here are the Smart Investing & Trading Scores of the most requested Financial stocks at 12Stocks.com (click stock name for detailed review):
|


| 12Stocks.com: Investing in Financial sector with Stocks | |
|
The following table helps investors and traders sort through current performance and trends (as measured by Smart Investing & Trading Score) of various
stocks in the Financial sector. Quick View: Move mouse or cursor over stock symbol (ticker) to view short-term Technical chart and over stock name to view long term chart. Click on  to add stock symbol to your watchlist and to add stock symbol to your watchlist and  to view watchlist. Click on any ticker or stock name for detailed market intelligence report for that stock. to view watchlist. Click on any ticker or stock name for detailed market intelligence report for that stock. |
12Stocks.com Performance of Stocks in Financial Sector
| Ticker | Stock Name | Watchlist | Category | Recent Price | Smart Investing & Trading Score | Change % | Weekly Change% |
| PTA | Cohen & Steers Tax-Advantaged Preferred Securities and ome Fund |   | Closed-End Fund - Debt | 19.35 | 83 | -0.31% | -0.51% |
| VCV | Invesco California | | Closed-End Fund - Debt | 9.75 | 43 | -0.31% | -0.51% |
| COF | Capital One | | Credit Services | 141.81 | 26 | 0.54% | -0.53% |
| UHT | Universal Health | | REIT | 37.32 | 57 | -0.85% | -0.53% |
| HIO | Western Asset | | Closed-End Fund - Debt | 3.75 | 10 | -0.53% | -0.53% |
| BSRR | Sierra Bancorp | | Regional Banks | 21.94 | 68 | -0.14% | -0.54% |
| WRB | W. R. | | Insurance | 79.31 | 50 | 0.92% | -0.54% |
| NWLI | National Western | | Life Insurance | 488.01 | 45 | -0.66% | -0.54% |
| RHP | Ryman Hospitality | | REIT | 105.37 | 25 | -1.35% | -0.54% |
| UTF | Cohen & Steers Infrastructure Fund | | Closed-End Fund - Equity | 23.57 | 63 | -0.04% | -0.55% |
| FITB | Fifth Third | | Regional Banks | 38.56 | 76 | -0.10% | -0.57% |
| BLW | BlackRock | | Closed-End Fund - Debt | 13.66 | 33 | -0.07% | -0.58% |
| FUNC | First United | | Regional Banks | 22.35 | 58 | 0.54% | -0.58% |
| NXJ | Nuveen New | | Asset Mgmt | 11.98 | 45 | -0.21% | -0.58% |
| HMST | HomeStreet | | S&L | 10.27 | 37 | 1.08% | -0.58% |
| ACT | Enact | | Insurance - Specialty | 31.51 | 78 | -0.06% | -0.60% |
| DMO | Western Asset | | Asset Mgmt | 11.64 | 63 | 0.34% | -0.60% |
| ISTR | Investar Holding | | Regional - Southwest Banks | 16.18 | 75 | 0.00% | -0.61% |
| HASI | Hannon Armstrong | | REIT - | 31.88 | 76 | 0.03% | -0.62% |
| FULT | Fulton | | Regional Banks | 17.36 | 76 | -0.63% | -0.63% |
| NHS | Neuberger Berman | | Asset Mgmt | 7.95 | 37 | 0.00% | -0.63% |
| PNFP | Pinnacle | | Regional Banks | 83.03 | 50 | -0.62% | -0.66% |
| HPI | John Hancock | | Closed-End Fund - Debt | 16.58 | 38 | -0.06% | -0.66% |
| NMZ | Nuveen Municipal | | Asset Mgmt | 10.58 | 83 | 0.00% | -0.66% |
| EBMT | Eagle Bancorp | | Regional Banks | 13.09 | 50 | 0.85% | -0.68% |
| For chart view version of above stock list: Chart View ➞ 0 - 25 , 25 - 50 , 50 - 75 , 75 - 100 , 100 - 125 , 125 - 150 , 150 - 175 , 175 - 200 , 200 - 225 , 225 - 250 , 250 - 275 , 275 - 300 , 300 - 325 , 325 - 350 , 350 - 375 , 375 - 400 , 400 - 425 , 425 - 450 , 450 - 475 , 475 - 500 , 500 - 525 , 525 - 550 , 550 - 575 , 575 - 600 , 600 - 625 , 625 - 650 , 650 - 675 , 675 - 700 , 700 - 725 , 725 - 750 , 750 - 775 , 775 - 800 , 800 - 825 , 825 - 850 , 850 - 875 , 875 - 900 , 900 - 925 , 925 - 950 , 950 - 975 , 975 - 1000 , 1000 - 1025 , 1025 - 1050 , 1050 - 1075 , 1075 - 1100 , 1100 - 1125 , 1125 - 1150 , 1150 - 1175 , 1175 - 1200 , 1200 - 1225 | ||
 | Click To Change The Sort Order: By Market Cap or Company Size Performance: Year-to-date, Week and Day |  |
|
Get the most comprehensive stock market coverage daily at 12Stocks.com ➞ Best Stocks Today ➞ Best Stocks Weekly ➞ Best Stocks Year-to-Date ➞ Best Stocks Trends ➞  Best Stocks Today 12Stocks.com Best Nasdaq Stocks ➞ Best S&P 500 Stocks ➞ Best Tech Stocks ➞ Best Biotech Stocks ➞ |
| Detailed Overview of Financial Stocks |
| Financial Technical Overview, Leaders & Laggards, Top Financial ETF Funds & Detailed Financial Stocks List, Charts, Trends & More |
| Financial Sector: Technical Analysis, Trends & YTD Performance | |
| Financial sector is composed of stocks
from banks, brokers, insurance, REITs
and services subsectors. Financial sector, as represented by XLF, an exchange-traded fund [ETF] that holds basket of Financial stocks (e.g, Bank of America, Goldman Sachs) is up by 13.01% and is currently outperforming the overall market by 2.44% year-to-date. Below is a quick view of Technical charts and trends: |
|
 XLF Weekly Chart |
|
| Long Term Trend: Very Good | |
| Medium Term Trend: Very Good | |
 XLF Daily Chart |
|
| Short Term Trend: Very Good | |
| Overall Trend Score: 95 | |
| YTD Performance: 13.01% | |
| **Trend Scores & Views Are Only For Educational Purposes And Not For Investing | |
| 12Stocks.com: Top Performing Financial Sector Stocks | ||||||||||||||||||||||||||||||||||||||||||||||||
 The top performing Financial sector stocks year to date are
Now, more recently, over last week, the top performing Financial sector stocks on the move are


|
||||||||||||||||||||||||||||||||||||||||||||||||
| 12Stocks.com: Investing in Financial Sector using Exchange Traded Funds | |
|
The following table shows list of key exchange traded funds (ETF) that
help investors track Financial Index. For detailed view, check out our ETF Funds section of our website. Quick View: Move mouse or cursor over ETF symbol (ticker) to view short-term Technical chart and over ETF name to view long term chart. Click on ticker or stock name for detailed view. Click on to add stock symbol to your watchlist and to view watchlist. |
12Stocks.com List of ETFs that track Financial Index
| Ticker | ETF Name | Watchlist | Recent Price | Smart Investing & Trading Score | Change % | Week % | Year-to-date % |
| XLF | Financial | | 42.49 | 95 | 0.73 | 1.58 | 13.01% |
| IAI | Broker-Dealers & Secs | | 119.47 | 100 | 1.08 | 2.59 | 10.08% |
| IYF | Financials | | 96.85 | 95 | 0.43 | 1.73 | 13.39% |
| IYG | Financial Services | | 67.11 | 95 | 0.15 | 1.56 | 12.34% |
| KRE | Regional Banking | | 51.19 | 83 | 0.23 | 1.67 | -2.37% |
| IXG | Global Financials | | 88.72 | 88 | 0.21 | 1.41 | 12.91% |
| VFH | Financials | | 103.00 | 95 | 0.18 | 1.45 | 11.64% |
| KBE | Bank | | 47.93 | 83 | 0.44 | 1.25 | 4.15% |
| FAS | Financial Bull 3X | | 112.32 | 95 | 1.81 | 4.06 | 35.9% |
| FAZ | Financial Bear 3X | | 9.75 | 10 | -1.71 | -3.75 | -28.68% |
| UYG | Financials | | 68.54 | 100 | 1.23 | 2.77 | 24.17% |
| IAT | Regional Banks | | 43.42 | 76 | -0.26 | 1.02 | 3.78% |
| KIE | Insurance | | 51.83 | 100 | 0.88 | 1.09 | 14.62% |
| PSCF | SmallCap Financials | | 49.03 | 95 | 0.28 | 1.44 | -0.31% |
| EUFN | Europe Financials | | 24.13 | 95 | 0.67 | 2.51 | 15.12% |
| PGF | Financial Preferred | | 14.81 | 52 | -0.10 | 0.68 | 1.58% |
| 12Stocks.com: Charts, Trends, Fundamental Data and Performances of Financial Stocks | |
|
We now take in-depth look at all Financial stocks including charts, multi-period performances and overall trends (as measured by Smart Investing & Trading Score). One can sort Financial stocks (click link to choose) by Daily, Weekly and by Year-to-Date performances. Also, one can sort by size of the company or by market capitalization. |
| Select Your Default Chart Type: | |||||
| |||||
| Click on stock symbol or name for detailed view. Click on to add stock symbol to your watchlist and to view watchlist. Quick View: Move mouse or cursor over "Daily" to quickly view daily Technical stock chart and over "Weekly" to view weekly Technical stock chart. | |||||

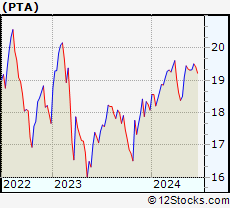 | PTA Cohen & Steers Tax-Advantaged Preferred Securities and Income Fund |
| Sector: Financials | |
| SubSector: Closed-End Fund - Debt | |
| MarketCap: 963 Millions | |
| Recent Price: 19.35 Smart Investing & Trading Score: 83 | |
| Day Percent Change: -0.31% Day Change: -0.06 | |
| Week Change: -0.51% Year-to-date Change: 7.0% | |
| PTA Links: Profile News Message Board | |
| Charts:- Daily , Weekly | |
| Add PTA to Watchlist: View: Get Complete PTA Trend Analysis ➞ | |
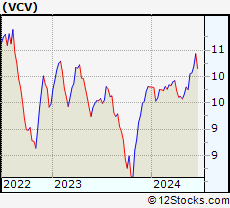 | VCV Invesco California Value Municipal Income Trust |
| Sector: Financials | |
| SubSector: Closed-End Fund - Debt | |
| MarketCap: 495.407 Millions | |
| Recent Price: 9.75 Smart Investing & Trading Score: 43 | |
| Day Percent Change: -0.31% Day Change: -0.03 | |
| Week Change: -0.51% Year-to-date Change: -0.5% | |
| VCV Links: Profile News Message Board | |
| Charts:- Daily , Weekly | |
| Add VCV to Watchlist: View: Get Complete VCV Trend Analysis ➞ | |
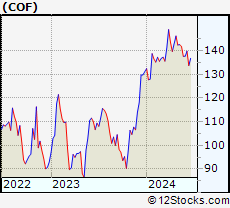 | COF Capital One Financial Corporation |
| Sector: Financials | |
| SubSector: Credit Services | |
| MarketCap: 23094.2 Millions | |
| Recent Price: 141.81 Smart Investing & Trading Score: 26 | |
| Day Percent Change: 0.54% Day Change: 0.76 | |
| Week Change: -0.53% Year-to-date Change: 8.2% | |
| COF Links: Profile News Message Board | |
| Charts:- Daily , Weekly | |
| Add COF to Watchlist: View: Get Complete COF Trend Analysis ➞ | |
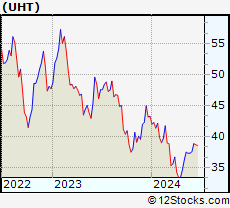 | UHT Universal Health Realty Income Trust |
| Sector: Financials | |
| SubSector: REIT - Healthcare Facilities | |
| MarketCap: 1121.14 Millions | |
| Recent Price: 37.32 Smart Investing & Trading Score: 57 | |
| Day Percent Change: -0.85% Day Change: -0.32 | |
| Week Change: -0.53% Year-to-date Change: -13.7% | |
| UHT Links: Profile News Message Board | |
| Charts:- Daily , Weekly | |
| Add UHT to Watchlist: View: Get Complete UHT Trend Analysis ➞ | |
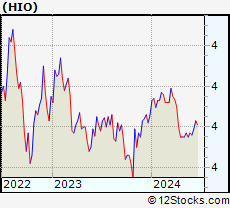 | HIO Western Asset High Income Opportunity Fund Inc. |
| Sector: Financials | |
| SubSector: Closed-End Fund - Debt | |
| MarketCap: 445.207 Millions | |
| Recent Price: 3.75 Smart Investing & Trading Score: 10 | |
| Day Percent Change: -0.53% Day Change: -0.02 | |
| Week Change: -0.53% Year-to-date Change: -2.9% | |
| HIO Links: Profile News Message Board | |
| Charts:- Daily , Weekly | |
| Add HIO to Watchlist: View: Get Complete HIO Trend Analysis ➞ | |
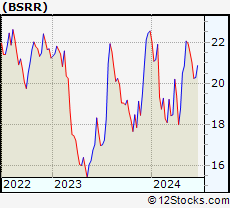 | BSRR Sierra Bancorp |
| Sector: Financials | |
| SubSector: Regional - Pacific Banks | |
| MarketCap: 256.929 Millions | |
| Recent Price: 21.94 Smart Investing & Trading Score: 68 | |
| Day Percent Change: -0.14% Day Change: -0.03 | |
| Week Change: -0.54% Year-to-date Change: -2.7% | |
| BSRR Links: Profile News Message Board | |
| Charts:- Daily , Weekly | |
| Add BSRR to Watchlist: View: Get Complete BSRR Trend Analysis ➞ | |
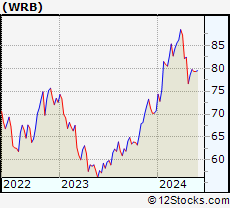 | WRB W. R. Berkley Corporation |
| Sector: Financials | |
| SubSector: Property & Casualty Insurance | |
| MarketCap: 9863.82 Millions | |
| Recent Price: 79.31 Smart Investing & Trading Score: 50 | |
| Day Percent Change: 0.92% Day Change: 0.72 | |
| Week Change: -0.54% Year-to-date Change: 12.2% | |
| WRB Links: Profile News Message Board | |
| Charts:- Daily , Weekly | |
| Add WRB to Watchlist: View: Get Complete WRB Trend Analysis ➞ | |
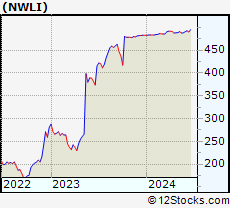 | NWLI National Western Life Group, Inc. |
| Sector: Financials | |
| SubSector: Life Insurance | |
| MarketCap: 529 Millions | |
| Recent Price: 488.01 Smart Investing & Trading Score: 45 | |
| Day Percent Change: -0.66% Day Change: -3.22 | |
| Week Change: -0.54% Year-to-date Change: 1.0% | |
| NWLI Links: Profile News Message Board | |
| Charts:- Daily , Weekly | |
| Add NWLI to Watchlist: View: Get Complete NWLI Trend Analysis ➞ | |
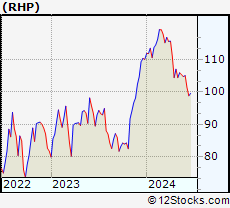 | RHP Ryman Hospitality Properties, Inc. |
| Sector: Financials | |
| SubSector: REIT - Hotel/Motel | |
| MarketCap: 1519.74 Millions | |
| Recent Price: 105.37 Smart Investing & Trading Score: 25 | |
| Day Percent Change: -1.35% Day Change: -1.44 | |
| Week Change: -0.54% Year-to-date Change: -4.3% | |
| RHP Links: Profile News Message Board | |
| Charts:- Daily , Weekly | |
| Add RHP to Watchlist: View: Get Complete RHP Trend Analysis ➞ | |
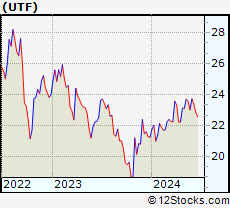 | UTF Cohen & Steers Infrastructure Fund, Inc |
| Sector: Financials | |
| SubSector: Closed-End Fund - Equity | |
| MarketCap: 1195.37 Millions | |
| Recent Price: 23.57 Smart Investing & Trading Score: 63 | |
| Day Percent Change: -0.04% Day Change: -0.01 | |
| Week Change: -0.55% Year-to-date Change: 11.0% | |
| UTF Links: Profile News Message Board | |
| Charts:- Daily , Weekly | |
| Add UTF to Watchlist: View: Get Complete UTF Trend Analysis ➞ | |
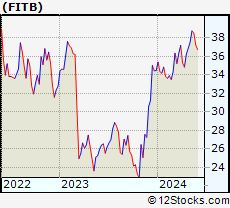 | FITB Fifth Third Bancorp |
| Sector: Financials | |
| SubSector: Regional - Midwest Banks | |
| MarketCap: 10197 Millions | |
| Recent Price: 38.56 Smart Investing & Trading Score: 76 | |
| Day Percent Change: -0.10% Day Change: -0.04 | |
| Week Change: -0.57% Year-to-date Change: 11.8% | |
| FITB Links: Profile News Message Board | |
| Charts:- Daily , Weekly | |
| Add FITB to Watchlist: View: Get Complete FITB Trend Analysis ➞ | |
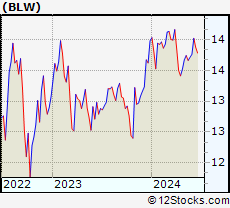 | BLW BlackRock Limited Duration Income Trust |
| Sector: Financials | |
| SubSector: Closed-End Fund - Debt | |
| MarketCap: 382.307 Millions | |
| Recent Price: 13.66 Smart Investing & Trading Score: 33 | |
| Day Percent Change: -0.07% Day Change: -0.01 | |
| Week Change: -0.58% Year-to-date Change: -2.3% | |
| BLW Links: Profile News Message Board | |
| Charts:- Daily , Weekly | |
| Add BLW to Watchlist: View: Get Complete BLW Trend Analysis ➞ | |
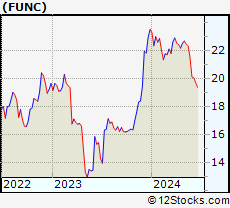 | FUNC First United Corporation |
| Sector: Financials | |
| SubSector: Regional - Mid-Atlantic Banks | |
| MarketCap: 106.859 Millions | |
| Recent Price: 22.35 Smart Investing & Trading Score: 58 | |
| Day Percent Change: 0.54% Day Change: 0.12 | |
| Week Change: -0.58% Year-to-date Change: -4.9% | |
| FUNC Links: Profile News Message Board | |
| Charts:- Daily , Weekly | |
| Add FUNC to Watchlist: View: Get Complete FUNC Trend Analysis ➞ | |
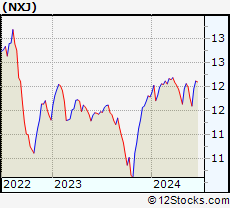 | NXJ Nuveen New Jersey Quality Municipal Income Fund |
| Sector: Financials | |
| SubSector: Asset Management | |
| MarketCap: 501.803 Millions | |
| Recent Price: 11.98 Smart Investing & Trading Score: 45 | |
| Day Percent Change: -0.21% Day Change: -0.03 | |
| Week Change: -0.58% Year-to-date Change: 1.7% | |
| NXJ Links: Profile News Message Board | |
| Charts:- Daily , Weekly | |
| Add NXJ to Watchlist: View: Get Complete NXJ Trend Analysis ➞ | |
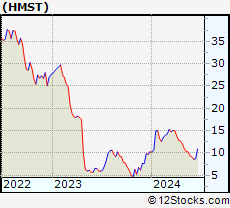 | HMST HomeStreet, Inc. |
| Sector: Financials | |
| SubSector: Savings & Loans | |
| MarketCap: 535.33 Millions | |
| Recent Price: 10.27 Smart Investing & Trading Score: 37 | |
| Day Percent Change: 1.08% Day Change: 0.11 | |
| Week Change: -0.58% Year-to-date Change: -0.3% | |
| HMST Links: Profile News Message Board | |
| Charts:- Daily , Weekly | |
| Add HMST to Watchlist: View: Get Complete HMST Trend Analysis ➞ | |
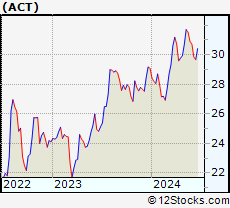 | ACT Enact Holdings, Inc. |
| Sector: Financials | |
| SubSector: Insurance - Specialty | |
| MarketCap: 4010 Millions | |
| Recent Price: 31.51 Smart Investing & Trading Score: 78 | |
| Day Percent Change: -0.06% Day Change: -0.02 | |
| Week Change: -0.6% Year-to-date Change: 8.4% | |
| ACT Links: Profile News Message Board | |
| Charts:- Daily , Weekly | |
| Add ACT to Watchlist: View: Get Complete ACT Trend Analysis ➞ | |
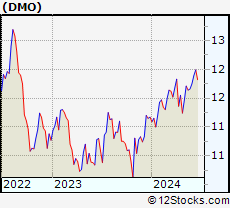 | DMO Western Asset Mortgage Opportunity Fund Inc. |
| Sector: Financials | |
| SubSector: Asset Management | |
| MarketCap: 156.503 Millions | |
| Recent Price: 11.64 Smart Investing & Trading Score: 63 | |
| Day Percent Change: 0.34% Day Change: 0.04 | |
| Week Change: -0.6% Year-to-date Change: 4.2% | |
| DMO Links: Profile News Message Board | |
| Charts:- Daily , Weekly | |
| Add DMO to Watchlist: View: Get Complete DMO Trend Analysis ➞ | |
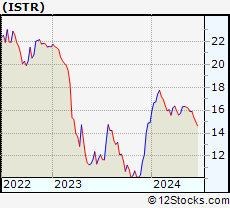 | ISTR Investar Holding Corporation |
| Sector: Financials | |
| SubSector: Regional - Southwest Banks | |
| MarketCap: 136.565 Millions | |
| Recent Price: 16.18 Smart Investing & Trading Score: 75 | |
| Day Percent Change: 0.00% Day Change: 0.00 | |
| Week Change: -0.61% Year-to-date Change: 8.5% | |
| ISTR Links: Profile News Message Board | |
| Charts:- Daily , Weekly | |
| Add ISTR to Watchlist: View: Get Complete ISTR Trend Analysis ➞ | |
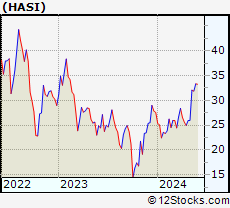 | HASI Hannon Armstrong Sustainable Infrastructure Capital, Inc. |
| Sector: Financials | |
| SubSector: REIT - Diversified | |
| MarketCap: 1405.93 Millions | |
| Recent Price: 31.88 Smart Investing & Trading Score: 76 | |
| Day Percent Change: 0.03% Day Change: 0.01 | |
| Week Change: -0.62% Year-to-date Change: 15.6% | |
| HASI Links: Profile News Message Board | |
| Charts:- Daily , Weekly | |
| Add HASI to Watchlist: View: Get Complete HASI Trend Analysis ➞ | |
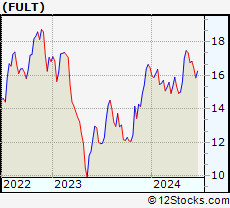 | FULT Fulton Financial Corporation |
| Sector: Financials | |
| SubSector: Regional - Northeast Banks | |
| MarketCap: 2030.89 Millions | |
| Recent Price: 17.36 Smart Investing & Trading Score: 76 | |
| Day Percent Change: -0.63% Day Change: -0.11 | |
| Week Change: -0.63% Year-to-date Change: 5.5% | |
| FULT Links: Profile News Message Board | |
| Charts:- Daily , Weekly | |
| Add FULT to Watchlist: View: Get Complete FULT Trend Analysis ➞ | |
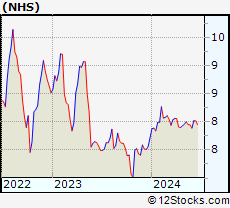 | NHS Neuberger Berman High Yield Strategies Fund Inc. |
| Sector: Financials | |
| SubSector: Asset Management | |
| MarketCap: 147.303 Millions | |
| Recent Price: 7.95 Smart Investing & Trading Score: 37 | |
| Day Percent Change: 0.00% Day Change: 0.00 | |
| Week Change: -0.63% Year-to-date Change: 3.0% | |
| NHS Links: Profile News Message Board | |
| Charts:- Daily , Weekly | |
| Add NHS to Watchlist: View: Get Complete NHS Trend Analysis ➞ | |
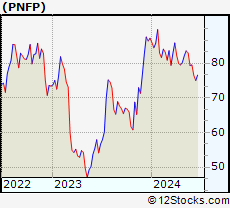 | PNFP Pinnacle Financial Partners, Inc. |
| Sector: Financials | |
| SubSector: Regional - Southeast Banks | |
| MarketCap: 2771.75 Millions | |
| Recent Price: 83.03 Smart Investing & Trading Score: 50 | |
| Day Percent Change: -0.62% Day Change: -0.52 | |
| Week Change: -0.66% Year-to-date Change: -4.8% | |
| PNFP Links: Profile News Message Board | |
| Charts:- Daily , Weekly | |
| Add PNFP to Watchlist: View: Get Complete PNFP Trend Analysis ➞ | |
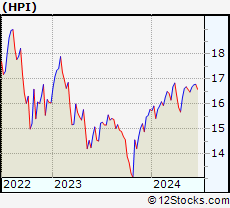 | HPI John Hancock Preferred Income Fund |
| Sector: Financials | |
| SubSector: Closed-End Fund - Debt | |
| MarketCap: 347.007 Millions | |
| Recent Price: 16.58 Smart Investing & Trading Score: 38 | |
| Day Percent Change: -0.06% Day Change: -0.01 | |
| Week Change: -0.66% Year-to-date Change: 5.1% | |
| HPI Links: Profile News Message Board | |
| Charts:- Daily , Weekly | |
| Add HPI to Watchlist: View: Get Complete HPI Trend Analysis ➞ | |
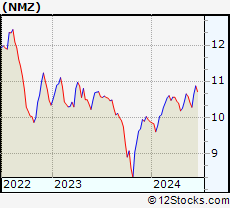 | NMZ Nuveen Municipal High Income Opportunity Fund |
| Sector: Financials | |
| SubSector: Asset Management | |
| MarketCap: 845.303 Millions | |
| Recent Price: 10.58 Smart Investing & Trading Score: 83 | |
| Day Percent Change: 0.00% Day Change: 0.00 | |
| Week Change: -0.66% Year-to-date Change: 7.1% | |
| NMZ Links: Profile News Message Board | |
| Charts:- Daily , Weekly | |
| Add NMZ to Watchlist: View: Get Complete NMZ Trend Analysis ➞ | |
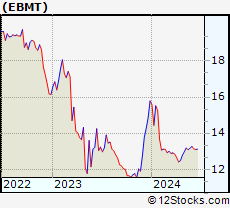 | EBMT Eagle Bancorp Montana, Inc. |
| Sector: Financials | |
| SubSector: Regional - Pacific Banks | |
| MarketCap: 106.929 Millions | |
| Recent Price: 13.09 Smart Investing & Trading Score: 50 | |
| Day Percent Change: 0.85% Day Change: 0.11 | |
| Week Change: -0.68% Year-to-date Change: -17.1% | |
| EBMT Links: Profile News Message Board | |
| Charts:- Daily , Weekly | |
| Add EBMT to Watchlist: View: Get Complete EBMT Trend Analysis ➞ | |
| For tabular summary view of above stock list: Summary View ➞ 0 - 25 , 25 - 50 , 50 - 75 , 75 - 100 , 100 - 125 , 125 - 150 , 150 - 175 , 175 - 200 , 200 - 225 , 225 - 250 , 250 - 275 , 275 - 300 , 300 - 325 , 325 - 350 , 350 - 375 , 375 - 400 , 400 - 425 , 425 - 450 , 450 - 475 , 475 - 500 , 500 - 525 , 525 - 550 , 550 - 575 , 575 - 600 , 600 - 625 , 625 - 650 , 650 - 675 , 675 - 700 , 700 - 725 , 725 - 750 , 750 - 775 , 775 - 800 , 800 - 825 , 825 - 850 , 850 - 875 , 875 - 900 , 900 - 925 , 925 - 950 , 950 - 975 , 975 - 1000 , 1000 - 1025 , 1025 - 1050 , 1050 - 1075 , 1075 - 1100 , 1100 - 1125 , 1125 - 1150 , 1150 - 1175 , 1175 - 1200 , 1200 - 1225 | ||
| Click To Change The Sort Order: By Market Cap or Company Size Performance: Year-to-date, Week and Day | |
| Select Chart Type: | ||
|
Best Stocks Today 12Stocks.com |
© 2024 12Stocks.com Terms & Conditions Privacy Contact Us
All Information Provided Only For Education And Not To Be Used For Investing or Trading. See Terms & Conditions


One More Thing ... Get Best Stocks Delivered Daily!
Never Ever Miss A Move With Our Top Ten Stocks Lists
Find Best Stocks In Any Market - Bull or Bear Market
Take A Peek At Our Top Ten Stocks Lists: Daily, Weekly, Year-to-Date & Top Trends
Find Best Stocks In Any Market - Bull or Bear Market
Take A Peek At Our Top Ten Stocks Lists: Daily, Weekly, Year-to-Date & Top Trends
Financial Stocks With Best Up Trends [0-bearish to 100-bullish]: Fangdd Network[100], Xinyuan Real[100], MicroSectors Gold[100], Sprott Physical[100], Citizens & Northern[100], Sumitomo Mitsui[100], First Community[100], Chubb [100], Angel Oak[100], Sprott Physical[100], Iris Energy[100]
Best Financial Stocks Year-to-Date:
Root [526.36%], Fangdd Network[149.63%], Banco Macro[126.41%], Grupo Financiero[112.4%], Banco BBVA[110.66%], SelectQuote [110.22%], Gladstone Capital[106.92%], EverQuote [98.2%], Hippo [92.54%], Grupo Supervielle[86.95%], Vista Oil[60.93%] Best Financial Stocks This Week:
Fangdd Network[360.27%], Xinyuan Real[53.28%], Iris Energy[25.68%], Fathom [25.35%], Huize Holding[21.83%], First Foundation[18.98%], Trupanion [17.21%], Bridge [16.67%], MicroSectors Gold[15.19%], KE [13.86%], Douglas Elliman[13.56%] Best Financial Stocks Daily:
Fangdd Network[321.26%], Xinyuan Real[39.49%], MicroSectors Gold[12.02%], Fathom [9.88%], Citizens [8.53%], Hywin [8.28%], Root [6.10%], First Foundation[6.09%], Sprott Physical[6.09%], Freedom Holding[5.02%], NexGen Energy[4.99%]