
 Login Sign Up


| |||||
 |  | ||||

| 12Stocks.com Market Intelligence |
Best Financial Stocks
| In a hurry? Financial Stocks Lists: Performance Trends Table, Stock Charts
Sort Financial stocks: Daily, Weekly, Year-to-Date, Market Cap & Trends. Filter Financial stocks list by size:All Financial Large Mid-Range Small & MicroCap |
| 12Stocks.com Financial Stocks Performances & Trends Daily | |||||||||
|
|  The overall Smart Investing & Trading Score is 95 (0-bearish to 100-bullish) which puts Financial sector in short term bullish trend. The Smart Investing & Trading Score from previous trading session is 100 and a deterioration of trend continues.
| ||||||||
Here are the Smart Investing & Trading Scores of the most requested Financial stocks at 12Stocks.com (click stock name for detailed review):
|


| 12Stocks.com: Investing in Financial sector with Stocks | |
|
The following table helps investors and traders sort through current performance and trends (as measured by Smart Investing & Trading Score) of various
stocks in the Financial sector. Quick View: Move mouse or cursor over stock symbol (ticker) to view short-term Technical chart and over stock name to view long term chart. Click on  to add stock symbol to your watchlist and to add stock symbol to your watchlist and  to view watchlist. Click on any ticker or stock name for detailed market intelligence report for that stock. to view watchlist. Click on any ticker or stock name for detailed market intelligence report for that stock. |
12Stocks.com Performance of Stocks in Financial Sector
| Ticker | Stock Name | Watchlist | Category | Recent Price | Smart Investing & Trading Score | Change % | Weekly Change% |
| AWAY | ETFMG Travel |   | Exchange Traded Fund | 20.62 | 95 | 1.23% | 3.41% |
| PB | Prosperity Bancshares | | Regional - Southwest Banks | 65.13 | 100 | 2.00% | 3.41% |
| HTLF | Heartland | | Regional - Southwest Banks | 45.44 | 90 | 1.93% | 3.39% |
| CBLS | Changebridge Capital | | Exchange Traded Fund | 25.49 | 90 | 0.64% | 3.37% |
| QFIN | 360 Finance | | Credit Services | 21.30 | 90 | -0.79% | 3.35% |
| NMR | Nomura | | Brokerage | 5.91 | 83 | 0.17% | 3.32% |
| COIN | Coinbase Global | | Financial Data & Stock Exchanges | 207.60 | 51 | 4.23% | 3.32% |
| TRTX | TPG RE | | Mortgage | 8.87 | 90 | 0.23% | 3.32% |
| ICE | Intercontinental Exchange | | Investments | 138.40 | 75 | 0.94% | 3.29% |
| BRKL | Brookline Bancorp | | S&L | 9.10 | 74 | 0.44% | 3.29% |
| RKT | Rocket | | Mortgage Finance | 14.12 | 63 | 1.73% | 3.29% |
| BFS | Saul Centers | | REIT - Retail | 38.10 | 100 | 0.50% | 3.28% |
| SITC | SITE Centers | | REIT - Retail | 14.34 | 100 | 0.49% | 3.28% |
| FPF | First Trust | | Closed-End Fund - Debt | 17.92 | 93 | 0.34% | 3.26% |
| HR | Healthcare Realty | | REIT | 15.87 | 68 | -1.18% | 3.25% |
| FPH | Five Point | | REIT - | 3.18 | 39 | 0.32% | 3.25% |
| LNC | Loln National | | Life Insurance | 30.26 | 95 | 0.67% | 3.24% |
| TOWN | TowneBank | | Regional Banks | 28.34 | 100 | 1.40% | 3.24% |
| LRNZ | TrueShares Technology | | Exchange Traded Fund | 38.28 | 52 | -0.21% | 3.23% |
| IIF | Morgan Stanley | | Closed-End Fund - Foreign | 24.21 | 100 | 1.21% | 3.20% |
| SLF | Sun Life | | Insurance | 51.70 | 50 | 0.39% | 3.19% |
| BRO | Brown & Brown | | Insurance | 89.83 | 95 | 0.48% | 3.17% |
| HAFC | Hanmi | | Regional Banks | 16.65 | 95 | 0.24% | 3.16% |
| VBTX | Veritex | | Regional - Southwest Banks | 21.22 | 100 | 1.73% | 3.11% |
| JXN | Jackson | | Insurance - Life | 77.97 | 93 | 3.00% | 3.11% |
| For chart view version of above stock list: Chart View ➞ 0 - 25 , 25 - 50 , 50 - 75 , 75 - 100 , 100 - 125 , 125 - 150 , 150 - 175 , 175 - 200 , 200 - 225 , 225 - 250 , 250 - 275 , 275 - 300 , 300 - 325 , 325 - 350 , 350 - 375 , 375 - 400 , 400 - 425 , 425 - 450 , 450 - 475 , 475 - 500 , 500 - 525 , 525 - 550 , 550 - 575 , 575 - 600 , 600 - 625 , 625 - 650 , 650 - 675 , 675 - 700 , 700 - 725 , 725 - 750 , 750 - 775 , 775 - 800 , 800 - 825 , 825 - 850 , 850 - 875 , 875 - 900 , 900 - 925 , 925 - 950 , 950 - 975 , 975 - 1000 , 1000 - 1025 , 1025 - 1050 , 1050 - 1075 , 1075 - 1100 , 1100 - 1125 , 1125 - 1150 , 1150 - 1175 , 1175 - 1200 , 1200 - 1225 | ||
 | Click To Change The Sort Order: By Market Cap or Company Size Performance: Year-to-date, Week and Day |  |
|
Get the most comprehensive stock market coverage daily at 12Stocks.com ➞ Best Stocks Today ➞ Best Stocks Weekly ➞ Best Stocks Year-to-Date ➞ Best Stocks Trends ➞  Best Stocks Today 12Stocks.com Best Nasdaq Stocks ➞ Best S&P 500 Stocks ➞ Best Tech Stocks ➞ Best Biotech Stocks ➞ |
| Detailed Overview of Financial Stocks |
| Financial Technical Overview, Leaders & Laggards, Top Financial ETF Funds & Detailed Financial Stocks List, Charts, Trends & More |
| Financial Sector: Technical Analysis, Trends & YTD Performance | |
| Financial sector is composed of stocks
from banks, brokers, insurance, REITs
and services subsectors. Financial sector, as represented by XLF, an exchange-traded fund [ETF] that holds basket of Financial stocks (e.g, Bank of America, Goldman Sachs) is up by 13.01% and is currently outperforming the overall market by 2.44% year-to-date. Below is a quick view of Technical charts and trends: |
|
 XLF Weekly Chart |
|
| Long Term Trend: Very Good | |
| Medium Term Trend: Very Good | |
 XLF Daily Chart |
|
| Short Term Trend: Very Good | |
| Overall Trend Score: 95 | |
| YTD Performance: 13.01% | |
| **Trend Scores & Views Are Only For Educational Purposes And Not For Investing | |
| 12Stocks.com: Top Performing Financial Sector Stocks | ||||||||||||||||||||||||||||||||||||||||||||||||
 The top performing Financial sector stocks year to date are
Now, more recently, over last week, the top performing Financial sector stocks on the move are


|
||||||||||||||||||||||||||||||||||||||||||||||||
| 12Stocks.com: Investing in Financial Sector using Exchange Traded Funds | |
|
The following table shows list of key exchange traded funds (ETF) that
help investors track Financial Index. For detailed view, check out our ETF Funds section of our website. Quick View: Move mouse or cursor over ETF symbol (ticker) to view short-term Technical chart and over ETF name to view long term chart. Click on ticker or stock name for detailed view. Click on to add stock symbol to your watchlist and to view watchlist. |
12Stocks.com List of ETFs that track Financial Index
| Ticker | ETF Name | Watchlist | Recent Price | Smart Investing & Trading Score | Change % | Week % | Year-to-date % |
| XLF | Financial | | 42.49 | 95 | 0.73 | 1.58 | 13.01% |
| IAI | Broker-Dealers & Secs | | 119.47 | 100 | 1.08 | 2.59 | 10.08% |
| IYF | Financials | | 96.85 | 95 | 0.43 | 1.73 | 13.39% |
| IYG | Financial Services | | 67.11 | 95 | 0.15 | 1.56 | 12.34% |
| KRE | Regional Banking | | 51.19 | 83 | 0.23 | 1.67 | -2.37% |
| IXG | Global Financials | | 88.72 | 88 | 0.21 | 1.41 | 12.91% |
| VFH | Financials | | 103.00 | 95 | 0.18 | 1.45 | 11.64% |
| KBE | Bank | | 47.93 | 83 | 0.44 | 1.25 | 4.15% |
| FAS | Financial Bull 3X | | 112.32 | 95 | 1.81 | 4.06 | 35.9% |
| FAZ | Financial Bear 3X | | 9.75 | 10 | -1.71 | -3.75 | -28.68% |
| UYG | Financials | | 68.54 | 100 | 1.23 | 2.77 | 24.17% |
| IAT | Regional Banks | | 43.42 | 76 | -0.26 | 1.02 | 3.78% |
| KIE | Insurance | | 51.83 | 100 | 0.88 | 1.09 | 14.62% |
| PSCF | SmallCap Financials | | 49.03 | 95 | 0.28 | 1.44 | -0.31% |
| EUFN | Europe Financials | | 24.13 | 95 | 0.67 | 2.51 | 15.12% |
| PGF | Financial Preferred | | 14.81 | 52 | -0.10 | 0.68 | 1.58% |
| 12Stocks.com: Charts, Trends, Fundamental Data and Performances of Financial Stocks | |
|
We now take in-depth look at all Financial stocks including charts, multi-period performances and overall trends (as measured by Smart Investing & Trading Score). One can sort Financial stocks (click link to choose) by Daily, Weekly and by Year-to-Date performances. Also, one can sort by size of the company or by market capitalization. |
| Select Your Default Chart Type: | |||||
| |||||
| Click on stock symbol or name for detailed view. Click on to add stock symbol to your watchlist and to view watchlist. Quick View: Move mouse or cursor over "Daily" to quickly view daily Technical stock chart and over "Weekly" to view weekly Technical stock chart. | |||||

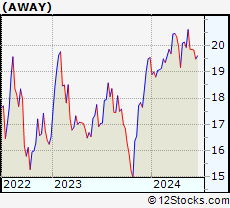 | AWAY ETFMG Travel Tech ETF |
| Sector: Financials | |
| SubSector: Exchange Traded Fund | |
| MarketCap: 60157 Millions | |
| Recent Price: 20.62 Smart Investing & Trading Score: 95 | |
| Day Percent Change: 1.23% Day Change: 0.25 | |
| Week Change: 3.41% Year-to-date Change: 5.5% | |
| AWAY Links: Profile News Message Board | |
| Charts:- Daily , Weekly | |
| Add AWAY to Watchlist: View: Get Complete AWAY Trend Analysis ➞ | |
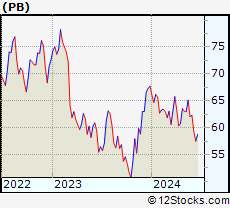 | PB Prosperity Bancshares, Inc. |
| Sector: Financials | |
| SubSector: Regional - Southwest Banks | |
| MarketCap: 4682.25 Millions | |
| Recent Price: 65.13 Smart Investing & Trading Score: 100 | |
| Day Percent Change: 2.00% Day Change: 1.28 | |
| Week Change: 3.41% Year-to-date Change: -3.8% | |
| PB Links: Profile News Message Board | |
| Charts:- Daily , Weekly | |
| Add PB to Watchlist: View: Get Complete PB Trend Analysis ➞ | |
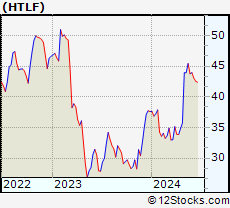 | HTLF Heartland Financial USA, Inc. |
| Sector: Financials | |
| SubSector: Regional - Southwest Banks | |
| MarketCap: 1143.85 Millions | |
| Recent Price: 45.44 Smart Investing & Trading Score: 90 | |
| Day Percent Change: 1.93% Day Change: 0.86 | |
| Week Change: 3.39% Year-to-date Change: 20.8% | |
| HTLF Links: Profile News Message Board | |
| Charts:- Daily , Weekly | |
| Add HTLF to Watchlist: View: Get Complete HTLF Trend Analysis ➞ | |
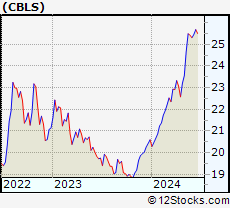 | CBLS Changebridge Capital Long/Short Equity ETF |
| Sector: Financials | |
| SubSector: Exchange Traded Fund | |
| MarketCap: 60157 Millions | |
| Recent Price: 25.49 Smart Investing & Trading Score: 90 | |
| Day Percent Change: 0.64% Day Change: 0.16 | |
| Week Change: 3.37% Year-to-date Change: 23.8% | |
| CBLS Links: Profile News Message Board | |
| Charts:- Daily , Weekly | |
| Add CBLS to Watchlist: View: Get Complete CBLS Trend Analysis ➞ | |
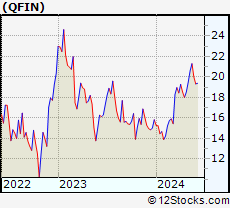 | QFIN 360 Finance, Inc. |
| Sector: Financials | |
| SubSector: Credit Services | |
| MarketCap: 956.208 Millions | |
| Recent Price: 21.30 Smart Investing & Trading Score: 90 | |
| Day Percent Change: -0.79% Day Change: -0.17 | |
| Week Change: 3.35% Year-to-date Change: 34.6% | |
| QFIN Links: Profile News Message Board | |
| Charts:- Daily , Weekly | |
| Add QFIN to Watchlist: View: Get Complete QFIN Trend Analysis ➞ | |
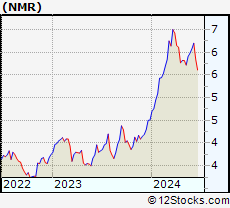 | NMR Nomura Holdings, Inc. |
| Sector: Financials | |
| SubSector: Investment Brokerage - National | |
| MarketCap: 15277 Millions | |
| Recent Price: 5.91 Smart Investing & Trading Score: 83 | |
| Day Percent Change: 0.17% Day Change: 0.01 | |
| Week Change: 3.32% Year-to-date Change: 31.0% | |
| NMR Links: Profile News Message Board | |
| Charts:- Daily , Weekly | |
| Add NMR to Watchlist: View: Get Complete NMR Trend Analysis ➞ | |
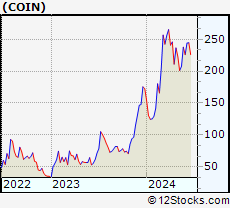 | COIN Coinbase Global, Inc. |
| Sector: Financials | |
| SubSector: Financial Data & Stock Exchanges | |
| MarketCap: 16390 Millions | |
| Recent Price: 207.60 Smart Investing & Trading Score: 51 | |
| Day Percent Change: 4.23% Day Change: 8.43 | |
| Week Change: 3.32% Year-to-date Change: 20.2% | |
| COIN Links: Profile News Message Board | |
| Charts:- Daily , Weekly | |
| Add COIN to Watchlist: View: Get Complete COIN Trend Analysis ➞ | |
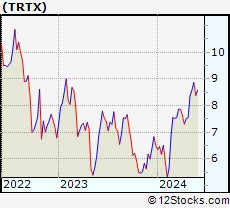 | TRTX TPG RE Finance Trust, Inc. |
| Sector: Financials | |
| SubSector: Mortgage Investment | |
| MarketCap: 607.739 Millions | |
| Recent Price: 8.87 Smart Investing & Trading Score: 90 | |
| Day Percent Change: 0.23% Day Change: 0.02 | |
| Week Change: 3.32% Year-to-date Change: 36.5% | |
| TRTX Links: Profile News Message Board | |
| Charts:- Daily , Weekly | |
| Add TRTX to Watchlist: View: Get Complete TRTX Trend Analysis ➞ | |
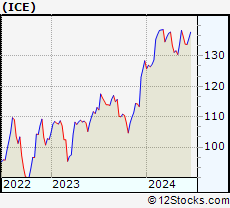 | ICE Intercontinental Exchange, Inc. |
| Sector: Financials | |
| SubSector: Diversified Investments | |
| MarketCap: 46054.6 Millions | |
| Recent Price: 138.40 Smart Investing & Trading Score: 75 | |
| Day Percent Change: 0.94% Day Change: 1.29 | |
| Week Change: 3.29% Year-to-date Change: 7.8% | |
| ICE Links: Profile News Message Board | |
| Charts:- Daily , Weekly | |
| Add ICE to Watchlist: View: Get Complete ICE Trend Analysis ➞ | |
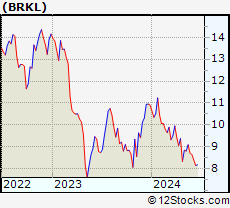 | BRKL Brookline Bancorp, Inc. |
| Sector: Financials | |
| SubSector: Savings & Loans | |
| MarketCap: 894.43 Millions | |
| Recent Price: 9.10 Smart Investing & Trading Score: 74 | |
| Day Percent Change: 0.44% Day Change: 0.04 | |
| Week Change: 3.29% Year-to-date Change: -16.6% | |
| BRKL Links: Profile News Message Board | |
| Charts:- Daily , Weekly | |
| Add BRKL to Watchlist: View: Get Complete BRKL Trend Analysis ➞ | |
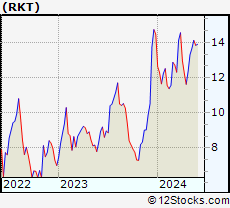 | RKT Rocket Companies, Inc. |
| Sector: Financials | |
| SubSector: Mortgage Finance | |
| MarketCap: 41287 Millions | |
| Recent Price: 14.12 Smart Investing & Trading Score: 63 | |
| Day Percent Change: 1.73% Day Change: 0.24 | |
| Week Change: 3.29% Year-to-date Change: -2.5% | |
| RKT Links: Profile News Message Board | |
| Charts:- Daily , Weekly | |
| Add RKT to Watchlist: View: Get Complete RKT Trend Analysis ➞ | |
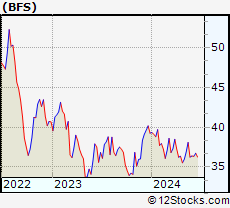 | BFS Saul Centers, Inc. |
| Sector: Financials | |
| SubSector: REIT - Retail | |
| MarketCap: 689.914 Millions | |
| Recent Price: 38.10 Smart Investing & Trading Score: 100 | |
| Day Percent Change: 0.50% Day Change: 0.19 | |
| Week Change: 3.28% Year-to-date Change: -3.0% | |
| BFS Links: Profile News Message Board | |
| Charts:- Daily , Weekly | |
| Add BFS to Watchlist: View: Get Complete BFS Trend Analysis ➞ | |
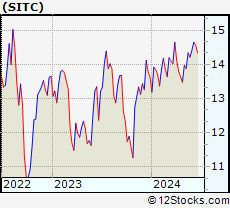 | SITC SITE Centers Corp. |
| Sector: Financials | |
| SubSector: REIT - Retail | |
| MarketCap: 1449.54 Millions | |
| Recent Price: 14.34 Smart Investing & Trading Score: 100 | |
| Day Percent Change: 0.49% Day Change: 0.07 | |
| Week Change: 3.28% Year-to-date Change: 5.2% | |
| SITC Links: Profile News Message Board | |
| Charts:- Daily , Weekly | |
| Add SITC to Watchlist: View: Get Complete SITC Trend Analysis ➞ | |
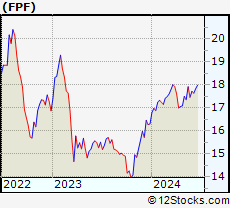 | FPF First Trust Intermediate Duration Preferred & Income Fund |
| Sector: Financials | |
| SubSector: Closed-End Fund - Debt | |
| MarketCap: 918.707 Millions | |
| Recent Price: 17.92 Smart Investing & Trading Score: 93 | |
| Day Percent Change: 0.34% Day Change: 0.06 | |
| Week Change: 3.26% Year-to-date Change: 9.9% | |
| FPF Links: Profile News Message Board | |
| Charts:- Daily , Weekly | |
| Add FPF to Watchlist: View: Get Complete FPF Trend Analysis ➞ | |
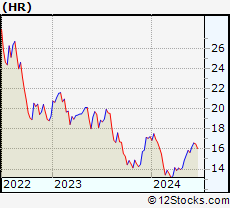 | HR Healthcare Realty Trust Incorporated |
| Sector: Financials | |
| SubSector: REIT - Healthcare Facilities | |
| MarketCap: 3718.84 Millions | |
| Recent Price: 15.87 Smart Investing & Trading Score: 68 | |
| Day Percent Change: -1.18% Day Change: -0.19 | |
| Week Change: 3.25% Year-to-date Change: -7.9% | |
| HR Links: Profile News Message Board | |
| Charts:- Daily , Weekly | |
| Add HR to Watchlist: View: Get Complete HR Trend Analysis ➞ | |
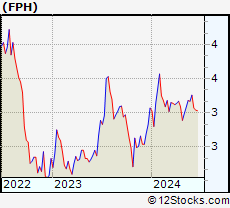 | FPH Five Point Holdings, LLC |
| Sector: Financials | |
| SubSector: REIT - Diversified | |
| MarketCap: 339.953 Millions | |
| Recent Price: 3.18 Smart Investing & Trading Score: 39 | |
| Day Percent Change: 0.32% Day Change: 0.01 | |
| Week Change: 3.25% Year-to-date Change: 3.6% | |
| FPH Links: Profile News Message Board | |
| Charts:- Daily , Weekly | |
| Add FPH to Watchlist: View: Get Complete FPH Trend Analysis ➞ | |
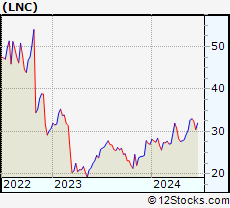 | LNC Lincoln National Corporation |
| Sector: Financials | |
| SubSector: Life Insurance | |
| MarketCap: 4545.26 Millions | |
| Recent Price: 30.26 Smart Investing & Trading Score: 95 | |
| Day Percent Change: 0.67% Day Change: 0.20 | |
| Week Change: 3.24% Year-to-date Change: 12.2% | |
| LNC Links: Profile News Message Board | |
| Charts:- Daily , Weekly | |
| Add LNC to Watchlist: View: Get Complete LNC Trend Analysis ➞ | |
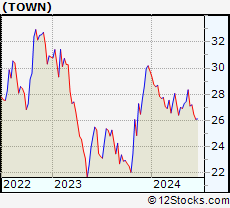 | TOWN TowneBank |
| Sector: Financials | |
| SubSector: Regional - Mid-Atlantic Banks | |
| MarketCap: 1344.09 Millions | |
| Recent Price: 28.34 Smart Investing & Trading Score: 100 | |
| Day Percent Change: 1.40% Day Change: 0.39 | |
| Week Change: 3.24% Year-to-date Change: -4.8% | |
| TOWN Links: Profile News Message Board | |
| Charts:- Daily , Weekly | |
| Add TOWN to Watchlist: View: Get Complete TOWN Trend Analysis ➞ | |
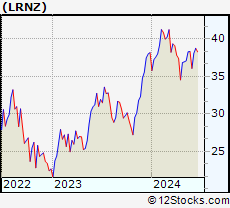 | LRNZ TrueShares Technology, AI and Deep Learning ETF |
| Sector: Financials | |
| SubSector: Exchange Traded Fund | |
| MarketCap: 60157 Millions | |
| Recent Price: 38.28 Smart Investing & Trading Score: 52 | |
| Day Percent Change: -0.21% Day Change: -0.08 | |
| Week Change: 3.23% Year-to-date Change: 0.3% | |
| LRNZ Links: Profile News Message Board | |
| Charts:- Daily , Weekly | |
| Add LRNZ to Watchlist: View: Get Complete LRNZ Trend Analysis ➞ | |
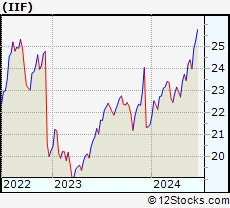 | IIF Morgan Stanley India Investment Fund, Inc. |
| Sector: Financials | |
| SubSector: Closed-End Fund - Foreign | |
| MarketCap: 166.247 Millions | |
| Recent Price: 24.21 Smart Investing & Trading Score: 100 | |
| Day Percent Change: 1.21% Day Change: 0.29 | |
| Week Change: 3.2% Year-to-date Change: 12.8% | |
| IIF Links: Profile News Message Board | |
| Charts:- Daily , Weekly | |
| Add IIF to Watchlist: View: Get Complete IIF Trend Analysis ➞ | |
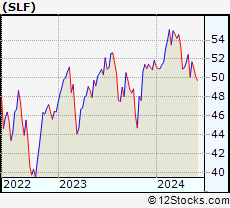 | SLF Sun Life Financial Inc. |
| Sector: Financials | |
| SubSector: Property & Casualty Insurance | |
| MarketCap: 17722 Millions | |
| Recent Price: 51.70 Smart Investing & Trading Score: 50 | |
| Day Percent Change: 0.39% Day Change: 0.20 | |
| Week Change: 3.19% Year-to-date Change: -0.3% | |
| SLF Links: Profile News Message Board | |
| Charts:- Daily , Weekly | |
| Add SLF to Watchlist: View: Get Complete SLF Trend Analysis ➞ | |
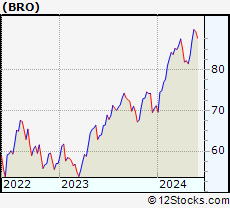 | BRO Brown & Brown, Inc. |
| Sector: Financials | |
| SubSector: Insurance Brokers | |
| MarketCap: 10475.7 Millions | |
| Recent Price: 89.83 Smart Investing & Trading Score: 95 | |
| Day Percent Change: 0.48% Day Change: 0.43 | |
| Week Change: 3.17% Year-to-date Change: 26.3% | |
| BRO Links: Profile News Message Board | |
| Charts:- Daily , Weekly | |
| Add BRO to Watchlist: View: Get Complete BRO Trend Analysis ➞ | |
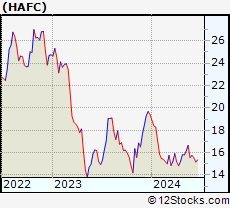 | HAFC Hanmi Financial Corporation |
| Sector: Financials | |
| SubSector: Regional - Pacific Banks | |
| MarketCap: 319.929 Millions | |
| Recent Price: 16.65 Smart Investing & Trading Score: 95 | |
| Day Percent Change: 0.24% Day Change: 0.04 | |
| Week Change: 3.16% Year-to-date Change: -14.2% | |
| HAFC Links: Profile News Message Board | |
| Charts:- Daily , Weekly | |
| Add HAFC to Watchlist: View: Get Complete HAFC Trend Analysis ➞ | |
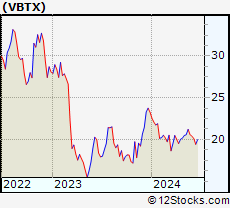 | VBTX Veritex Holdings, Inc. |
| Sector: Financials | |
| SubSector: Regional - Southwest Banks | |
| MarketCap: 625.165 Millions | |
| Recent Price: 21.22 Smart Investing & Trading Score: 100 | |
| Day Percent Change: 1.73% Day Change: 0.36 | |
| Week Change: 3.11% Year-to-date Change: -8.8% | |
| VBTX Links: Profile News Message Board | |
| Charts:- Daily , Weekly | |
| Add VBTX to Watchlist: View: Get Complete VBTX Trend Analysis ➞ | |
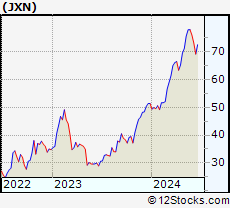 | JXN Jackson Financial Inc. |
| Sector: Financials | |
| SubSector: Insurance - Life | |
| MarketCap: 2460 Millions | |
| Recent Price: 77.97 Smart Investing & Trading Score: 93 | |
| Day Percent Change: 3.00% Day Change: 2.27 | |
| Week Change: 3.11% Year-to-date Change: 51.7% | |
| JXN Links: Profile News Message Board | |
| Charts:- Daily , Weekly | |
| Add JXN to Watchlist: View: Get Complete JXN Trend Analysis ➞ | |
| For tabular summary view of above stock list: Summary View ➞ 0 - 25 , 25 - 50 , 50 - 75 , 75 - 100 , 100 - 125 , 125 - 150 , 150 - 175 , 175 - 200 , 200 - 225 , 225 - 250 , 250 - 275 , 275 - 300 , 300 - 325 , 325 - 350 , 350 - 375 , 375 - 400 , 400 - 425 , 425 - 450 , 450 - 475 , 475 - 500 , 500 - 525 , 525 - 550 , 550 - 575 , 575 - 600 , 600 - 625 , 625 - 650 , 650 - 675 , 675 - 700 , 700 - 725 , 725 - 750 , 750 - 775 , 775 - 800 , 800 - 825 , 825 - 850 , 850 - 875 , 875 - 900 , 900 - 925 , 925 - 950 , 950 - 975 , 975 - 1000 , 1000 - 1025 , 1025 - 1050 , 1050 - 1075 , 1075 - 1100 , 1100 - 1125 , 1125 - 1150 , 1150 - 1175 , 1175 - 1200 , 1200 - 1225 | ||
| Click To Change The Sort Order: By Market Cap or Company Size Performance: Year-to-date, Week and Day | |
| Select Chart Type: | ||
|
Best Stocks Today 12Stocks.com |
© 2024 12Stocks.com Terms & Conditions Privacy Contact Us
All Information Provided Only For Education And Not To Be Used For Investing or Trading. See Terms & Conditions


One More Thing ... Get Best Stocks Delivered Daily!
Never Ever Miss A Move With Our Top Ten Stocks Lists
Find Best Stocks In Any Market - Bull or Bear Market
Take A Peek At Our Top Ten Stocks Lists: Daily, Weekly, Year-to-Date & Top Trends
Find Best Stocks In Any Market - Bull or Bear Market
Take A Peek At Our Top Ten Stocks Lists: Daily, Weekly, Year-to-Date & Top Trends
Financial Stocks With Best Up Trends [0-bearish to 100-bullish]: Fangdd Network[100], Xinyuan Real[100], MicroSectors Gold[100], Sprott Physical[100], Citizens & Northern[100], Sumitomo Mitsui[100], First Community[100], Chubb [100], Angel Oak[100], Sprott Physical[100], Iris Energy[100]
Best Financial Stocks Year-to-Date:
Root [526.36%], Fangdd Network[149.63%], Banco Macro[126.41%], Grupo Financiero[112.4%], Banco BBVA[110.66%], SelectQuote [110.22%], Gladstone Capital[106.92%], EverQuote [98.2%], Hippo [92.54%], Grupo Supervielle[86.95%], Vista Oil[60.93%] Best Financial Stocks This Week:
Fangdd Network[360.27%], Xinyuan Real[53.28%], Iris Energy[25.68%], Fathom [25.35%], Huize Holding[21.83%], First Foundation[18.98%], Trupanion [17.21%], Bridge [16.67%], MicroSectors Gold[15.19%], KE [13.86%], Douglas Elliman[13.56%] Best Financial Stocks Daily:
Fangdd Network[321.26%], Xinyuan Real[39.49%], MicroSectors Gold[12.02%], Fathom [9.88%], Citizens [8.53%], Hywin [8.28%], Root [6.10%], First Foundation[6.09%], Sprott Physical[6.09%], Freedom Holding[5.02%], NexGen Energy[4.99%]