
 Login Sign Up


| |||||
 |  | ||||

| 12Stocks.com Market Intelligence |
Best Financial Stocks
| In a hurry? Financial Stocks Lists: Performance Trends Table, Stock Charts
Sort Financial stocks: Daily, Weekly, Year-to-Date, Market Cap & Trends. Filter Financial stocks list by size:All Financial Large Mid-Range Small & MicroCap |
| 12Stocks.com Financial Stocks Performances & Trends Daily | |||||||||
|
|  The overall Smart Investing & Trading Score is 95 (0-bearish to 100-bullish) which puts Financial sector in short term bullish trend. The Smart Investing & Trading Score from previous trading session is 100 and a deterioration of trend continues.
| ||||||||
Here are the Smart Investing & Trading Scores of the most requested Financial stocks at 12Stocks.com (click stock name for detailed review):
|


| 12Stocks.com: Investing in Financial sector with Stocks | |
|
The following table helps investors and traders sort through current performance and trends (as measured by Smart Investing & Trading Score) of various
stocks in the Financial sector. Quick View: Move mouse or cursor over stock symbol (ticker) to view short-term Technical chart and over stock name to view long term chart. Click on  to add stock symbol to your watchlist and to add stock symbol to your watchlist and  to view watchlist. Click on any ticker or stock name for detailed market intelligence report for that stock. to view watchlist. Click on any ticker or stock name for detailed market intelligence report for that stock. |
12Stocks.com Performance of Stocks in Financial Sector
| Ticker | Stock Name | Watchlist | Category | Recent Price | Smart Investing & Trading Score | Change % | Weekly Change% |
| HQH | Tekla Healthcare |   | Closed-End Fund - Equity | 17.42 | 76 | -0.63% | 2.10% |
| EFC | Ellington | | Mortgage | 12.15 | 95 | 0.50% | 2.10% |
| PRU | Prudential | | Life Insurance | 121.31 | 95 | 1.15% | 2.09% |
| CEE | Central and | | Closed-End Fund - Foreign | 10.20 | 78 | -0.98% | 2.09% |
| SMBK | Smart | | Regional Banks | 23.00 | 90 | 0.48% | 2.09% |
| UBFO | United Security | | Regional Banks | 7.40 | 54 | 0.14% | 2.07% |
| GF | New Germany | | Closed-End Fund - Foreign | 8.86 | 90 | 0.80% | 2.07% |
| JBGS | JBG SMITH | | Property Mgmt | 14.80 | 37 | -0.80% | 2.07% |
| JIG | JPMorgan | | Exchange Traded Fund | 63.80 | 88 | 0.10% | 2.07% |
| LTC | LTC Properties | | REIT | 34.76 | 83 | 0.35% | 2.06% |
| JEF | Jefferies | | Brokerage | 47.32 | 83 | 0.08% | 2.05% |
| MET | MetLife | | Life Insurance | 74.22 | 100 | 1.02% | 2.05% |
| FSBW | FS Bancorp | | Regional Banks | 33.36 | 53 | -0.76% | 2.05% |
| PWP | Perella Weinberg | | Capital Markets | 15.53 | 95 | 1.24% | 2.04% |
| PFS | Provident | | S&L | 16.18 | 83 | 0.43% | 2.02% |
| THFF | First | | Regional Banks | 39.17 | 95 | 0.56% | 2.01% |
| BMRC | Bank of Marin Bancorp | | Regional Banks | 16.29 | 69 | -0.12% | 2.00% |
| AEF | Aberdeen Emerging | | Asset Mgmt | 5.36 | 90 | 0.56% | 2.00% |
| ORC | Orchid Island | | Mortgage | 8.70 | 93 | 0.46% | 1.99% |
| TDF | Templeton Dragon | | Closed-End Fund - Foreign | 8.74 | 90 | 0.46% | 1.98% |
| EQC | Equity Commonwealth | | REIT - Office | 19.55 | 83 | -0.26% | 1.98% |
| MS | Morgan Stanley | | Brokerage | 100.22 | 83 | 0.64% | 1.97% |
| HTH | Hilltop | | Mortgage | 32.10 | 83 | -0.31% | 1.97% |
| HIFS | Hingham Institution | | S&L | 185.10 | 75 | -0.76% | 1.97% |
| AX | Axos | | S&L | 61.52 | 76 | 0.62% | 1.97% |
| For chart view version of above stock list: Chart View ➞ 0 - 25 , 25 - 50 , 50 - 75 , 75 - 100 , 100 - 125 , 125 - 150 , 150 - 175 , 175 - 200 , 200 - 225 , 225 - 250 , 250 - 275 , 275 - 300 , 300 - 325 , 325 - 350 , 350 - 375 , 375 - 400 , 400 - 425 , 425 - 450 , 450 - 475 , 475 - 500 , 500 - 525 , 525 - 550 , 550 - 575 , 575 - 600 , 600 - 625 , 625 - 650 , 650 - 675 , 675 - 700 , 700 - 725 , 725 - 750 , 750 - 775 , 775 - 800 , 800 - 825 , 825 - 850 , 850 - 875 , 875 - 900 , 900 - 925 , 925 - 950 , 950 - 975 , 975 - 1000 , 1000 - 1025 , 1025 - 1050 , 1050 - 1075 , 1075 - 1100 , 1100 - 1125 , 1125 - 1150 , 1150 - 1175 , 1175 - 1200 , 1200 - 1225 | ||
 | Click To Change The Sort Order: By Market Cap or Company Size Performance: Year-to-date, Week and Day |  |
|
Get the most comprehensive stock market coverage daily at 12Stocks.com ➞ Best Stocks Today ➞ Best Stocks Weekly ➞ Best Stocks Year-to-Date ➞ Best Stocks Trends ➞  Best Stocks Today 12Stocks.com Best Nasdaq Stocks ➞ Best S&P 500 Stocks ➞ Best Tech Stocks ➞ Best Biotech Stocks ➞ |
| Detailed Overview of Financial Stocks |
| Financial Technical Overview, Leaders & Laggards, Top Financial ETF Funds & Detailed Financial Stocks List, Charts, Trends & More |
| Financial Sector: Technical Analysis, Trends & YTD Performance | |
| Financial sector is composed of stocks
from banks, brokers, insurance, REITs
and services subsectors. Financial sector, as represented by XLF, an exchange-traded fund [ETF] that holds basket of Financial stocks (e.g, Bank of America, Goldman Sachs) is up by 13.01% and is currently outperforming the overall market by 2.44% year-to-date. Below is a quick view of Technical charts and trends: |
|
 XLF Weekly Chart |
|
| Long Term Trend: Very Good | |
| Medium Term Trend: Very Good | |
 XLF Daily Chart |
|
| Short Term Trend: Very Good | |
| Overall Trend Score: 95 | |
| YTD Performance: 13.01% | |
| **Trend Scores & Views Are Only For Educational Purposes And Not For Investing | |
| 12Stocks.com: Top Performing Financial Sector Stocks | ||||||||||||||||||||||||||||||||||||||||||||||||
 The top performing Financial sector stocks year to date are
Now, more recently, over last week, the top performing Financial sector stocks on the move are


|
||||||||||||||||||||||||||||||||||||||||||||||||
| 12Stocks.com: Investing in Financial Sector using Exchange Traded Funds | |
|
The following table shows list of key exchange traded funds (ETF) that
help investors track Financial Index. For detailed view, check out our ETF Funds section of our website. Quick View: Move mouse or cursor over ETF symbol (ticker) to view short-term Technical chart and over ETF name to view long term chart. Click on ticker or stock name for detailed view. Click on to add stock symbol to your watchlist and to view watchlist. |
12Stocks.com List of ETFs that track Financial Index
| Ticker | ETF Name | Watchlist | Recent Price | Smart Investing & Trading Score | Change % | Week % | Year-to-date % |
| XLF | Financial | | 42.49 | 95 | 0.73 | 1.58 | 13.01% |
| IAI | Broker-Dealers & Secs | | 119.47 | 100 | 1.08 | 2.59 | 10.08% |
| IYF | Financials | | 96.85 | 95 | 0.43 | 1.73 | 13.39% |
| IYG | Financial Services | | 67.11 | 95 | 0.15 | 1.56 | 12.34% |
| KRE | Regional Banking | | 51.19 | 83 | 0.23 | 1.67 | -2.37% |
| IXG | Global Financials | | 88.72 | 88 | 0.21 | 1.41 | 12.91% |
| VFH | Financials | | 103.00 | 95 | 0.18 | 1.45 | 11.64% |
| KBE | Bank | | 47.93 | 83 | 0.44 | 1.25 | 4.15% |
| FAS | Financial Bull 3X | | 112.32 | 95 | 1.81 | 4.06 | 35.9% |
| FAZ | Financial Bear 3X | | 9.75 | 10 | -1.71 | -3.75 | -28.68% |
| UYG | Financials | | 68.54 | 100 | 1.23 | 2.77 | 24.17% |
| IAT | Regional Banks | | 43.42 | 76 | -0.26 | 1.02 | 3.78% |
| KIE | Insurance | | 51.83 | 100 | 0.88 | 1.09 | 14.62% |
| PSCF | SmallCap Financials | | 49.03 | 95 | 0.28 | 1.44 | -0.31% |
| EUFN | Europe Financials | | 24.13 | 95 | 0.67 | 2.51 | 15.12% |
| PGF | Financial Preferred | | 14.81 | 52 | -0.10 | 0.68 | 1.58% |
| 12Stocks.com: Charts, Trends, Fundamental Data and Performances of Financial Stocks | |
|
We now take in-depth look at all Financial stocks including charts, multi-period performances and overall trends (as measured by Smart Investing & Trading Score). One can sort Financial stocks (click link to choose) by Daily, Weekly and by Year-to-Date performances. Also, one can sort by size of the company or by market capitalization. |
| Select Your Default Chart Type: | |||||
| |||||
| Click on stock symbol or name for detailed view. Click on to add stock symbol to your watchlist and to view watchlist. Quick View: Move mouse or cursor over "Daily" to quickly view daily Technical stock chart and over "Weekly" to view weekly Technical stock chart. | |||||

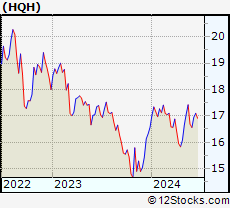 | HQH Tekla Healthcare Investors |
| Sector: Financials | |
| SubSector: Closed-End Fund - Equity | |
| MarketCap: 660.347 Millions | |
| Recent Price: 17.42 Smart Investing & Trading Score: 76 | |
| Day Percent Change: -0.63% Day Change: -0.11 | |
| Week Change: 2.1% Year-to-date Change: 5.1% | |
| HQH Links: Profile News Message Board | |
| Charts:- Daily , Weekly | |
| Add HQH to Watchlist: View: Get Complete HQH Trend Analysis ➞ | |
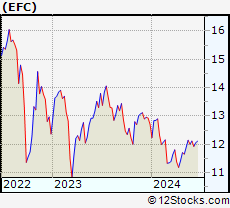 | EFC Ellington Financial Inc. |
| Sector: Financials | |
| SubSector: Mortgage Investment | |
| MarketCap: 380.239 Millions | |
| Recent Price: 12.15 Smart Investing & Trading Score: 95 | |
| Day Percent Change: 0.50% Day Change: 0.06 | |
| Week Change: 2.1% Year-to-date Change: -4.4% | |
| EFC Links: Profile News Message Board | |
| Charts:- Daily , Weekly | |
| Add EFC to Watchlist: View: Get Complete EFC Trend Analysis ➞ | |
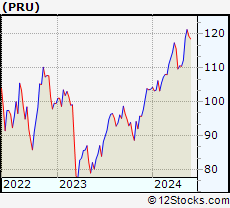 | PRU Prudential Financial, Inc. |
| Sector: Financials | |
| SubSector: Life Insurance | |
| MarketCap: 21001.6 Millions | |
| Recent Price: 121.31 Smart Investing & Trading Score: 95 | |
| Day Percent Change: 1.15% Day Change: 1.38 | |
| Week Change: 2.09% Year-to-date Change: 17.0% | |
| PRU Links: Profile News Message Board | |
| Charts:- Daily , Weekly | |
| Add PRU to Watchlist: View: Get Complete PRU Trend Analysis ➞ | |
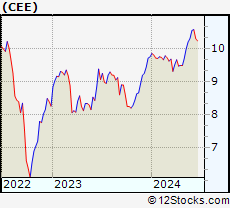 | CEE The Central and Eastern Europe Fund, Inc. |
| Sector: Financials | |
| SubSector: Closed-End Fund - Foreign | |
| MarketCap: 105.847 Millions | |
| Recent Price: 10.20 Smart Investing & Trading Score: 78 | |
| Day Percent Change: -0.98% Day Change: -0.10 | |
| Week Change: 2.09% Year-to-date Change: 4.6% | |
| CEE Links: Profile News Message Board | |
| Charts:- Daily , Weekly | |
| Add CEE to Watchlist: View: Get Complete CEE Trend Analysis ➞ | |
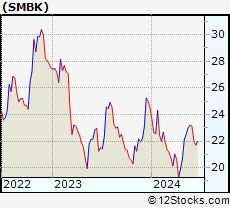 | SMBK SmartFinancial, Inc. |
| Sector: Financials | |
| SubSector: Regional - Southeast Banks | |
| MarketCap: 174.035 Millions | |
| Recent Price: 23.00 Smart Investing & Trading Score: 90 | |
| Day Percent Change: 0.48% Day Change: 0.11 | |
| Week Change: 2.09% Year-to-date Change: -6.1% | |
| SMBK Links: Profile News Message Board | |
| Charts:- Daily , Weekly | |
| Add SMBK to Watchlist: View: Get Complete SMBK Trend Analysis ➞ | |
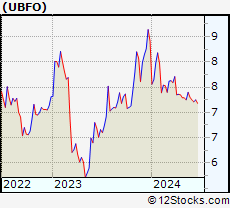 | UBFO United Security Bancshares |
| Sector: Financials | |
| SubSector: Regional - Pacific Banks | |
| MarketCap: 135.029 Millions | |
| Recent Price: 7.40 Smart Investing & Trading Score: 54 | |
| Day Percent Change: 0.14% Day Change: 0.01 | |
| Week Change: 2.07% Year-to-date Change: -12.0% | |
| UBFO Links: Profile News Message Board | |
| Charts:- Daily , Weekly | |
| Add UBFO to Watchlist: View: Get Complete UBFO Trend Analysis ➞ | |
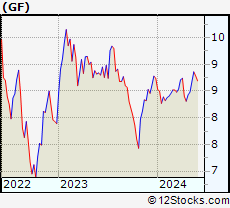 | GF The New Germany Fund, Inc. |
| Sector: Financials | |
| SubSector: Closed-End Fund - Foreign | |
| MarketCap: 152.547 Millions | |
| Recent Price: 8.86 Smart Investing & Trading Score: 90 | |
| Day Percent Change: 0.80% Day Change: 0.07 | |
| Week Change: 2.07% Year-to-date Change: 1.4% | |
| GF Links: Profile News Message Board | |
| Charts:- Daily , Weekly | |
| Add GF to Watchlist: View: Get Complete GF Trend Analysis ➞ | |
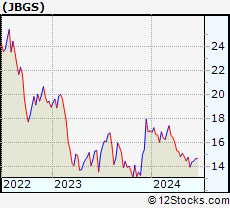 | JBGS JBG SMITH Properties |
| Sector: Financials | |
| SubSector: Property Management | |
| MarketCap: 4335.32 Millions | |
| Recent Price: 14.80 Smart Investing & Trading Score: 37 | |
| Day Percent Change: -0.80% Day Change: -0.12 | |
| Week Change: 2.07% Year-to-date Change: -13.0% | |
| JBGS Links: Profile News Message Board | |
| Charts:- Daily , Weekly | |
| Add JBGS to Watchlist: View: Get Complete JBGS Trend Analysis ➞ | |
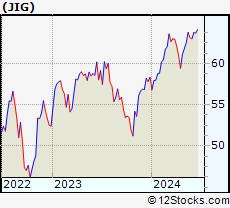 | JIG JPMorgan International Growth ETF |
| Sector: Financials | |
| SubSector: Exchange Traded Fund | |
| MarketCap: 60157 Millions | |
| Recent Price: 63.80 Smart Investing & Trading Score: 88 | |
| Day Percent Change: 0.10% Day Change: 0.06 | |
| Week Change: 2.07% Year-to-date Change: 9.4% | |
| JIG Links: Profile News Message Board | |
| Charts:- Daily , Weekly | |
| Add JIG to Watchlist: View: Get Complete JIG Trend Analysis ➞ | |
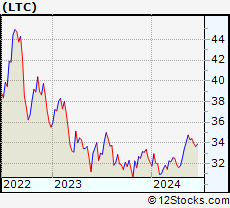 | LTC LTC Properties, Inc. |
| Sector: Financials | |
| SubSector: REIT - Healthcare Facilities | |
| MarketCap: 1369.24 Millions | |
| Recent Price: 34.76 Smart Investing & Trading Score: 83 | |
| Day Percent Change: 0.35% Day Change: 0.12 | |
| Week Change: 2.06% Year-to-date Change: 8.2% | |
| LTC Links: Profile News Message Board | |
| Charts:- Daily , Weekly | |
| Add LTC to Watchlist: View: Get Complete LTC Trend Analysis ➞ | |
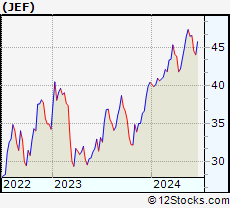 | JEF Jefferies Financial Group Inc. |
| Sector: Financials | |
| SubSector: Investment Brokerage - Regional | |
| MarketCap: 3987.15 Millions | |
| Recent Price: 47.32 Smart Investing & Trading Score: 83 | |
| Day Percent Change: 0.08% Day Change: 0.04 | |
| Week Change: 2.05% Year-to-date Change: 17.1% | |
| JEF Links: Profile News Message Board | |
| Charts:- Daily , Weekly | |
| Add JEF to Watchlist: View: Get Complete JEF Trend Analysis ➞ | |
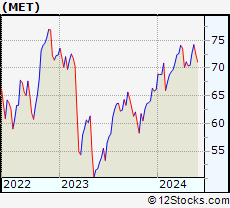 | MET MetLife, Inc. |
| Sector: Financials | |
| SubSector: Life Insurance | |
| MarketCap: 26272.9 Millions | |
| Recent Price: 74.22 Smart Investing & Trading Score: 100 | |
| Day Percent Change: 1.02% Day Change: 0.75 | |
| Week Change: 2.05% Year-to-date Change: 12.2% | |
| MET Links: Profile News Message Board | |
| Charts:- Daily , Weekly | |
| Add MET to Watchlist: View: Get Complete MET Trend Analysis ➞ | |
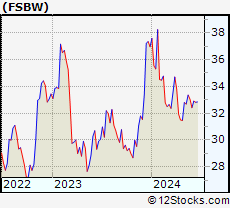 | FSBW FS Bancorp, Inc. |
| Sector: Financials | |
| SubSector: Regional - Pacific Banks | |
| MarketCap: 140.429 Millions | |
| Recent Price: 33.36 Smart Investing & Trading Score: 53 | |
| Day Percent Change: -0.76% Day Change: -0.26 | |
| Week Change: 2.05% Year-to-date Change: -9.7% | |
| FSBW Links: Profile News Message Board | |
| Charts:- Daily , Weekly | |
| Add FSBW to Watchlist: View: Get Complete FSBW Trend Analysis ➞ | |
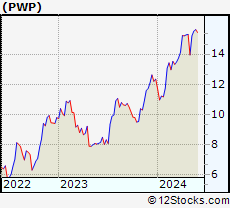 | PWP Perella Weinberg Partners |
| Sector: Financials | |
| SubSector: Capital Markets | |
| MarketCap: 705 Millions | |
| Recent Price: 15.53 Smart Investing & Trading Score: 95 | |
| Day Percent Change: 1.24% Day Change: 0.19 | |
| Week Change: 2.04% Year-to-date Change: 25.8% | |
| PWP Links: Profile News Message Board | |
| Charts:- Daily , Weekly | |
| Add PWP to Watchlist: View: Get Complete PWP Trend Analysis ➞ | |
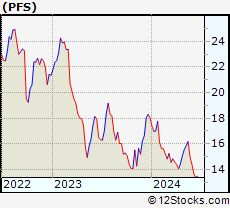 | PFS Provident Financial Services, Inc. |
| Sector: Financials | |
| SubSector: Savings & Loans | |
| MarketCap: 829.73 Millions | |
| Recent Price: 16.18 Smart Investing & Trading Score: 83 | |
| Day Percent Change: 0.43% Day Change: 0.07 | |
| Week Change: 2.02% Year-to-date Change: -10.3% | |
| PFS Links: Profile News Message Board | |
| Charts:- Daily , Weekly | |
| Add PFS to Watchlist: View: Get Complete PFS Trend Analysis ➞ | |
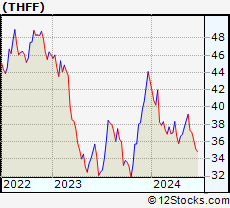 | THFF First Financial Corporation |
| Sector: Financials | |
| SubSector: Regional - Midwest Banks | |
| MarketCap: 433.07 Millions | |
| Recent Price: 39.17 Smart Investing & Trading Score: 95 | |
| Day Percent Change: 0.56% Day Change: 0.22 | |
| Week Change: 2.01% Year-to-date Change: -9.0% | |
| THFF Links: Profile News Message Board | |
| Charts:- Daily , Weekly | |
| Add THFF to Watchlist: View: Get Complete THFF Trend Analysis ➞ | |
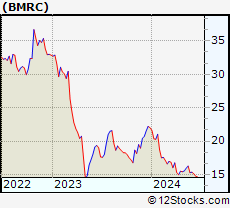 | BMRC Bank of Marin Bancorp |
| Sector: Financials | |
| SubSector: Regional - Pacific Banks | |
| MarketCap: 367.929 Millions | |
| Recent Price: 16.29 Smart Investing & Trading Score: 69 | |
| Day Percent Change: -0.12% Day Change: -0.02 | |
| Week Change: 2% Year-to-date Change: -26.0% | |
| BMRC Links: Profile News Message Board | |
| Charts:- Daily , Weekly | |
| Add BMRC to Watchlist: View: Get Complete BMRC Trend Analysis ➞ | |
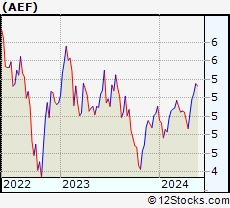 | AEF Aberdeen Emerging Markets Equity Income Fund, Inc. |
| Sector: Financials | |
| SubSector: Asset Management | |
| MarketCap: 245.803 Millions | |
| Recent Price: 5.36 Smart Investing & Trading Score: 90 | |
| Day Percent Change: 0.56% Day Change: 0.03 | |
| Week Change: 2% Year-to-date Change: 4.8% | |
| AEF Links: Profile News Message Board | |
| Charts:- Daily , Weekly | |
| Add AEF to Watchlist: View: Get Complete AEF Trend Analysis ➞ | |
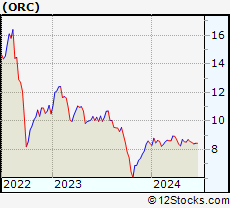 | ORC Orchid Island Capital, Inc. |
| Sector: Financials | |
| SubSector: Mortgage Investment | |
| MarketCap: 212.339 Millions | |
| Recent Price: 8.70 Smart Investing & Trading Score: 93 | |
| Day Percent Change: 0.46% Day Change: 0.04 | |
| Week Change: 1.99% Year-to-date Change: 3.2% | |
| ORC Links: Profile News Message Board | |
| Charts:- Daily , Weekly | |
| Add ORC to Watchlist: View: Get Complete ORC Trend Analysis ➞ | |
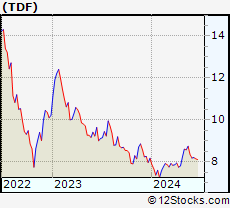 | TDF Templeton Dragon Fund, Inc. |
| Sector: Financials | |
| SubSector: Closed-End Fund - Foreign | |
| MarketCap: 507.847 Millions | |
| Recent Price: 8.74 Smart Investing & Trading Score: 90 | |
| Day Percent Change: 0.46% Day Change: 0.04 | |
| Week Change: 1.98% Year-to-date Change: 7.0% | |
| TDF Links: Profile News Message Board | |
| Charts:- Daily , Weekly | |
| Add TDF to Watchlist: View: Get Complete TDF Trend Analysis ➞ | |
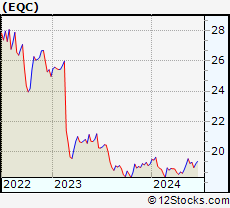 | EQC Equity Commonwealth |
| Sector: Financials | |
| SubSector: REIT - Office | |
| MarketCap: 3659.36 Millions | |
| Recent Price: 19.55 Smart Investing & Trading Score: 83 | |
| Day Percent Change: -0.26% Day Change: -0.05 | |
| Week Change: 1.98% Year-to-date Change: 1.8% | |
| EQC Links: Profile News Message Board | |
| Charts:- Daily , Weekly | |
| Add EQC to Watchlist: View: Get Complete EQC Trend Analysis ➞ | |
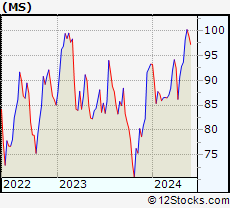 | MS Morgan Stanley |
| Sector: Financials | |
| SubSector: Investment Brokerage - National | |
| MarketCap: 55876.7 Millions | |
| Recent Price: 100.22 Smart Investing & Trading Score: 83 | |
| Day Percent Change: 0.64% Day Change: 0.64 | |
| Week Change: 1.97% Year-to-date Change: 7.5% | |
| MS Links: Profile News Message Board | |
| Charts:- Daily , Weekly | |
| Add MS to Watchlist: View: Get Complete MS Trend Analysis ➞ | |
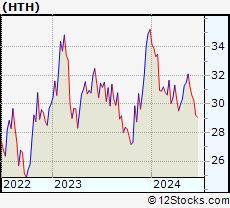 | HTH Hilltop Holdings Inc. |
| Sector: Financials | |
| SubSector: Mortgage Investment | |
| MarketCap: 1317.89 Millions | |
| Recent Price: 32.10 Smart Investing & Trading Score: 83 | |
| Day Percent Change: -0.31% Day Change: -0.10 | |
| Week Change: 1.97% Year-to-date Change: -8.8% | |
| HTH Links: Profile News Message Board | |
| Charts:- Daily , Weekly | |
| Add HTH to Watchlist: View: Get Complete HTH Trend Analysis ➞ | |
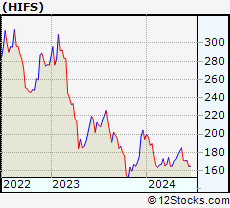 | HIFS Hingham Institution for Savings |
| Sector: Financials | |
| SubSector: Savings & Loans | |
| MarketCap: 341.93 Millions | |
| Recent Price: 185.10 Smart Investing & Trading Score: 75 | |
| Day Percent Change: -0.76% Day Change: -1.41 | |
| Week Change: 1.97% Year-to-date Change: -4.8% | |
| HIFS Links: Profile News Message Board | |
| Charts:- Daily , Weekly | |
| Add HIFS to Watchlist: View: Get Complete HIFS Trend Analysis ➞ | |
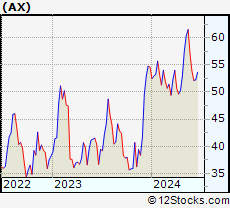 | AX Axos Financial, Inc. |
| Sector: Financials | |
| SubSector: Savings & Loans | |
| MarketCap: 1037.3 Millions | |
| Recent Price: 61.52 Smart Investing & Trading Score: 76 | |
| Day Percent Change: 0.62% Day Change: 0.38 | |
| Week Change: 1.97% Year-to-date Change: 12.7% | |
| AX Links: Profile News Message Board | |
| Charts:- Daily , Weekly | |
| Add AX to Watchlist: View: Get Complete AX Trend Analysis ➞ | |
| For tabular summary view of above stock list: Summary View ➞ 0 - 25 , 25 - 50 , 50 - 75 , 75 - 100 , 100 - 125 , 125 - 150 , 150 - 175 , 175 - 200 , 200 - 225 , 225 - 250 , 250 - 275 , 275 - 300 , 300 - 325 , 325 - 350 , 350 - 375 , 375 - 400 , 400 - 425 , 425 - 450 , 450 - 475 , 475 - 500 , 500 - 525 , 525 - 550 , 550 - 575 , 575 - 600 , 600 - 625 , 625 - 650 , 650 - 675 , 675 - 700 , 700 - 725 , 725 - 750 , 750 - 775 , 775 - 800 , 800 - 825 , 825 - 850 , 850 - 875 , 875 - 900 , 900 - 925 , 925 - 950 , 950 - 975 , 975 - 1000 , 1000 - 1025 , 1025 - 1050 , 1050 - 1075 , 1075 - 1100 , 1100 - 1125 , 1125 - 1150 , 1150 - 1175 , 1175 - 1200 , 1200 - 1225 | ||
| Click To Change The Sort Order: By Market Cap or Company Size Performance: Year-to-date, Week and Day | |
| Select Chart Type: | ||
|
Best Stocks Today 12Stocks.com |
© 2024 12Stocks.com Terms & Conditions Privacy Contact Us
All Information Provided Only For Education And Not To Be Used For Investing or Trading. See Terms & Conditions


One More Thing ... Get Best Stocks Delivered Daily!
Never Ever Miss A Move With Our Top Ten Stocks Lists
Find Best Stocks In Any Market - Bull or Bear Market
Take A Peek At Our Top Ten Stocks Lists: Daily, Weekly, Year-to-Date & Top Trends
Find Best Stocks In Any Market - Bull or Bear Market
Take A Peek At Our Top Ten Stocks Lists: Daily, Weekly, Year-to-Date & Top Trends
Financial Stocks With Best Up Trends [0-bearish to 100-bullish]: Fangdd Network[100], Xinyuan Real[100], MicroSectors Gold[100], Sprott Physical[100], Citizens & Northern[100], Sumitomo Mitsui[100], First Community[100], Chubb [100], Angel Oak[100], Sprott Physical[100], Iris Energy[100]
Best Financial Stocks Year-to-Date:
Root [526.36%], Fangdd Network[149.63%], Banco Macro[126.41%], Grupo Financiero[112.4%], Banco BBVA[110.66%], SelectQuote [110.22%], Gladstone Capital[106.92%], EverQuote [98.2%], Hippo [92.54%], Grupo Supervielle[86.95%], Vista Oil[60.93%] Best Financial Stocks This Week:
Fangdd Network[360.27%], Xinyuan Real[53.28%], Iris Energy[25.68%], Fathom [25.35%], Huize Holding[21.83%], First Foundation[18.98%], Trupanion [17.21%], Bridge [16.67%], MicroSectors Gold[15.19%], KE [13.86%], Douglas Elliman[13.56%] Best Financial Stocks Daily:
Fangdd Network[321.26%], Xinyuan Real[39.49%], MicroSectors Gold[12.02%], Fathom [9.88%], Citizens [8.53%], Hywin [8.28%], Root [6.10%], First Foundation[6.09%], Sprott Physical[6.09%], Freedom Holding[5.02%], NexGen Energy[4.99%]