
 Login Sign Up


| |||||
 |  | ||||

| 12Stocks.com Market Intelligence |
Best Financial Stocks
| In a hurry? Financial Stocks Lists: Performance Trends Table, Stock Charts
Sort Financial stocks: Daily, Weekly, Year-to-Date, Market Cap & Trends. Filter Financial stocks list by size:All Financial Large Mid-Range Small & MicroCap |
| 12Stocks.com Financial Stocks Performances & Trends Daily | |||||||||
|
|  The overall Smart Investing & Trading Score is 95 (0-bearish to 100-bullish) which puts Financial sector in short term bullish trend. The Smart Investing & Trading Score from previous trading session is 100 and a deterioration of trend continues.
| ||||||||
Here are the Smart Investing & Trading Scores of the most requested Financial stocks at 12Stocks.com (click stock name for detailed review):
|


| 12Stocks.com: Investing in Financial sector with Stocks | |
|
The following table helps investors and traders sort through current performance and trends (as measured by Smart Investing & Trading Score) of various
stocks in the Financial sector. Quick View: Move mouse or cursor over stock symbol (ticker) to view short-term Technical chart and over stock name to view long term chart. Click on  to add stock symbol to your watchlist and to add stock symbol to your watchlist and  to view watchlist. Click on any ticker or stock name for detailed market intelligence report for that stock. to view watchlist. Click on any ticker or stock name for detailed market intelligence report for that stock. |
12Stocks.com Performance of Stocks in Financial Sector
| Ticker | Stock Name | Watchlist | Category | Recent Price | Smart Investing & Trading Score | Change % | Weekly Change% |
| ONB | Old National |   | Regional Banks | 17.59 | 83 | 0.60% | 0.80% |
| MUE | BlackRock Muni | | Closed-End Fund - Debt | 10.06 | 77 | 0.60% | 0.80% |
| PFEB | Innovator S&P | | Exchange Traded Fund | 34.58 | 76 | 0.16% | 0.80% |
| FAX | Aberdeen Asia-Pacific | | Closed-End Fund - Debt | 2.59 | 25 | -1.15% | 0.78% |
| PML | PIMCO Municipal | | Closed-End Fund - Debt | 8.38 | 62 | 0.36% | 0.78% |
| BUYZ | Franklin Disruptive | | Exchange Traded Fund | 31.01 | 57 | 0.33% | 0.78% |
| BNS | Bank of Nova Scotia | | Banks | 48.39 | 70 | 0.29% | 0.77% |
| SBR | Sabine Royalty | | Investments | 64.10 | 90 | 0.68% | 0.77% |
| SPXX | Nuveen S&P | | Closed-End Fund - Equity | 15.78 | 76 | -0.25% | 0.77% |
| IGI | Western Asset | | Asset Mgmt | 17.01 | 58 | 0.03% | 0.77% |
| EOI | Eaton Vance | | Closed-End Fund - Equity | 18.40 | 61 | -0.54% | 0.76% |
| PCQ | PIMCO California | | Closed-End Fund - Debt | 9.41 | 43 | -0.11% | 0.75% |
| PMM | Putnam Managed | | Closed-End Fund - Debt | 6.05 | 67 | 0.33% | 0.75% |
| PMAY | Innovator S&P | | Exchange Traded Fund | 33.55 | 76 | 0.03% | 0.75% |
| ZTR | Virtus Total | | Closed-End Fund - Equity | 5.48 | 95 | 0.37% | 0.74% |
| MOFG | MidWestOne | | Regional - Southwest Banks | 21.87 | 74 | 1.72% | 0.74% |
| FJUN | FT Cboe | | Exchange Traded Fund | 47.81 | 78 | 0.06% | 0.74% |
| TDSB | Cabana Target | | Exchange Traded Fund | 22.06 | 83 | 0.03% | 0.74% |
| PUCK | Goal Acquisitions | | SPAC | 10.85 | 83 | 0.00% | 0.74% |
| CNA | CNA | | Insurance | 45.28 | 100 | 0.56% | 0.73% |
| HTD | John Hancock | | Closed-End Fund - Debt | 20.56 | 83 | 0.34% | 0.73% |
| NFJ | AllianzGI NFJ | | Closed-End Fund - Equity | 12.46 | 76 | -0.64% | 0.73% |
| CBFV | CB | | Regional Banks | 22.69 | 68 | -1.18% | 0.73% |
| SPG | Simon Property | | REIT - Retail | 148.79 | 58 | 0.09% | 0.72% |
| IRS | IRSA Inversiones | | Real Estatet | 11.19 | 90 | -0.44% | 0.72% |
| For chart view version of above stock list: Chart View ➞ 0 - 25 , 25 - 50 , 50 - 75 , 75 - 100 , 100 - 125 , 125 - 150 , 150 - 175 , 175 - 200 , 200 - 225 , 225 - 250 , 250 - 275 , 275 - 300 , 300 - 325 , 325 - 350 , 350 - 375 , 375 - 400 , 400 - 425 , 425 - 450 , 450 - 475 , 475 - 500 , 500 - 525 , 525 - 550 , 550 - 575 , 575 - 600 , 600 - 625 , 625 - 650 , 650 - 675 , 675 - 700 , 700 - 725 , 725 - 750 , 750 - 775 , 775 - 800 , 800 - 825 , 825 - 850 , 850 - 875 , 875 - 900 , 900 - 925 , 925 - 950 , 950 - 975 , 975 - 1000 , 1000 - 1025 , 1025 - 1050 , 1050 - 1075 , 1075 - 1100 , 1100 - 1125 , 1125 - 1150 , 1150 - 1175 , 1175 - 1200 , 1200 - 1225 | ||
 | Click To Change The Sort Order: By Market Cap or Company Size Performance: Year-to-date, Week and Day |  |
|
Get the most comprehensive stock market coverage daily at 12Stocks.com ➞ Best Stocks Today ➞ Best Stocks Weekly ➞ Best Stocks Year-to-Date ➞ Best Stocks Trends ➞  Best Stocks Today 12Stocks.com Best Nasdaq Stocks ➞ Best S&P 500 Stocks ➞ Best Tech Stocks ➞ Best Biotech Stocks ➞ |
| Detailed Overview of Financial Stocks |
| Financial Technical Overview, Leaders & Laggards, Top Financial ETF Funds & Detailed Financial Stocks List, Charts, Trends & More |
| Financial Sector: Technical Analysis, Trends & YTD Performance | |
| Financial sector is composed of stocks
from banks, brokers, insurance, REITs
and services subsectors. Financial sector, as represented by XLF, an exchange-traded fund [ETF] that holds basket of Financial stocks (e.g, Bank of America, Goldman Sachs) is up by 13.01% and is currently outperforming the overall market by 2.44% year-to-date. Below is a quick view of Technical charts and trends: |
|
 XLF Weekly Chart |
|
| Long Term Trend: Very Good | |
| Medium Term Trend: Very Good | |
 XLF Daily Chart |
|
| Short Term Trend: Very Good | |
| Overall Trend Score: 95 | |
| YTD Performance: 13.01% | |
| **Trend Scores & Views Are Only For Educational Purposes And Not For Investing | |
| 12Stocks.com: Top Performing Financial Sector Stocks | ||||||||||||||||||||||||||||||||||||||||||||||||
 The top performing Financial sector stocks year to date are
Now, more recently, over last week, the top performing Financial sector stocks on the move are


|
||||||||||||||||||||||||||||||||||||||||||||||||
| 12Stocks.com: Investing in Financial Sector using Exchange Traded Funds | |
|
The following table shows list of key exchange traded funds (ETF) that
help investors track Financial Index. For detailed view, check out our ETF Funds section of our website. Quick View: Move mouse or cursor over ETF symbol (ticker) to view short-term Technical chart and over ETF name to view long term chart. Click on ticker or stock name for detailed view. Click on to add stock symbol to your watchlist and to view watchlist. |
12Stocks.com List of ETFs that track Financial Index
| Ticker | ETF Name | Watchlist | Recent Price | Smart Investing & Trading Score | Change % | Week % | Year-to-date % |
| XLF | Financial | | 42.49 | 95 | 0.73 | 1.58 | 13.01% |
| IAI | Broker-Dealers & Secs | | 119.47 | 100 | 1.08 | 2.59 | 10.08% |
| IYF | Financials | | 96.85 | 95 | 0.43 | 1.73 | 13.39% |
| IYG | Financial Services | | 67.11 | 95 | 0.15 | 1.56 | 12.34% |
| KRE | Regional Banking | | 51.19 | 83 | 0.23 | 1.67 | -2.37% |
| IXG | Global Financials | | 88.72 | 88 | 0.21 | 1.41 | 12.91% |
| VFH | Financials | | 103.00 | 95 | 0.18 | 1.45 | 11.64% |
| KBE | Bank | | 47.93 | 83 | 0.44 | 1.25 | 4.15% |
| FAS | Financial Bull 3X | | 112.32 | 95 | 1.81 | 4.06 | 35.9% |
| FAZ | Financial Bear 3X | | 9.75 | 10 | -1.71 | -3.75 | -28.68% |
| UYG | Financials | | 68.54 | 100 | 1.23 | 2.77 | 24.17% |
| IAT | Regional Banks | | 43.42 | 76 | -0.26 | 1.02 | 3.78% |
| KIE | Insurance | | 51.83 | 100 | 0.88 | 1.09 | 14.62% |
| PSCF | SmallCap Financials | | 49.03 | 95 | 0.28 | 1.44 | -0.31% |
| EUFN | Europe Financials | | 24.13 | 95 | 0.67 | 2.51 | 15.12% |
| PGF | Financial Preferred | | 14.81 | 52 | -0.10 | 0.68 | 1.58% |
| 12Stocks.com: Charts, Trends, Fundamental Data and Performances of Financial Stocks | |
|
We now take in-depth look at all Financial stocks including charts, multi-period performances and overall trends (as measured by Smart Investing & Trading Score). One can sort Financial stocks (click link to choose) by Daily, Weekly and by Year-to-Date performances. Also, one can sort by size of the company or by market capitalization. |
| Select Your Default Chart Type: | |||||
| |||||
| Click on stock symbol or name for detailed view. Click on to add stock symbol to your watchlist and to view watchlist. Quick View: Move mouse or cursor over "Daily" to quickly view daily Technical stock chart and over "Weekly" to view weekly Technical stock chart. | |||||

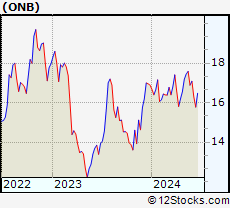 | ONB Old National Bancorp |
| Sector: Financials | |
| SubSector: Regional - Midwest Banks | |
| MarketCap: 2340.8 Millions | |
| Recent Price: 17.59 Smart Investing & Trading Score: 83 | |
| Day Percent Change: 0.60% Day Change: 0.11 | |
| Week Change: 0.8% Year-to-date Change: 4.1% | |
| ONB Links: Profile News Message Board | |
| Charts:- Daily , Weekly | |
| Add ONB to Watchlist: View: Get Complete ONB Trend Analysis ➞ | |
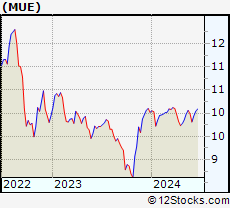 | MUE BlackRock MuniHoldings Quality Fund II, Inc. |
| Sector: Financials | |
| SubSector: Closed-End Fund - Debt | |
| MarketCap: 240.007 Millions | |
| Recent Price: 10.06 Smart Investing & Trading Score: 77 | |
| Day Percent Change: 0.60% Day Change: 0.06 | |
| Week Change: 0.8% Year-to-date Change: 0.4% | |
| MUE Links: Profile News Message Board | |
| Charts:- Daily , Weekly | |
| Add MUE to Watchlist: View: Get Complete MUE Trend Analysis ➞ | |
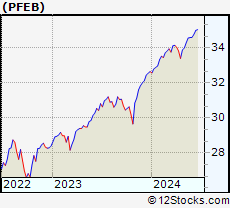 | PFEB Innovator S&P 500 Power Buffer ETF February |
| Sector: Financials | |
| SubSector: Exchange Traded Fund | |
| MarketCap: 60157 Millions | |
| Recent Price: 34.58 Smart Investing & Trading Score: 76 | |
| Day Percent Change: 0.16% Day Change: 0.05 | |
| Week Change: 0.8% Year-to-date Change: 5.9% | |
| PFEB Links: Profile News Message Board | |
| Charts:- Daily , Weekly | |
| Add PFEB to Watchlist: View: Get Complete PFEB Trend Analysis ➞ | |
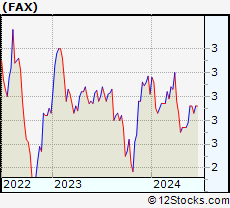 | FAX Aberdeen Asia-Pacific Income Fund, Inc. |
| Sector: Financials | |
| SubSector: Closed-End Fund - Debt | |
| MarketCap: 807.407 Millions | |
| Recent Price: 2.59 Smart Investing & Trading Score: 25 | |
| Day Percent Change: -1.15% Day Change: -0.03 | |
| Week Change: 0.78% Year-to-date Change: -4.4% | |
| FAX Links: Profile News Message Board | |
| Charts:- Daily , Weekly | |
| Add FAX to Watchlist: View: Get Complete FAX Trend Analysis ➞ | |
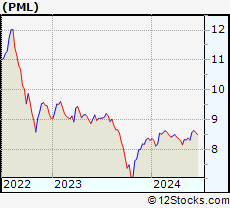 | PML PIMCO Municipal Income Fund II |
| Sector: Financials | |
| SubSector: Closed-End Fund - Debt | |
| MarketCap: 688.207 Millions | |
| Recent Price: 8.38 Smart Investing & Trading Score: 62 | |
| Day Percent Change: 0.36% Day Change: 0.03 | |
| Week Change: 0.78% Year-to-date Change: 1.0% | |
| PML Links: Profile News Message Board | |
| Charts:- Daily , Weekly | |
| Add PML to Watchlist: View: Get Complete PML Trend Analysis ➞ | |
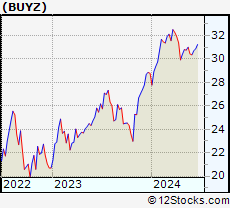 | BUYZ Franklin Disruptive Commerce ETF |
| Sector: Financials | |
| SubSector: Exchange Traded Fund | |
| MarketCap: 60157 Millions | |
| Recent Price: 31.01 Smart Investing & Trading Score: 57 | |
| Day Percent Change: 0.33% Day Change: 0.10 | |
| Week Change: 0.78% Year-to-date Change: 7.7% | |
| BUYZ Links: Profile News Message Board | |
| Charts:- Daily , Weekly | |
| Add BUYZ to Watchlist: View: Get Complete BUYZ Trend Analysis ➞ | |
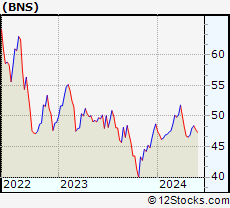 | BNS The Bank of Nova Scotia |
| Sector: Financials | |
| SubSector: Money Center Banks | |
| MarketCap: 48742.1 Millions | |
| Recent Price: 48.39 Smart Investing & Trading Score: 70 | |
| Day Percent Change: 0.29% Day Change: 0.14 | |
| Week Change: 0.77% Year-to-date Change: -0.6% | |
| BNS Links: Profile News Message Board | |
| Charts:- Daily , Weekly | |
| Add BNS to Watchlist: View: Get Complete BNS Trend Analysis ➞ | |
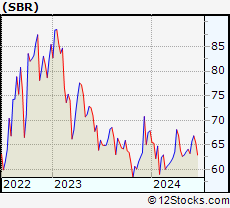 | SBR Sabine Royalty Trust |
| Sector: Financials | |
| SubSector: Diversified Investments | |
| MarketCap: 381.27 Millions | |
| Recent Price: 64.10 Smart Investing & Trading Score: 90 | |
| Day Percent Change: 0.68% Day Change: 0.43 | |
| Week Change: 0.77% Year-to-date Change: -5.5% | |
| SBR Links: Profile News Message Board | |
| Charts:- Daily , Weekly | |
| Add SBR to Watchlist: View: Get Complete SBR Trend Analysis ➞ | |
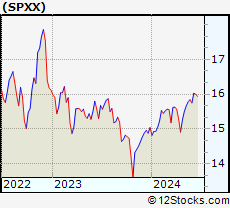 | SPXX Nuveen S&P 500 Dynamic Overwrite Fund |
| Sector: Financials | |
| SubSector: Closed-End Fund - Equity | |
| MarketCap: 167.747 Millions | |
| Recent Price: 15.78 Smart Investing & Trading Score: 76 | |
| Day Percent Change: -0.25% Day Change: -0.04 | |
| Week Change: 0.77% Year-to-date Change: 4.9% | |
| SPXX Links: Profile News Message Board | |
| Charts:- Daily , Weekly | |
| Add SPXX to Watchlist: View: Get Complete SPXX Trend Analysis ➞ | |
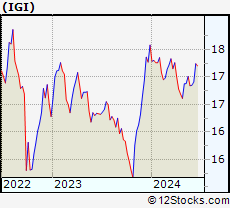 | IGI Western Asset Investment Grade Defined Opportunity Trust Inc. |
| Sector: Financials | |
| SubSector: Asset Management | |
| MarketCap: 176.503 Millions | |
| Recent Price: 17.01 Smart Investing & Trading Score: 58 | |
| Day Percent Change: 0.03% Day Change: 0.01 | |
| Week Change: 0.77% Year-to-date Change: -3.2% | |
| IGI Links: Profile News Message Board | |
| Charts:- Daily , Weekly | |
| Add IGI to Watchlist: View: Get Complete IGI Trend Analysis ➞ | |
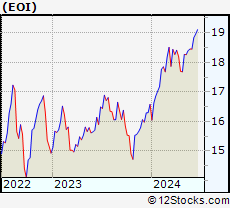 | EOI Eaton Vance Enhanced Equity Income Fund |
| Sector: Financials | |
| SubSector: Closed-End Fund - Equity | |
| MarketCap: 406.247 Millions | |
| Recent Price: 18.40 Smart Investing & Trading Score: 61 | |
| Day Percent Change: -0.54% Day Change: -0.10 | |
| Week Change: 0.76% Year-to-date Change: 11.0% | |
| EOI Links: Profile News Message Board | |
| Charts:- Daily , Weekly | |
| Add EOI to Watchlist: View: Get Complete EOI Trend Analysis ➞ | |
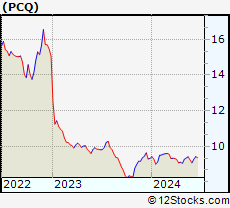 | PCQ PIMCO California Municipal Income Fund |
| Sector: Financials | |
| SubSector: Closed-End Fund - Debt | |
| MarketCap: 263.007 Millions | |
| Recent Price: 9.41 Smart Investing & Trading Score: 43 | |
| Day Percent Change: -0.11% Day Change: -0.01 | |
| Week Change: 0.75% Year-to-date Change: 1.0% | |
| PCQ Links: Profile News Message Board | |
| Charts:- Daily , Weekly | |
| Add PCQ to Watchlist: View: Get Complete PCQ Trend Analysis ➞ | |
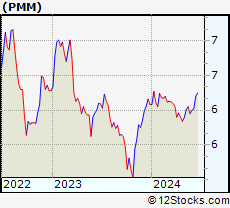 | PMM Putnam Managed Municipal Income Trust |
| Sector: Financials | |
| SubSector: Closed-End Fund - Debt | |
| MarketCap: 315.907 Millions | |
| Recent Price: 6.05 Smart Investing & Trading Score: 67 | |
| Day Percent Change: 0.33% Day Change: 0.02 | |
| Week Change: 0.75% Year-to-date Change: -0.5% | |
| PMM Links: Profile News Message Board | |
| Charts:- Daily , Weekly | |
| Add PMM to Watchlist: View: Get Complete PMM Trend Analysis ➞ | |
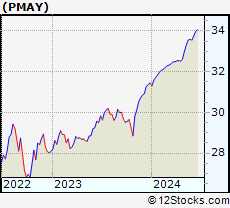 | PMAY Innovator S&P 500 Power Buffer ETF May |
| Sector: Financials | |
| SubSector: Exchange Traded Fund | |
| MarketCap: 60157 Millions | |
| Recent Price: 33.55 Smart Investing & Trading Score: 76 | |
| Day Percent Change: 0.03% Day Change: 0.01 | |
| Week Change: 0.75% Year-to-date Change: 6.7% | |
| PMAY Links: Profile News Message Board | |
| Charts:- Daily , Weekly | |
| Add PMAY to Watchlist: View: Get Complete PMAY Trend Analysis ➞ | |
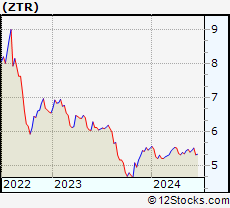 | ZTR Virtus Total Return Fund Inc. |
| Sector: Financials | |
| SubSector: Closed-End Fund - Equity | |
| MarketCap: 140.947 Millions | |
| Recent Price: 5.48 Smart Investing & Trading Score: 95 | |
| Day Percent Change: 0.37% Day Change: 0.02 | |
| Week Change: 0.74% Year-to-date Change: -0.5% | |
| ZTR Links: Profile News Message Board | |
| Charts:- Daily , Weekly | |
| Add ZTR to Watchlist: View: Get Complete ZTR Trend Analysis ➞ | |
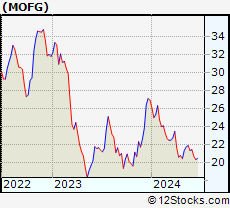 | MOFG MidWestOne Financial Group, Inc. |
| Sector: Financials | |
| SubSector: Regional - Southwest Banks | |
| MarketCap: 345.265 Millions | |
| Recent Price: 21.87 Smart Investing & Trading Score: 74 | |
| Day Percent Change: 1.72% Day Change: 0.37 | |
| Week Change: 0.74% Year-to-date Change: -18.7% | |
| MOFG Links: Profile News Message Board | |
| Charts:- Daily , Weekly | |
| Add MOFG to Watchlist: View: Get Complete MOFG Trend Analysis ➞ | |
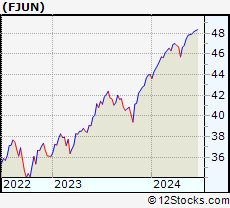 | FJUN FT Cboe Vest US Eq Buffer ETF June |
| Sector: Financials | |
| SubSector: Exchange Traded Fund | |
| MarketCap: 60157 Millions | |
| Recent Price: 47.81 Smart Investing & Trading Score: 78 | |
| Day Percent Change: 0.06% Day Change: 0.03 | |
| Week Change: 0.74% Year-to-date Change: 8.6% | |
| FJUN Links: Profile News Message Board | |
| Charts:- Daily , Weekly | |
| Add FJUN to Watchlist: View: Get Complete FJUN Trend Analysis ➞ | |
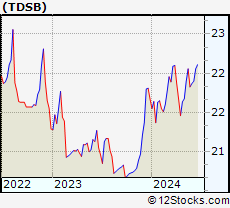 | TDSB Cabana Target Drawdown 7 ETF |
| Sector: Financials | |
| SubSector: Exchange Traded Fund | |
| MarketCap: 60157 Millions | |
| Recent Price: 22.06 Smart Investing & Trading Score: 83 | |
| Day Percent Change: 0.03% Day Change: 0.01 | |
| Week Change: 0.74% Year-to-date Change: 1.8% | |
| TDSB Links: Profile News Message Board | |
| Charts:- Daily , Weekly | |
| Add TDSB to Watchlist: View: Get Complete TDSB Trend Analysis ➞ | |
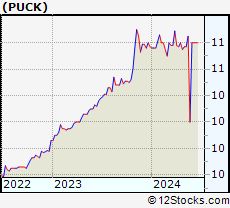 | PUCK Goal Acquisitions Corp. |
| Sector: Financials | |
| SubSector: SPAC | |
| MarketCap: 175 Millions | |
| Recent Price: 10.85 Smart Investing & Trading Score: 83 | |
| Day Percent Change: 0.00% Day Change: 0.00 | |
| Week Change: 0.74% Year-to-date Change: 0.7% | |
| PUCK Links: Profile News Message Board | |
| Charts:- Daily , Weekly | |
| Add PUCK to Watchlist: View: Get Complete PUCK Trend Analysis ➞ | |
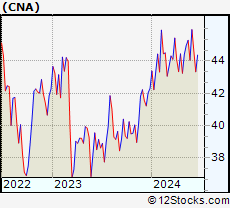 | CNA CNA Financial Corporation |
| Sector: Financials | |
| SubSector: Property & Casualty Insurance | |
| MarketCap: 9123.32 Millions | |
| Recent Price: 45.28 Smart Investing & Trading Score: 100 | |
| Day Percent Change: 0.56% Day Change: 0.25 | |
| Week Change: 0.73% Year-to-date Change: 7.0% | |
| CNA Links: Profile News Message Board | |
| Charts:- Daily , Weekly | |
| Add CNA to Watchlist: View: Get Complete CNA Trend Analysis ➞ | |
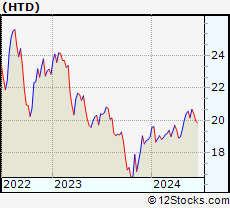 | HTD John Hancock Tax-Advantaged Dividend Income Fund |
| Sector: Financials | |
| SubSector: Closed-End Fund - Debt | |
| MarketCap: 467.107 Millions | |
| Recent Price: 20.56 Smart Investing & Trading Score: 83 | |
| Day Percent Change: 0.34% Day Change: 0.07 | |
| Week Change: 0.73% Year-to-date Change: 8.4% | |
| HTD Links: Profile News Message Board | |
| Charts:- Daily , Weekly | |
| Add HTD to Watchlist: View: Get Complete HTD Trend Analysis ➞ | |
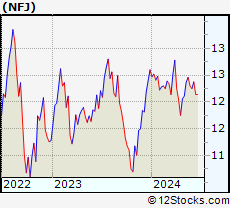 | NFJ AllianzGI NFJ Dividend, Interest & Premium Strategy Fund |
| Sector: Financials | |
| SubSector: Closed-End Fund - Equity | |
| MarketCap: 783.047 Millions | |
| Recent Price: 12.46 Smart Investing & Trading Score: 76 | |
| Day Percent Change: -0.64% Day Change: -0.08 | |
| Week Change: 0.73% Year-to-date Change: -1.1% | |
| NFJ Links: Profile News Message Board | |
| Charts:- Daily , Weekly | |
| Add NFJ to Watchlist: View: Get Complete NFJ Trend Analysis ➞ | |
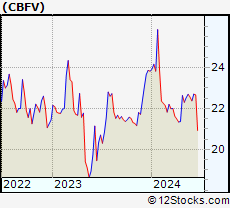 | CBFV CB Financial Services, Inc. |
| Sector: Financials | |
| SubSector: Regional - Northeast Banks | |
| MarketCap: 108.199 Millions | |
| Recent Price: 22.69 Smart Investing & Trading Score: 68 | |
| Day Percent Change: -1.18% Day Change: -0.27 | |
| Week Change: 0.73% Year-to-date Change: -4.7% | |
| CBFV Links: Profile News Message Board | |
| Charts:- Daily , Weekly | |
| Add CBFV to Watchlist: View: Get Complete CBFV Trend Analysis ➞ | |
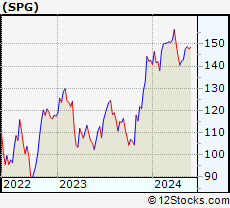 | SPG Simon Property Group, Inc. |
| Sector: Financials | |
| SubSector: REIT - Retail | |
| MarketCap: 17959.6 Millions | |
| Recent Price: 148.79 Smart Investing & Trading Score: 58 | |
| Day Percent Change: 0.09% Day Change: 0.13 | |
| Week Change: 0.72% Year-to-date Change: 4.3% | |
| SPG Links: Profile News Message Board | |
| Charts:- Daily , Weekly | |
| Add SPG to Watchlist: View: Get Complete SPG Trend Analysis ➞ | |
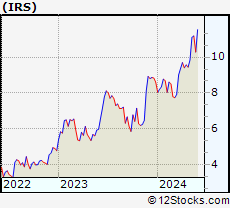 | IRS IRSA Inversiones y Representaciones Sociedad Anonima |
| Sector: Financials | |
| SubSector: Real Estate Development | |
| MarketCap: 257.519 Millions | |
| Recent Price: 11.19 Smart Investing & Trading Score: 90 | |
| Day Percent Change: -0.44% Day Change: -0.05 | |
| Week Change: 0.72% Year-to-date Change: 30.1% | |
| IRS Links: Profile News Message Board | |
| Charts:- Daily , Weekly | |
| Add IRS to Watchlist: View: Get Complete IRS Trend Analysis ➞ | |
| For tabular summary view of above stock list: Summary View ➞ 0 - 25 , 25 - 50 , 50 - 75 , 75 - 100 , 100 - 125 , 125 - 150 , 150 - 175 , 175 - 200 , 200 - 225 , 225 - 250 , 250 - 275 , 275 - 300 , 300 - 325 , 325 - 350 , 350 - 375 , 375 - 400 , 400 - 425 , 425 - 450 , 450 - 475 , 475 - 500 , 500 - 525 , 525 - 550 , 550 - 575 , 575 - 600 , 600 - 625 , 625 - 650 , 650 - 675 , 675 - 700 , 700 - 725 , 725 - 750 , 750 - 775 , 775 - 800 , 800 - 825 , 825 - 850 , 850 - 875 , 875 - 900 , 900 - 925 , 925 - 950 , 950 - 975 , 975 - 1000 , 1000 - 1025 , 1025 - 1050 , 1050 - 1075 , 1075 - 1100 , 1100 - 1125 , 1125 - 1150 , 1150 - 1175 , 1175 - 1200 , 1200 - 1225 | ||
| Click To Change The Sort Order: By Market Cap or Company Size Performance: Year-to-date, Week and Day | |
| Select Chart Type: | ||
|
Best Stocks Today 12Stocks.com |
© 2024 12Stocks.com Terms & Conditions Privacy Contact Us
All Information Provided Only For Education And Not To Be Used For Investing or Trading. See Terms & Conditions


One More Thing ... Get Best Stocks Delivered Daily!
Never Ever Miss A Move With Our Top Ten Stocks Lists
Find Best Stocks In Any Market - Bull or Bear Market
Take A Peek At Our Top Ten Stocks Lists: Daily, Weekly, Year-to-Date & Top Trends
Find Best Stocks In Any Market - Bull or Bear Market
Take A Peek At Our Top Ten Stocks Lists: Daily, Weekly, Year-to-Date & Top Trends
Financial Stocks With Best Up Trends [0-bearish to 100-bullish]: Fangdd Network[100], Xinyuan Real[100], MicroSectors Gold[100], Sprott Physical[100], Citizens & Northern[100], Sumitomo Mitsui[100], First Community[100], Chubb [100], Angel Oak[100], Sprott Physical[100], Iris Energy[100]
Best Financial Stocks Year-to-Date:
Root [526.36%], Fangdd Network[149.63%], Banco Macro[126.41%], Grupo Financiero[112.4%], Banco BBVA[110.66%], SelectQuote [110.22%], Gladstone Capital[106.92%], EverQuote [98.2%], Hippo [92.54%], Grupo Supervielle[86.95%], Vista Oil[60.93%] Best Financial Stocks This Week:
Fangdd Network[360.27%], Xinyuan Real[53.28%], Iris Energy[25.68%], Fathom [25.35%], Huize Holding[21.83%], First Foundation[18.98%], Trupanion [17.21%], Bridge [16.67%], MicroSectors Gold[15.19%], KE [13.86%], Douglas Elliman[13.56%] Best Financial Stocks Daily:
Fangdd Network[321.26%], Xinyuan Real[39.49%], MicroSectors Gold[12.02%], Fathom [9.88%], Citizens [8.53%], Hywin [8.28%], Root [6.10%], First Foundation[6.09%], Sprott Physical[6.09%], Freedom Holding[5.02%], NexGen Energy[4.99%]