
 Login Sign Up


| |||||
 |  | ||||

| 12Stocks.com Market Intelligence |
Best Financial Stocks
| In a hurry? Financial Stocks Lists: Performance Trends Table, Stock Charts
Sort Financial stocks: Daily, Weekly, Year-to-Date, Market Cap & Trends. Filter Financial stocks list by size:All Financial Large Mid-Range Small & MicroCap |
| 12Stocks.com Financial Stocks Performances & Trends Daily | |||||||||
|
|  The overall Smart Investing & Trading Score is 78 (0-bearish to 100-bullish) which puts Financial sector in short term neutral to bullish trend. The Smart Investing & Trading Score from previous trading session is 46 and hence an improvement of trend.
| ||||||||
Here are the Smart Investing & Trading Scores of the most requested Financial stocks at 12Stocks.com (click stock name for detailed review):
|


| 12Stocks.com: Investing in Financial sector with Stocks | |
|
The following table helps investors and traders sort through current performance and trends (as measured by Smart Investing & Trading Score) of various
stocks in the Financial sector. Quick View: Move mouse or cursor over stock symbol (ticker) to view short-term Technical chart and over stock name to view long term chart. Click on  to add stock symbol to your watchlist and to add stock symbol to your watchlist and  to view watchlist. Click on any ticker or stock name for detailed market intelligence report for that stock. to view watchlist. Click on any ticker or stock name for detailed market intelligence report for that stock. |
12Stocks.com Performance of Stocks in Financial Sector
| Ticker | Stock Name | Watchlist | Category | Recent Price | Smart Investing & Trading Score | Change % | Weekly Change% |
| EQBK | Equity Bancshares |   | Regional Banks | 33.70 | 56 | 0.99% | -0.44% |
| CHW | Calamos Global | | Closed-End Fund - Equity | 6.66 | 44 | 0.00% | -0.45% |
| DFS | Discover | | Credit Services | 122.66 | 56 | 1.28% | -0.45% |
| CBLS | Changebridge Capital | | Exchange Traded Fund | 25.31 | 56 | -0.90% | -0.45% |
| STLG | iShares Factors | | Exchange Traded Fund | 48.84 | 61 | 0.14% | -0.45% |
| BWBBP | Bridgewater Bancshares | | Banks - Regional | 17.75 | 10 | 0.28% | -0.45% |
| BGT | BlackRock Floating | | Closed-End Fund - Debt | 13.00 | 51 | 0.62% | -0.46% |
| BKLC | BNY | | Exchange Traded Fund | 100.06 | 71 | 0.66% | -0.46% |
| BFZ | BlackRock California | | Closed-End Fund - Debt | 11.55 | 18 | 0.35% | -0.47% |
| NCA | Nuveen California | | Closed-End Fund - Debt | 8.48 | 17 | 0.71% | -0.47% |
| FMBH | First Mid | | Regional Banks | 31.74 | 63 | 0.44% | -0.47% |
| WFC | Wells Fargo | | Banks | 59.92 | 56 | 1.20% | -0.48% |
| CET | Central Securities | | Asset Mgmt | 42.95 | 83 | 0.37% | -0.48% |
| IBTX | Independent Bank | | Regional Banks | 46.04 | 68 | 0.13% | -0.48% |
| ETW | Eaton Vance | | Closed-End Fund - Foreign | 8.10 | 58 | 0.75% | -0.49% |
| LEO | BNY | | Closed-End Fund - Debt | 5.93 | 35 | 0.34% | -0.50% |
| PMO | Putnam Municipal | | Closed-End Fund - Debt | 9.96 | 52 | 0.61% | -0.50% |
| ECF | Ellsworth Growth | | Asset Mgmt | 8.09 | 65 | 0.75% | -0.50% |
| LANDO | Gladstone Land | | REIT Industrial | 19.75 | 42 | -1.79% | -0.50% |
| GHY | PGIM Global | | Closed-End Fund - Debt | 11.81 | 88 | 0.94% | -0.51% |
| ACGLN | Arch Capital | | Insurance - | 19.54 | 40 | 0.21% | -0.51% |
| KSM | DWS Strategic | | Closed-End Fund - Debt | 9.49 | 61 | 0.00% | -0.52% |
| AGNC | AGNC | | Mortgage | 9.59 | 48 | 0.00% | -0.52% |
| FRA | BlackRock Floating | | Closed-End Fund - Debt | 13.06 | 51 | 0.62% | -0.53% |
| FAM | First Trust/Aberdeen | | Closed-End Fund - Debt | 6.49 | 76 | 1.72% | -0.54% |
| For chart view version of above stock list: Chart View ➞ 0 - 25 , 25 - 50 , 50 - 75 , 75 - 100 , 100 - 125 , 125 - 150 , 150 - 175 , 175 - 200 , 200 - 225 , 225 - 250 , 250 - 275 , 275 - 300 , 300 - 325 , 325 - 350 , 350 - 375 , 375 - 400 , 400 - 425 , 425 - 450 , 450 - 475 , 475 - 500 , 500 - 525 , 525 - 550 , 550 - 575 , 575 - 600 , 600 - 625 , 625 - 650 , 650 - 675 , 675 - 700 , 700 - 725 , 725 - 750 , 750 - 775 , 775 - 800 , 800 - 825 , 825 - 850 , 850 - 875 , 875 - 900 , 900 - 925 , 925 - 950 , 950 - 975 , 975 - 1000 , 1000 - 1025 , 1025 - 1050 , 1050 - 1075 , 1075 - 1100 , 1100 - 1125 , 1125 - 1150 , 1150 - 1175 , 1175 - 1200 , 1200 - 1225 | ||
 | Click To Change The Sort Order: By Market Cap or Company Size Performance: Year-to-date, Week and Day |  |
|
Get the most comprehensive stock market coverage daily at 12Stocks.com ➞ Best Stocks Today ➞ Best Stocks Weekly ➞ Best Stocks Year-to-Date ➞ Best Stocks Trends ➞  Best Stocks Today 12Stocks.com Best Nasdaq Stocks ➞ Best S&P 500 Stocks ➞ Best Tech Stocks ➞ Best Biotech Stocks ➞ |
| Detailed Overview of Financial Stocks |
| Financial Technical Overview, Leaders & Laggards, Top Financial ETF Funds & Detailed Financial Stocks List, Charts, Trends & More |
| Financial Sector: Technical Analysis, Trends & YTD Performance | |
| Financial sector is composed of stocks
from banks, brokers, insurance, REITs
and services subsectors. Financial sector, as represented by XLF, an exchange-traded fund [ETF] that holds basket of Financial stocks (e.g, Bank of America, Goldman Sachs) is up by 10.74% and is currently outperforming the overall market by 0.95% year-to-date. Below is a quick view of Technical charts and trends: |
|
 XLF Weekly Chart |
|
| Long Term Trend: Very Good | |
| Medium Term Trend: Good | |
 XLF Daily Chart |
|
| Short Term Trend: Very Good | |
| Overall Trend Score: 78 | |
| YTD Performance: 10.74% | |
| **Trend Scores & Views Are Only For Educational Purposes And Not For Investing | |
| 12Stocks.com: Top Performing Financial Sector Stocks | ||||||||||||||||||||||||||||||||||||||||||||||||
 The top performing Financial sector stocks year to date are
Now, more recently, over last week, the top performing Financial sector stocks on the move are


|
||||||||||||||||||||||||||||||||||||||||||||||||
| 12Stocks.com: Investing in Financial Sector using Exchange Traded Funds | |
|
The following table shows list of key exchange traded funds (ETF) that
help investors track Financial Index. For detailed view, check out our ETF Funds section of our website. Quick View: Move mouse or cursor over ETF symbol (ticker) to view short-term Technical chart and over ETF name to view long term chart. Click on ticker or stock name for detailed view. Click on to add stock symbol to your watchlist and to view watchlist. |
12Stocks.com List of ETFs that track Financial Index
| Ticker | ETF Name | Watchlist | Recent Price | Smart Investing & Trading Score | Change % | Week % | Year-to-date % |
| XLF | Financial | | 41.64 | 78 | 1.46 | 0.07 | 10.74% |
| IAI | Broker-Dealers & Secs | | 116.64 | 58 | 0.53 | -1.91 | 7.47% |
| IYF | Financials | | 95.25 | 78 | 1.32 | 0.03 | 11.52% |
| IYG | Financial Services | | 65.74 | 71 | 1.14 | -0.33 | 10.05% |
| KRE | Regional Banking | | 48.85 | 61 | 1.41 | -0.14 | -6.83% |
| IXG | Global Financials | | 87.05 | 76 | 0.80 | -0.54 | 10.77% |
| VFH | Financials | | 101.01 | 78 | 1.28 | -0.12 | 9.48% |
| KBE | Bank | | 46.23 | 68 | 1.34 | 0 | 0.46% |
| FAS | Financial Bull 3X | | 105.34 | 78 | 4.16 | -0.02 | 27.45% |
| FAZ | Financial Bear 3X | | 10.35 | 17 | -4.08 | -0.1 | -24.29% |
| UYG | Financials | | 65.65 | 78 | 3.19 | -0.03 | 18.93% |
| IAT | Regional Banks | | 41.90 | 68 | 1.87 | 0 | 0.14% |
| KIE | Insurance | | 51.16 | 78 | 1.11 | 0.69 | 13.14% |
| PSCF | SmallCap Financials | | 47.14 | 53 | 1.59 | -0.79 | -4.14% |
| EUFN | Europe Financials | | 24.18 | 100 | 1.02 | 0.71 | 15.36% |
| PGF | Financial Preferred | | 14.79 | 55 | 1.09 | 0.68 | 1.44% |
| 12Stocks.com: Charts, Trends, Fundamental Data and Performances of Financial Stocks | |
|
We now take in-depth look at all Financial stocks including charts, multi-period performances and overall trends (as measured by Smart Investing & Trading Score). One can sort Financial stocks (click link to choose) by Daily, Weekly and by Year-to-Date performances. Also, one can sort by size of the company or by market capitalization. |
| Select Your Default Chart Type: | |||||
| |||||
| Click on stock symbol or name for detailed view. Click on to add stock symbol to your watchlist and to view watchlist. Quick View: Move mouse or cursor over "Daily" to quickly view daily Technical stock chart and over "Weekly" to view weekly Technical stock chart. | |||||

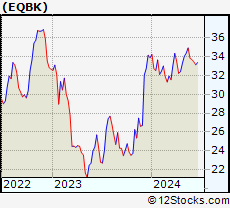 | EQBK Equity Bancshares, Inc. |
| Sector: Financials | |
| SubSector: Regional - Midwest Banks | |
| MarketCap: 272.87 Millions | |
| Recent Price: 33.70 Smart Investing & Trading Score: 56 | |
| Day Percent Change: 0.99% Day Change: 0.33 | |
| Week Change: -0.44% Year-to-date Change: -0.6% | |
| EQBK Links: Profile News Message Board | |
| Charts:- Daily , Weekly | |
| Add EQBK to Watchlist: View: Get Complete EQBK Trend Analysis ➞ | |
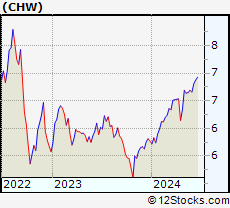 | CHW Calamos Global Dynamic Income Fund |
| Sector: Financials | |
| SubSector: Closed-End Fund - Equity | |
| MarketCap: 272.047 Millions | |
| Recent Price: 6.66 Smart Investing & Trading Score: 44 | |
| Day Percent Change: 0.00% Day Change: 0.00 | |
| Week Change: -0.45% Year-to-date Change: 15.4% | |
| CHW Links: Profile News Message Board | |
| Charts:- Daily , Weekly | |
| Add CHW to Watchlist: View: Get Complete CHW Trend Analysis ➞ | |
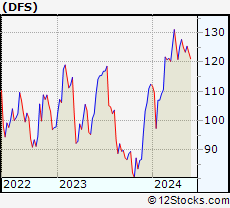 | DFS Discover Financial Services |
| Sector: Financials | |
| SubSector: Credit Services | |
| MarketCap: 9228.88 Millions | |
| Recent Price: 122.66 Smart Investing & Trading Score: 56 | |
| Day Percent Change: 1.28% Day Change: 1.55 | |
| Week Change: -0.45% Year-to-date Change: 9.1% | |
| DFS Links: Profile News Message Board | |
| Charts:- Daily , Weekly | |
| Add DFS to Watchlist: View: Get Complete DFS Trend Analysis ➞ | |
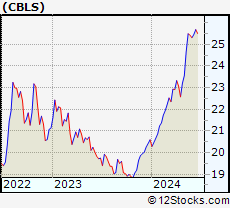 | CBLS Changebridge Capital Long/Short Equity ETF |
| Sector: Financials | |
| SubSector: Exchange Traded Fund | |
| MarketCap: 60157 Millions | |
| Recent Price: 25.31 Smart Investing & Trading Score: 56 | |
| Day Percent Change: -0.90% Day Change: -0.23 | |
| Week Change: -0.45% Year-to-date Change: 22.9% | |
| CBLS Links: Profile News Message Board | |
| Charts:- Daily , Weekly | |
| Add CBLS to Watchlist: View: Get Complete CBLS Trend Analysis ➞ | |
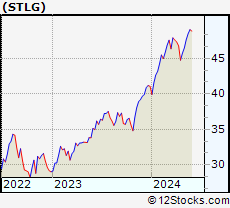 | STLG iShares Factors US Growth Style ETF |
| Sector: Financials | |
| SubSector: Exchange Traded Fund | |
| MarketCap: 60157 Millions | |
| Recent Price: 48.84 Smart Investing & Trading Score: 61 | |
| Day Percent Change: 0.14% Day Change: 0.07 | |
| Week Change: -0.45% Year-to-date Change: 18.9% | |
| STLG Links: Profile News Message Board | |
| Charts:- Daily , Weekly | |
| Add STLG to Watchlist: View: Get Complete STLG Trend Analysis ➞ | |
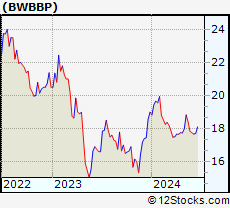 | BWBBP Bridgewater Bancshares, Inc. |
| Sector: Financials | |
| SubSector: Banks - Regional | |
| MarketCap: 285 Millions | |
| Recent Price: 17.75 Smart Investing & Trading Score: 10 | |
| Day Percent Change: 0.28% Day Change: 0.05 | |
| Week Change: -0.45% Year-to-date Change: -6.6% | |
| BWBBP Links: Profile News Message Board | |
| Charts:- Daily , Weekly | |
| Add BWBBP to Watchlist: View: Get Complete BWBBP Trend Analysis ➞ | |
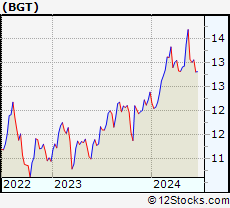 | BGT BlackRock Floating Rate Income Trust |
| Sector: Financials | |
| SubSector: Closed-End Fund - Debt | |
| MarketCap: 192.607 Millions | |
| Recent Price: 13.00 Smart Investing & Trading Score: 51 | |
| Day Percent Change: 0.62% Day Change: 0.08 | |
| Week Change: -0.46% Year-to-date Change: 5.0% | |
| BGT Links: Profile News Message Board | |
| Charts:- Daily , Weekly | |
| Add BGT to Watchlist: View: Get Complete BGT Trend Analysis ➞ | |
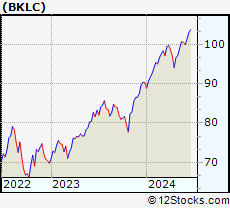 | BKLC BNY Mellon US Large Cap Core Equity ETF |
| Sector: Financials | |
| SubSector: Exchange Traded Fund | |
| MarketCap: 60157 Millions | |
| Recent Price: 100.06 Smart Investing & Trading Score: 71 | |
| Day Percent Change: 0.66% Day Change: 0.66 | |
| Week Change: -0.46% Year-to-date Change: 10.7% | |
| BKLC Links: Profile News Message Board | |
| Charts:- Daily , Weekly | |
| Add BKLC to Watchlist: View: Get Complete BKLC Trend Analysis ➞ | |
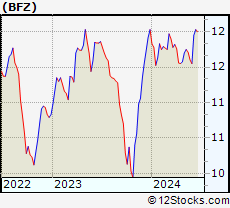 | BFZ BlackRock California Municipal Income Trust |
| Sector: Financials | |
| SubSector: Closed-End Fund - Debt | |
| MarketCap: 352.207 Millions | |
| Recent Price: 11.55 Smart Investing & Trading Score: 18 | |
| Day Percent Change: 0.35% Day Change: 0.04 | |
| Week Change: -0.47% Year-to-date Change: -4.0% | |
| BFZ Links: Profile News Message Board | |
| Charts:- Daily , Weekly | |
| Add BFZ to Watchlist: View: Get Complete BFZ Trend Analysis ➞ | |
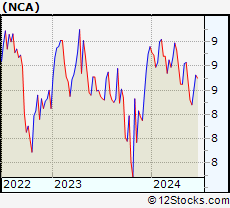 | NCA Nuveen California Municipal Value Fund, Inc. |
| Sector: Financials | |
| SubSector: Closed-End Fund - Debt | |
| MarketCap: 256.107 Millions | |
| Recent Price: 8.48 Smart Investing & Trading Score: 17 | |
| Day Percent Change: 0.71% Day Change: 0.06 | |
| Week Change: -0.47% Year-to-date Change: -5.4% | |
| NCA Links: Profile News Message Board | |
| Charts:- Daily , Weekly | |
| Add NCA to Watchlist: View: Get Complete NCA Trend Analysis ➞ | |
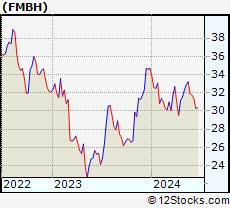 | FMBH First Mid Bancshares, Inc. |
| Sector: Financials | |
| SubSector: Regional - Midwest Banks | |
| MarketCap: 373.27 Millions | |
| Recent Price: 31.74 Smart Investing & Trading Score: 63 | |
| Day Percent Change: 0.44% Day Change: 0.14 | |
| Week Change: -0.47% Year-to-date Change: -8.4% | |
| FMBH Links: Profile News Message Board | |
| Charts:- Daily , Weekly | |
| Add FMBH to Watchlist: View: Get Complete FMBH Trend Analysis ➞ | |
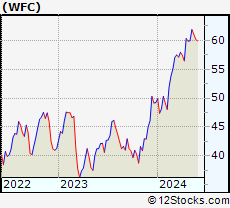 | WFC Wells Fargo & Company |
| Sector: Financials | |
| SubSector: Money Center Banks | |
| MarketCap: 129138 Millions | |
| Recent Price: 59.92 Smart Investing & Trading Score: 56 | |
| Day Percent Change: 1.20% Day Change: 0.71 | |
| Week Change: -0.48% Year-to-date Change: 21.7% | |
| WFC Links: Profile News Message Board | |
| Charts:- Daily , Weekly | |
| Add WFC to Watchlist: View: Get Complete WFC Trend Analysis ➞ | |
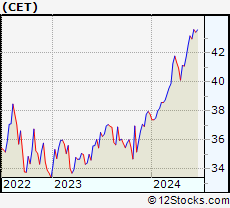 | CET Central Securities Corp. |
| Sector: Financials | |
| SubSector: Asset Management | |
| MarketCap: 574.703 Millions | |
| Recent Price: 42.95 Smart Investing & Trading Score: 83 | |
| Day Percent Change: 0.37% Day Change: 0.16 | |
| Week Change: -0.48% Year-to-date Change: 13.7% | |
| CET Links: Profile News Message Board | |
| Charts:- Daily , Weekly | |
| Add CET to Watchlist: View: Get Complete CET Trend Analysis ➞ | |
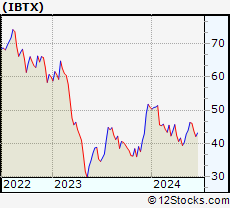 | IBTX Independent Bank Group, Inc. |
| Sector: Financials | |
| SubSector: Regional - Southeast Banks | |
| MarketCap: 1133.35 Millions | |
| Recent Price: 46.04 Smart Investing & Trading Score: 68 | |
| Day Percent Change: 0.13% Day Change: 0.06 | |
| Week Change: -0.48% Year-to-date Change: -9.5% | |
| IBTX Links: Profile News Message Board | |
| Charts:- Daily , Weekly | |
| Add IBTX to Watchlist: View: Get Complete IBTX Trend Analysis ➞ | |
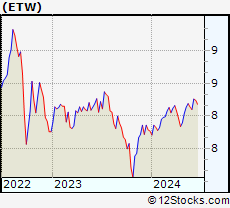 | ETW Eaton Vance Tax-Managed Global Buy-Write Opportunities Fund |
| Sector: Financials | |
| SubSector: Closed-End Fund - Foreign | |
| MarketCap: 666.447 Millions | |
| Recent Price: 8.10 Smart Investing & Trading Score: 58 | |
| Day Percent Change: 0.75% Day Change: 0.06 | |
| Week Change: -0.49% Year-to-date Change: 4.3% | |
| ETW Links: Profile News Message Board | |
| Charts:- Daily , Weekly | |
| Add ETW to Watchlist: View: Get Complete ETW Trend Analysis ➞ | |
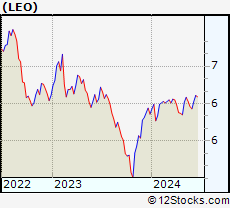 | LEO BNY Mellon Strategic Municipals, Inc. |
| Sector: Financials | |
| SubSector: Closed-End Fund - Debt | |
| MarketCap: 429.107 Millions | |
| Recent Price: 5.93 Smart Investing & Trading Score: 35 | |
| Day Percent Change: 0.34% Day Change: 0.02 | |
| Week Change: -0.5% Year-to-date Change: 1.2% | |
| LEO Links: Profile News Message Board | |
| Charts:- Daily , Weekly | |
| Add LEO to Watchlist: View: Get Complete LEO Trend Analysis ➞ | |
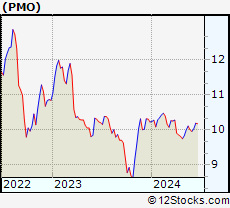 | PMO Putnam Municipal Opportunities Trust |
| Sector: Financials | |
| SubSector: Closed-End Fund - Debt | |
| MarketCap: 377.507 Millions | |
| Recent Price: 9.96 Smart Investing & Trading Score: 52 | |
| Day Percent Change: 0.61% Day Change: 0.06 | |
| Week Change: -0.5% Year-to-date Change: -2.6% | |
| PMO Links: Profile News Message Board | |
| Charts:- Daily , Weekly | |
| Add PMO to Watchlist: View: Get Complete PMO Trend Analysis ➞ | |
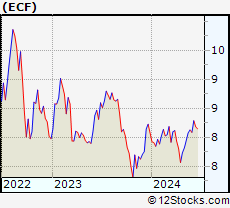 | ECF Ellsworth Growth and Income Fund Ltd. |
| Sector: Financials | |
| SubSector: Asset Management | |
| MarketCap: 102.203 Millions | |
| Recent Price: 8.09 Smart Investing & Trading Score: 65 | |
| Day Percent Change: 0.75% Day Change: 0.06 | |
| Week Change: -0.5% Year-to-date Change: 0.1% | |
| ECF Links: Profile News Message Board | |
| Charts:- Daily , Weekly | |
| Add ECF to Watchlist: View: Get Complete ECF Trend Analysis ➞ | |
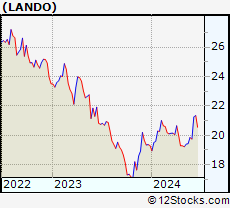 | LANDO Gladstone Land Corporation |
| Sector: Financials | |
| SubSector: REIT Industrial | |
| MarketCap: 37267 Millions | |
| Recent Price: 19.75 Smart Investing & Trading Score: 42 | |
| Day Percent Change: -1.79% Day Change: -0.36 | |
| Week Change: -0.5% Year-to-date Change: 2.3% | |
| LANDO Links: Profile News Message Board | |
| Charts:- Daily , Weekly | |
| Add LANDO to Watchlist: View: Get Complete LANDO Trend Analysis ➞ | |
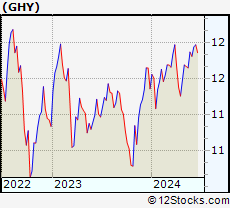 | GHY PGIM Global High Yield Fund, Inc |
| Sector: Financials | |
| SubSector: Closed-End Fund - Debt | |
| MarketCap: 397.307 Millions | |
| Recent Price: 11.81 Smart Investing & Trading Score: 88 | |
| Day Percent Change: 0.94% Day Change: 0.11 | |
| Week Change: -0.51% Year-to-date Change: 4.0% | |
| GHY Links: Profile News Message Board | |
| Charts:- Daily , Weekly | |
| Add GHY to Watchlist: View: Get Complete GHY Trend Analysis ➞ | |
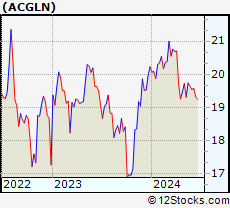 | ACGLN Arch Capital Group Ltd. |
| Sector: Financials | |
| SubSector: Insurance - Diversified | |
| MarketCap: 27880 Millions | |
| Recent Price: 19.54 Smart Investing & Trading Score: 40 | |
| Day Percent Change: 0.21% Day Change: 0.04 | |
| Week Change: -0.51% Year-to-date Change: -3.4% | |
| ACGLN Links: Profile News Message Board | |
| Charts:- Daily , Weekly | |
| Add ACGLN to Watchlist: View: Get Complete ACGLN Trend Analysis ➞ | |
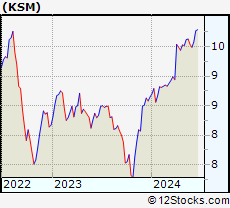 | KSM DWS Strategic Municipal Income Trust |
| Sector: Financials | |
| SubSector: Closed-End Fund - Debt | |
| MarketCap: 103.607 Millions | |
| Recent Price: 9.49 Smart Investing & Trading Score: 61 | |
| Day Percent Change: 0.00% Day Change: 0.00 | |
| Week Change: -0.52% Year-to-date Change: 9.7% | |
| KSM Links: Profile News Message Board | |
| Charts:- Daily , Weekly | |
| Add KSM to Watchlist: View: Get Complete KSM Trend Analysis ➞ | |
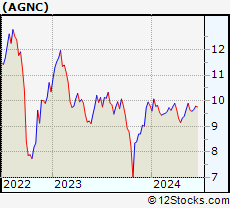 | AGNC AGNC Investment Corp. |
| Sector: Financials | |
| SubSector: Mortgage Investment | |
| MarketCap: 6622.19 Millions | |
| Recent Price: 9.59 Smart Investing & Trading Score: 48 | |
| Day Percent Change: 0.00% Day Change: 0.00 | |
| Week Change: -0.52% Year-to-date Change: -2.2% | |
| AGNC Links: Profile News Message Board | |
| Charts:- Daily , Weekly | |
| Add AGNC to Watchlist: View: Get Complete AGNC Trend Analysis ➞ | |
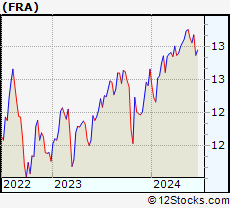 | FRA BlackRock Floating Rate Income Strategies Fund, Inc. |
| Sector: Financials | |
| SubSector: Closed-End Fund - Debt | |
| MarketCap: 312.007 Millions | |
| Recent Price: 13.06 Smart Investing & Trading Score: 51 | |
| Day Percent Change: 0.62% Day Change: 0.08 | |
| Week Change: -0.53% Year-to-date Change: 3.2% | |
| FRA Links: Profile News Message Board | |
| Charts:- Daily , Weekly | |
| Add FRA to Watchlist: View: Get Complete FRA Trend Analysis ➞ | |
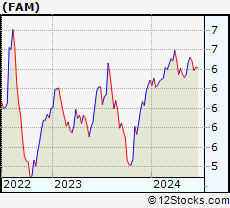 | FAM First Trust/Aberdeen Global Opportunity Income Fund |
| Sector: Financials | |
| SubSector: Closed-End Fund - Debt | |
| MarketCap: 103.307 Millions | |
| Recent Price: 6.49 Smart Investing & Trading Score: 76 | |
| Day Percent Change: 1.72% Day Change: 0.11 | |
| Week Change: -0.54% Year-to-date Change: 3.2% | |
| FAM Links: Profile News Message Board | |
| Charts:- Daily , Weekly | |
| Add FAM to Watchlist: View: Get Complete FAM Trend Analysis ➞ | |
| For tabular summary view of above stock list: Summary View ➞ 0 - 25 , 25 - 50 , 50 - 75 , 75 - 100 , 100 - 125 , 125 - 150 , 150 - 175 , 175 - 200 , 200 - 225 , 225 - 250 , 250 - 275 , 275 - 300 , 300 - 325 , 325 - 350 , 350 - 375 , 375 - 400 , 400 - 425 , 425 - 450 , 450 - 475 , 475 - 500 , 500 - 525 , 525 - 550 , 550 - 575 , 575 - 600 , 600 - 625 , 625 - 650 , 650 - 675 , 675 - 700 , 700 - 725 , 725 - 750 , 750 - 775 , 775 - 800 , 800 - 825 , 825 - 850 , 850 - 875 , 875 - 900 , 900 - 925 , 925 - 950 , 950 - 975 , 975 - 1000 , 1000 - 1025 , 1025 - 1050 , 1050 - 1075 , 1075 - 1100 , 1100 - 1125 , 1125 - 1150 , 1150 - 1175 , 1175 - 1200 , 1200 - 1225 | ||
| Click To Change The Sort Order: By Market Cap or Company Size Performance: Year-to-date, Week and Day | |
| Select Chart Type: | ||
|
Best Stocks Today 12Stocks.com |
© 2024 12Stocks.com Terms & Conditions Privacy Contact Us
All Information Provided Only For Education And Not To Be Used For Investing or Trading. See Terms & Conditions


One More Thing ... Get Best Stocks Delivered Daily!
Never Ever Miss A Move With Our Top Ten Stocks Lists
Find Best Stocks In Any Market - Bull or Bear Market
Take A Peek At Our Top Ten Stocks Lists: Daily, Weekly, Year-to-Date & Top Trends
Find Best Stocks In Any Market - Bull or Bear Market
Take A Peek At Our Top Ten Stocks Lists: Daily, Weekly, Year-to-Date & Top Trends
Financial Stocks With Best Up Trends [0-bearish to 100-bullish]: X [100], Brighthouse [100], Central and[100], Northrim BanCorp[100], Bank of America[100], Hagerty [100], Urban Edge[100], Global Blockchain[100], Ventas [100], Omega Healthcare[100], LPL [100]
Best Financial Stocks Year-to-Date:
Root [385.58%], Chimera [138.48%], Banco Macro[130.98%], SelectQuote [127.74%], Gladstone Capital[109.35%], Grupo Financiero[107.65%], Banco BBVA[107.54%], EverQuote [95.18%], Hippo [93.63%], Grupo Supervielle[78.33%], Vista Oil[64.18%] Best Financial Stocks This Week:
C3.ai [23%], Investors Title[19.4%], Banco BBVA[14.74%], Riverview Bancorp[14.25%], Banco Macro[13.7%], IRSA Inversiones[12.15%], Grupo Supervielle[11.73%], Metals Acquisition[10.74%], Grupo Financiero[10.41%], Fathom [10.24%], Vista Oil[9.32%] Best Financial Stocks Daily:
Riverview Bancorp[15.75%], Allied World[14.88%], Medical Properties[7.20%], X [6.14%], Franklin Street[5.32%], Washington Federal[5.16%], Iris Energy[5.13%], Ameris Bancorp[4.80%], Brighthouse [4.79%], Auburn National[4.70%], Central and[4.63%]