
 Login Sign Up


| |||||
 |  | ||||

| 12Stocks.com Market Intelligence |
Best Financial Stocks
| In a hurry? Financial Stocks Lists: Performance Trends Table, Stock Charts
Sort Financial stocks: Daily, Weekly, Year-to-Date, Market Cap & Trends. Filter Financial stocks list by size:All Financial Large Mid-Range Small & MicroCap |
| 12Stocks.com Financial Stocks Performances & Trends Daily | |||||||||
|
|  The overall Smart Investing & Trading Score is 78 (0-bearish to 100-bullish) which puts Financial sector in short term neutral to bullish trend. The Smart Investing & Trading Score from previous trading session is 46 and hence an improvement of trend.
| ||||||||
Here are the Smart Investing & Trading Scores of the most requested Financial stocks at 12Stocks.com (click stock name for detailed review):
|


| 12Stocks.com: Investing in Financial sector with Stocks | |
|
The following table helps investors and traders sort through current performance and trends (as measured by Smart Investing & Trading Score) of various
stocks in the Financial sector. Quick View: Move mouse or cursor over stock symbol (ticker) to view short-term Technical chart and over stock name to view long term chart. Click on  to add stock symbol to your watchlist and to add stock symbol to your watchlist and  to view watchlist. Click on any ticker or stock name for detailed market intelligence report for that stock. to view watchlist. Click on any ticker or stock name for detailed market intelligence report for that stock. |
12Stocks.com Performance of Stocks in Financial Sector
| Ticker | Stock Name | Watchlist | Category | Recent Price | Smart Investing & Trading Score | Change % | Weekly Change% |
| MKL | Markel |   | Insurance | 1641.59 | 88 | 1.28% | 1.44% |
| FUND | Sprott Focus | | Closed-End Fund - Equity | 7.93 | 93 | 1.63% | 1.41% |
| SCHW | Charles Schwab | | Brokerage | 73.28 | 68 | 1.95% | 1.40% |
| HOPE | Hope Bancorp | | Regional Banks | 10.53 | 32 | 1.64% | 1.40% |
| SKT | Tanger Factory | | REIT - Retail | 27.75 | 50 | 1.20% | 1.39% |
| BRT | BRT Apartments | | Mortgage | 17.50 | 68 | 1.39% | 1.39% |
| PCN | PIMCO Corporate | | Closed-End Fund - Debt | 13.10 | 69 | 1.39% | 1.39% |
| TCBI | Texas Capital | | Regional - Southwest Banks | 60.28 | 68 | 0.97% | 1.38% |
| LADR | Ladder Capital | | Mortgage | 11.18 | 76 | 1.82% | 1.36% |
| BTZ | BlackRock Credit | | Closed-End Fund - Debt | 10.59 | 74 | 1.24% | 1.34% |
| AMG | Affiliated Managers | | Asset Mgmt | 162.60 | 100 | 1.26% | 1.33% |
| SAMG | Silvercrest Asset | | Asset Mgmt | 15.28 | 67 | -0.59% | 1.33% |
| CRF | Cornerstone Total | | Asset Mgmt | 7.65 | 76 | 1.19% | 1.32% |
| FBMS | First Bancshares | | Regional Banks | 25.35 | 86 | 1.73% | 1.32% |
| HBAN | Huntington Bancshares | | Regional Banks | 13.92 | 68 | 1.90% | 1.31% |
| GBAB | Guggenheim Taxable | | Closed-End Fund - Debt | 16.25 | 87 | 0.93% | 1.31% |
| JRI | Nuveen Real | | Closed-End Fund - Equity | 11.56 | 78 | 2.17% | 1.31% |
| KB | KB | | Foreign Banks | 57.54 | 83 | 0.12% | 1.30% |
| EVG | Eaton Vance | | Closed-End Fund - Debt | 10.94 | 93 | 2.43% | 1.30% |
| TYG | Tortoise Energy | | Closed-End Fund - Equity | 33.51 | 83 | 2.48% | 1.30% |
| OXLC | Oxford Lane | | Closed-End Fund - Debt | 5.46 | 93 | 0.92% | 1.30% |
| HAFC | Hanmi | | Regional Banks | 15.76 | 68 | 1.81% | 1.29% |
| MBINM | Merchants Bancorp | | Banks - Regional | 25.94 | 54 | 0.54% | 1.29% |
| NU | Nu | | Banks - | 11.88 | 60 | -2.38% | 1.28% |
| CEM | ClearBridge MLP | | Closed-End Fund - Equity | 47.29 | 83 | 2.03% | 1.26% |
| For chart view version of above stock list: Chart View ➞ 0 - 25 , 25 - 50 , 50 - 75 , 75 - 100 , 100 - 125 , 125 - 150 , 150 - 175 , 175 - 200 , 200 - 225 , 225 - 250 , 250 - 275 , 275 - 300 , 300 - 325 , 325 - 350 , 350 - 375 , 375 - 400 , 400 - 425 , 425 - 450 , 450 - 475 , 475 - 500 , 500 - 525 , 525 - 550 , 550 - 575 , 575 - 600 , 600 - 625 , 625 - 650 , 650 - 675 , 675 - 700 , 700 - 725 , 725 - 750 , 750 - 775 , 775 - 800 , 800 - 825 , 825 - 850 , 850 - 875 , 875 - 900 , 900 - 925 , 925 - 950 , 950 - 975 , 975 - 1000 , 1000 - 1025 , 1025 - 1050 , 1050 - 1075 , 1075 - 1100 , 1100 - 1125 , 1125 - 1150 , 1150 - 1175 , 1175 - 1200 , 1200 - 1225 | ||
 | Click To Change The Sort Order: By Market Cap or Company Size Performance: Year-to-date, Week and Day |  |
|
Get the most comprehensive stock market coverage daily at 12Stocks.com ➞ Best Stocks Today ➞ Best Stocks Weekly ➞ Best Stocks Year-to-Date ➞ Best Stocks Trends ➞  Best Stocks Today 12Stocks.com Best Nasdaq Stocks ➞ Best S&P 500 Stocks ➞ Best Tech Stocks ➞ Best Biotech Stocks ➞ |
| Detailed Overview of Financial Stocks |
| Financial Technical Overview, Leaders & Laggards, Top Financial ETF Funds & Detailed Financial Stocks List, Charts, Trends & More |
| Financial Sector: Technical Analysis, Trends & YTD Performance | |
| Financial sector is composed of stocks
from banks, brokers, insurance, REITs
and services subsectors. Financial sector, as represented by XLF, an exchange-traded fund [ETF] that holds basket of Financial stocks (e.g, Bank of America, Goldman Sachs) is up by 10.74% and is currently outperforming the overall market by 0.95% year-to-date. Below is a quick view of Technical charts and trends: |
|
 XLF Weekly Chart |
|
| Long Term Trend: Very Good | |
| Medium Term Trend: Good | |
 XLF Daily Chart |
|
| Short Term Trend: Very Good | |
| Overall Trend Score: 78 | |
| YTD Performance: 10.74% | |
| **Trend Scores & Views Are Only For Educational Purposes And Not For Investing | |
| 12Stocks.com: Top Performing Financial Sector Stocks | ||||||||||||||||||||||||||||||||||||||||||||||||
 The top performing Financial sector stocks year to date are
Now, more recently, over last week, the top performing Financial sector stocks on the move are


|
||||||||||||||||||||||||||||||||||||||||||||||||
| 12Stocks.com: Investing in Financial Sector using Exchange Traded Funds | |
|
The following table shows list of key exchange traded funds (ETF) that
help investors track Financial Index. For detailed view, check out our ETF Funds section of our website. Quick View: Move mouse or cursor over ETF symbol (ticker) to view short-term Technical chart and over ETF name to view long term chart. Click on ticker or stock name for detailed view. Click on to add stock symbol to your watchlist and to view watchlist. |
12Stocks.com List of ETFs that track Financial Index
| Ticker | ETF Name | Watchlist | Recent Price | Smart Investing & Trading Score | Change % | Week % | Year-to-date % |
| XLF | Financial | | 41.64 | 78 | 1.46 | 0.07 | 10.74% |
| IAI | Broker-Dealers & Secs | | 116.64 | 58 | 0.53 | -1.91 | 7.47% |
| IYF | Financials | | 95.25 | 78 | 1.32 | 0.03 | 11.52% |
| IYG | Financial Services | | 65.74 | 71 | 1.14 | -0.33 | 10.05% |
| KRE | Regional Banking | | 48.85 | 61 | 1.41 | -0.14 | -6.83% |
| IXG | Global Financials | | 87.05 | 76 | 0.80 | -0.54 | 10.77% |
| VFH | Financials | | 101.01 | 78 | 1.28 | -0.12 | 9.48% |
| KBE | Bank | | 46.23 | 68 | 1.34 | 0 | 0.46% |
| FAS | Financial Bull 3X | | 105.34 | 78 | 4.16 | -0.02 | 27.45% |
| FAZ | Financial Bear 3X | | 10.35 | 17 | -4.08 | -0.1 | -24.29% |
| UYG | Financials | | 65.65 | 78 | 3.19 | -0.03 | 18.93% |
| IAT | Regional Banks | | 41.90 | 68 | 1.87 | 0 | 0.14% |
| KIE | Insurance | | 51.16 | 78 | 1.11 | 0.69 | 13.14% |
| PSCF | SmallCap Financials | | 47.14 | 53 | 1.59 | -0.79 | -4.14% |
| EUFN | Europe Financials | | 24.18 | 100 | 1.02 | 0.71 | 15.36% |
| PGF | Financial Preferred | | 14.79 | 55 | 1.09 | 0.68 | 1.44% |
| 12Stocks.com: Charts, Trends, Fundamental Data and Performances of Financial Stocks | |
|
We now take in-depth look at all Financial stocks including charts, multi-period performances and overall trends (as measured by Smart Investing & Trading Score). One can sort Financial stocks (click link to choose) by Daily, Weekly and by Year-to-Date performances. Also, one can sort by size of the company or by market capitalization. |
| Select Your Default Chart Type: | |||||
| |||||
| Click on stock symbol or name for detailed view. Click on to add stock symbol to your watchlist and to view watchlist. Quick View: Move mouse or cursor over "Daily" to quickly view daily Technical stock chart and over "Weekly" to view weekly Technical stock chart. | |||||

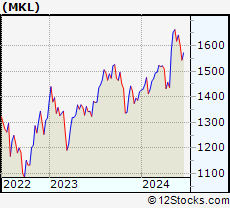 | MKL Markel Corporation |
| Sector: Financials | |
| SubSector: Property & Casualty Insurance | |
| MarketCap: 12405.9 Millions | |
| Recent Price: 1641.59 Smart Investing & Trading Score: 88 | |
| Day Percent Change: 1.28% Day Change: 20.76 | |
| Week Change: 1.44% Year-to-date Change: 15.6% | |
| MKL Links: Profile News Message Board | |
| Charts:- Daily , Weekly | |
| Add MKL to Watchlist: View: Get Complete MKL Trend Analysis ➞ | |
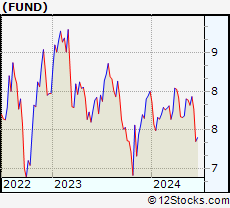 | FUND Sprott Focus Trust, Inc. |
| Sector: Financials | |
| SubSector: Closed-End Fund - Equity | |
| MarketCap: 122.747 Millions | |
| Recent Price: 7.93 Smart Investing & Trading Score: 93 | |
| Day Percent Change: 1.63% Day Change: 0.13 | |
| Week Change: 1.41% Year-to-date Change: -0.9% | |
| FUND Links: Profile News Message Board | |
| Charts:- Daily , Weekly | |
| Add FUND to Watchlist: View: Get Complete FUND Trend Analysis ➞ | |
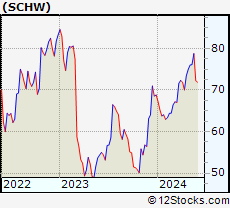 | SCHW The Charles Schwab Corporation |
| Sector: Financials | |
| SubSector: Investment Brokerage - National | |
| MarketCap: 45115.8 Millions | |
| Recent Price: 73.28 Smart Investing & Trading Score: 68 | |
| Day Percent Change: 1.95% Day Change: 1.40 | |
| Week Change: 1.4% Year-to-date Change: 6.5% | |
| SCHW Links: Profile News Message Board | |
| Charts:- Daily , Weekly | |
| Add SCHW to Watchlist: View: Get Complete SCHW Trend Analysis ➞ | |
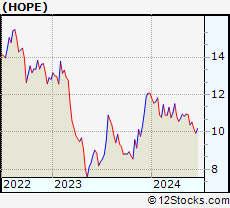 | HOPE Hope Bancorp, Inc. |
| Sector: Financials | |
| SubSector: Regional - Pacific Banks | |
| MarketCap: 1099.29 Millions | |
| Recent Price: 10.53 Smart Investing & Trading Score: 32 | |
| Day Percent Change: 1.64% Day Change: 0.17 | |
| Week Change: 1.4% Year-to-date Change: -12.8% | |
| HOPE Links: Profile News Message Board | |
| Charts:- Daily , Weekly | |
| Add HOPE to Watchlist: View: Get Complete HOPE Trend Analysis ➞ | |
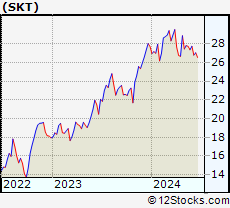 | SKT Tanger Factory Outlet Centers, Inc. |
| Sector: Financials | |
| SubSector: REIT - Retail | |
| MarketCap: 720.214 Millions | |
| Recent Price: 27.75 Smart Investing & Trading Score: 50 | |
| Day Percent Change: 1.20% Day Change: 0.33 | |
| Week Change: 1.39% Year-to-date Change: 0.1% | |
| SKT Links: Profile News Message Board | |
| Charts:- Daily , Weekly | |
| Add SKT to Watchlist: View: Get Complete SKT Trend Analysis ➞ | |
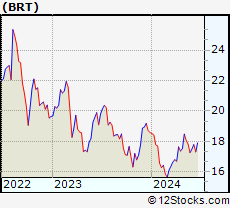 | BRT BRT Apartments Corp. |
| Sector: Financials | |
| SubSector: Mortgage Investment | |
| MarketCap: 163.239 Millions | |
| Recent Price: 17.50 Smart Investing & Trading Score: 68 | |
| Day Percent Change: 1.39% Day Change: 0.24 | |
| Week Change: 1.39% Year-to-date Change: -5.9% | |
| BRT Links: Profile News Message Board | |
| Charts:- Daily , Weekly | |
| Add BRT to Watchlist: View: Get Complete BRT Trend Analysis ➞ | |
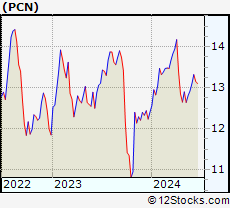 | PCN PIMCO Corporate & Income Strategy Fund |
| Sector: Financials | |
| SubSector: Closed-End Fund - Debt | |
| MarketCap: 442.607 Millions | |
| Recent Price: 13.10 Smart Investing & Trading Score: 69 | |
| Day Percent Change: 1.39% Day Change: 0.18 | |
| Week Change: 1.39% Year-to-date Change: 5.6% | |
| PCN Links: Profile News Message Board | |
| Charts:- Daily , Weekly | |
| Add PCN to Watchlist: View: Get Complete PCN Trend Analysis ➞ | |
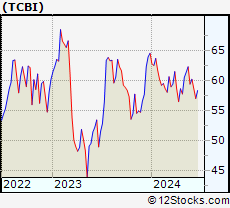 | TCBI Texas Capital Bancshares, Inc. |
| Sector: Financials | |
| SubSector: Regional - Southwest Banks | |
| MarketCap: 1202.75 Millions | |
| Recent Price: 60.28 Smart Investing & Trading Score: 68 | |
| Day Percent Change: 0.97% Day Change: 0.58 | |
| Week Change: 1.38% Year-to-date Change: -6.7% | |
| TCBI Links: Profile News Message Board | |
| Charts:- Daily , Weekly | |
| Add TCBI to Watchlist: View: Get Complete TCBI Trend Analysis ➞ | |
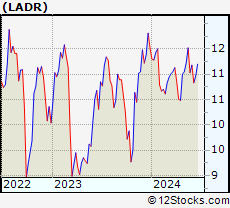 | LADR Ladder Capital Corp |
| Sector: Financials | |
| SubSector: Mortgage Investment | |
| MarketCap: 660.039 Millions | |
| Recent Price: 11.18 Smart Investing & Trading Score: 76 | |
| Day Percent Change: 1.82% Day Change: 0.20 | |
| Week Change: 1.36% Year-to-date Change: -2.9% | |
| LADR Links: Profile News Message Board | |
| Charts:- Daily , Weekly | |
| Add LADR to Watchlist: View: Get Complete LADR Trend Analysis ➞ | |
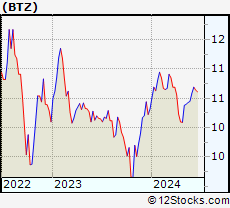 | BTZ BlackRock Credit Allocation Income Trust |
| Sector: Financials | |
| SubSector: Closed-End Fund - Debt | |
| MarketCap: 1023.07 Millions | |
| Recent Price: 10.59 Smart Investing & Trading Score: 74 | |
| Day Percent Change: 1.24% Day Change: 0.13 | |
| Week Change: 1.34% Year-to-date Change: 2.6% | |
| BTZ Links: Profile News Message Board | |
| Charts:- Daily , Weekly | |
| Add BTZ to Watchlist: View: Get Complete BTZ Trend Analysis ➞ | |
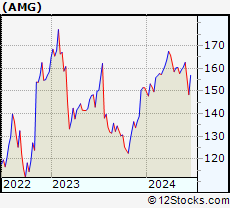 | AMG Affiliated Managers Group, Inc. |
| Sector: Financials | |
| SubSector: Asset Management | |
| MarketCap: 2849.63 Millions | |
| Recent Price: 162.60 Smart Investing & Trading Score: 100 | |
| Day Percent Change: 1.26% Day Change: 2.03 | |
| Week Change: 1.33% Year-to-date Change: 7.4% | |
| AMG Links: Profile News Message Board | |
| Charts:- Daily , Weekly | |
| Add AMG to Watchlist: View: Get Complete AMG Trend Analysis ➞ | |
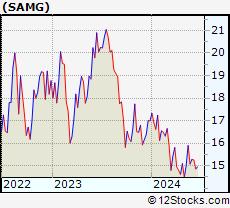 | SAMG Silvercrest Asset Management Group Inc. |
| Sector: Financials | |
| SubSector: Asset Management | |
| MarketCap: 116.303 Millions | |
| Recent Price: 15.28 Smart Investing & Trading Score: 67 | |
| Day Percent Change: -0.59% Day Change: -0.09 | |
| Week Change: 1.33% Year-to-date Change: -10.1% | |
| SAMG Links: Profile News Message Board | |
| Charts:- Daily , Weekly | |
| Add SAMG to Watchlist: View: Get Complete SAMG Trend Analysis ➞ | |
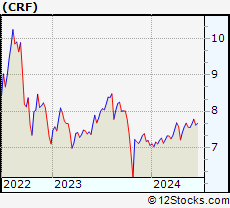 | CRF Cornerstone Total Return Fund, Inc. |
| Sector: Financials | |
| SubSector: Asset Management | |
| MarketCap: 262.903 Millions | |
| Recent Price: 7.65 Smart Investing & Trading Score: 76 | |
| Day Percent Change: 1.19% Day Change: 0.09 | |
| Week Change: 1.32% Year-to-date Change: 8.4% | |
| CRF Links: Profile News Message Board | |
| Charts:- Daily , Weekly | |
| Add CRF to Watchlist: View: Get Complete CRF Trend Analysis ➞ | |
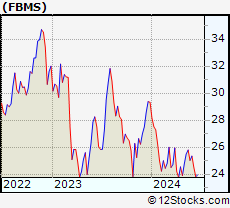 | FBMS The First Bancshares, Inc. |
| Sector: Financials | |
| SubSector: Regional - Southeast Banks | |
| MarketCap: 359.535 Millions | |
| Recent Price: 25.35 Smart Investing & Trading Score: 86 | |
| Day Percent Change: 1.73% Day Change: 0.43 | |
| Week Change: 1.32% Year-to-date Change: -13.6% | |
| FBMS Links: Profile News Message Board | |
| Charts:- Daily , Weekly | |
| Add FBMS to Watchlist: View: Get Complete FBMS Trend Analysis ➞ | |
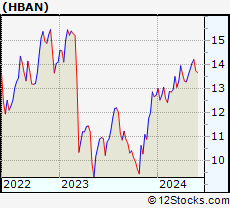 | HBAN Huntington Bancshares Incorporated |
| Sector: Financials | |
| SubSector: Regional - Midwest Banks | |
| MarketCap: 8468.1 Millions | |
| Recent Price: 13.92 Smart Investing & Trading Score: 68 | |
| Day Percent Change: 1.90% Day Change: 0.26 | |
| Week Change: 1.31% Year-to-date Change: 9.4% | |
| HBAN Links: Profile News Message Board | |
| Charts:- Daily , Weekly | |
| Add HBAN to Watchlist: View: Get Complete HBAN Trend Analysis ➞ | |
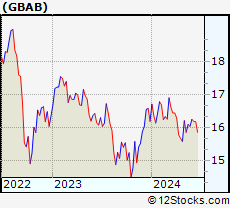 | GBAB Guggenheim Taxable Municipal Managed Duration Trust |
| Sector: Financials | |
| SubSector: Closed-End Fund - Debt | |
| MarketCap: 344.607 Millions | |
| Recent Price: 16.25 Smart Investing & Trading Score: 87 | |
| Day Percent Change: 0.93% Day Change: 0.15 | |
| Week Change: 1.31% Year-to-date Change: 0.4% | |
| GBAB Links: Profile News Message Board | |
| Charts:- Daily , Weekly | |
| Add GBAB to Watchlist: View: Get Complete GBAB Trend Analysis ➞ | |
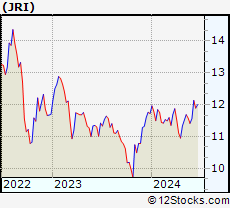 | JRI Nuveen Real Asset Income and Growth Fund |
| Sector: Financials | |
| SubSector: Closed-End Fund - Equity | |
| MarketCap: 239.247 Millions | |
| Recent Price: 11.56 Smart Investing & Trading Score: 78 | |
| Day Percent Change: 2.17% Day Change: 0.25 | |
| Week Change: 1.31% Year-to-date Change: -1.4% | |
| JRI Links: Profile News Message Board | |
| Charts:- Daily , Weekly | |
| Add JRI to Watchlist: View: Get Complete JRI Trend Analysis ➞ | |
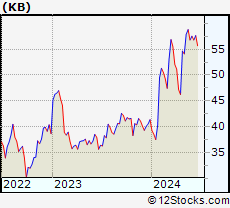 | KB KB Financial Group Inc. |
| Sector: Financials | |
| SubSector: Foreign Regional Banks | |
| MarketCap: 10853.9 Millions | |
| Recent Price: 57.54 Smart Investing & Trading Score: 83 | |
| Day Percent Change: 0.12% Day Change: 0.07 | |
| Week Change: 1.3% Year-to-date Change: 39.1% | |
| KB Links: Profile News Message Board | |
| Charts:- Daily , Weekly | |
| Add KB to Watchlist: View: Get Complete KB Trend Analysis ➞ | |
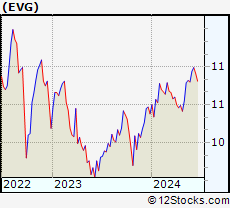 | EVG Eaton Vance Short Duration Diversified Income Fund |
| Sector: Financials | |
| SubSector: Closed-End Fund - Debt | |
| MarketCap: 183.207 Millions | |
| Recent Price: 10.94 Smart Investing & Trading Score: 93 | |
| Day Percent Change: 2.43% Day Change: 0.26 | |
| Week Change: 1.3% Year-to-date Change: 5.4% | |
| EVG Links: Profile News Message Board | |
| Charts:- Daily , Weekly | |
| Add EVG to Watchlist: View: Get Complete EVG Trend Analysis ➞ | |
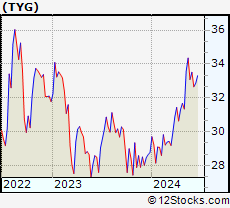 | TYG Tortoise Energy Infrastructure Corporation |
| Sector: Financials | |
| SubSector: Closed-End Fund - Equity | |
| MarketCap: 140.547 Millions | |
| Recent Price: 33.51 Smart Investing & Trading Score: 83 | |
| Day Percent Change: 2.48% Day Change: 0.81 | |
| Week Change: 1.3% Year-to-date Change: 16.5% | |
| TYG Links: Profile News Message Board | |
| Charts:- Daily , Weekly | |
| Add TYG to Watchlist: View: Get Complete TYG Trend Analysis ➞ | |
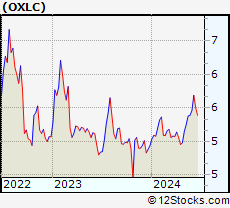 | OXLC Oxford Lane Capital Corp. |
| Sector: Financials | |
| SubSector: Closed-End Fund - Debt | |
| MarketCap: 235.907 Millions | |
| Recent Price: 5.46 Smart Investing & Trading Score: 93 | |
| Day Percent Change: 0.92% Day Change: 0.05 | |
| Week Change: 1.3% Year-to-date Change: 10.5% | |
| OXLC Links: Profile News Message Board | |
| Charts:- Daily , Weekly | |
| Add OXLC to Watchlist: View: Get Complete OXLC Trend Analysis ➞ | |
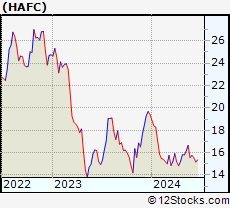 | HAFC Hanmi Financial Corporation |
| Sector: Financials | |
| SubSector: Regional - Pacific Banks | |
| MarketCap: 319.929 Millions | |
| Recent Price: 15.76 Smart Investing & Trading Score: 68 | |
| Day Percent Change: 1.81% Day Change: 0.28 | |
| Week Change: 1.29% Year-to-date Change: -18.8% | |
| HAFC Links: Profile News Message Board | |
| Charts:- Daily , Weekly | |
| Add HAFC to Watchlist: View: Get Complete HAFC Trend Analysis ➞ | |
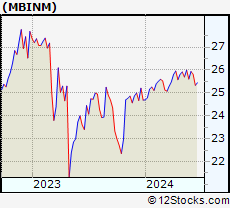 | MBINM Merchants Bancorp |
| Sector: Financials | |
| SubSector: Banks - Regional | |
| MarketCap: 1110 Millions | |
| Recent Price: 25.94 Smart Investing & Trading Score: 54 | |
| Day Percent Change: 0.54% Day Change: 0.14 | |
| Week Change: 1.29% Year-to-date Change: 5.1% | |
| MBINM Links: Profile News Message Board | |
| Charts:- Daily , Weekly | |
| Add MBINM to Watchlist: View: Get Complete MBINM Trend Analysis ➞ | |
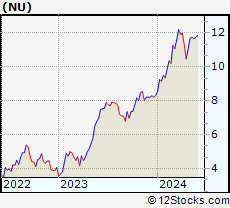 | NU Nu Holdings Ltd. |
| Sector: Financials | |
| SubSector: Banks - Diversified | |
| MarketCap: 37240 Millions | |
| Recent Price: 11.88 Smart Investing & Trading Score: 60 | |
| Day Percent Change: -2.38% Day Change: -0.29 | |
| Week Change: 1.28% Year-to-date Change: 42.5% | |
| NU Links: Profile News Message Board | |
| Charts:- Daily , Weekly | |
| Add NU to Watchlist: View: Get Complete NU Trend Analysis ➞ | |
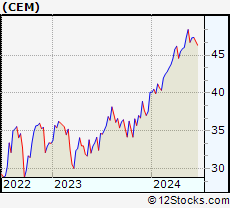 | CEM ClearBridge MLP and Midstream Fund Inc |
| Sector: Financials | |
| SubSector: Closed-End Fund - Equity | |
| MarketCap: 114.747 Millions | |
| Recent Price: 47.29 Smart Investing & Trading Score: 83 | |
| Day Percent Change: 2.03% Day Change: 0.94 | |
| Week Change: 1.26% Year-to-date Change: 18.0% | |
| CEM Links: Profile News Message Board | |
| Charts:- Daily , Weekly | |
| Add CEM to Watchlist: View: Get Complete CEM Trend Analysis ➞ | |
| For tabular summary view of above stock list: Summary View ➞ 0 - 25 , 25 - 50 , 50 - 75 , 75 - 100 , 100 - 125 , 125 - 150 , 150 - 175 , 175 - 200 , 200 - 225 , 225 - 250 , 250 - 275 , 275 - 300 , 300 - 325 , 325 - 350 , 350 - 375 , 375 - 400 , 400 - 425 , 425 - 450 , 450 - 475 , 475 - 500 , 500 - 525 , 525 - 550 , 550 - 575 , 575 - 600 , 600 - 625 , 625 - 650 , 650 - 675 , 675 - 700 , 700 - 725 , 725 - 750 , 750 - 775 , 775 - 800 , 800 - 825 , 825 - 850 , 850 - 875 , 875 - 900 , 900 - 925 , 925 - 950 , 950 - 975 , 975 - 1000 , 1000 - 1025 , 1025 - 1050 , 1050 - 1075 , 1075 - 1100 , 1100 - 1125 , 1125 - 1150 , 1150 - 1175 , 1175 - 1200 , 1200 - 1225 | ||
| Click To Change The Sort Order: By Market Cap or Company Size Performance: Year-to-date, Week and Day | |
| Select Chart Type: | ||
|
Best Stocks Today 12Stocks.com |
© 2024 12Stocks.com Terms & Conditions Privacy Contact Us
All Information Provided Only For Education And Not To Be Used For Investing or Trading. See Terms & Conditions


One More Thing ... Get Best Stocks Delivered Daily!
Never Ever Miss A Move With Our Top Ten Stocks Lists
Find Best Stocks In Any Market - Bull or Bear Market
Take A Peek At Our Top Ten Stocks Lists: Daily, Weekly, Year-to-Date & Top Trends
Find Best Stocks In Any Market - Bull or Bear Market
Take A Peek At Our Top Ten Stocks Lists: Daily, Weekly, Year-to-Date & Top Trends
Financial Stocks With Best Up Trends [0-bearish to 100-bullish]: X [100], Brighthouse [100], Central and[100], Northrim BanCorp[100], Bank of America[100], Hagerty [100], Urban Edge[100], Global Blockchain[100], Ventas [100], Omega Healthcare[100], LPL [100]
Best Financial Stocks Year-to-Date:
Root [385.58%], Chimera [138.48%], Banco Macro[130.98%], SelectQuote [127.74%], Gladstone Capital[109.35%], Grupo Financiero[107.65%], Banco BBVA[107.54%], EverQuote [95.18%], Hippo [93.63%], Grupo Supervielle[78.33%], Vista Oil[64.18%] Best Financial Stocks This Week:
C3.ai [23%], Investors Title[19.4%], Banco BBVA[14.74%], Riverview Bancorp[14.25%], Banco Macro[13.7%], IRSA Inversiones[12.15%], Grupo Supervielle[11.73%], Metals Acquisition[10.74%], Grupo Financiero[10.41%], Fathom [10.24%], Vista Oil[9.32%] Best Financial Stocks Daily:
Riverview Bancorp[15.75%], Allied World[14.88%], Medical Properties[7.20%], X [6.14%], Franklin Street[5.32%], Washington Federal[5.16%], Iris Energy[5.13%], Ameris Bancorp[4.80%], Brighthouse [4.79%], Auburn National[4.70%], Central and[4.63%]