
 Login Sign Up


| |||||
 |  | ||||

| 12Stocks.com Market Intelligence |
Stock Charts, Performance & Trend Analysis for WSM
Williams-Sonoma, Inc.
|
| |||||||||||||||||||
 ➞
➞ ➞
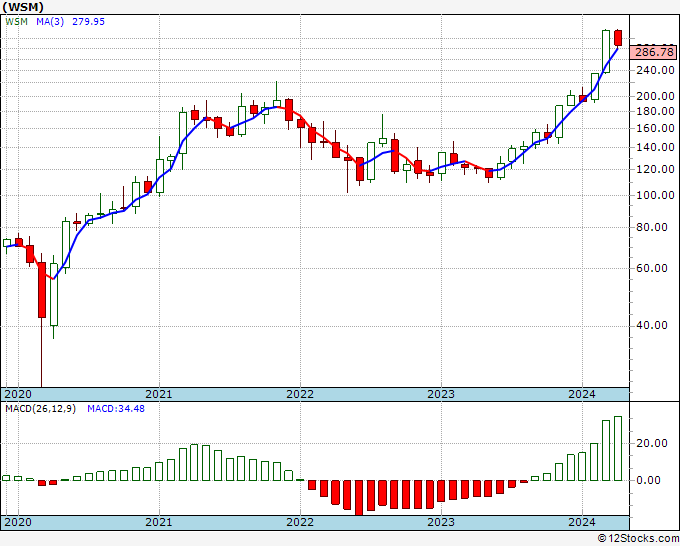
➞September 3, 2025 - The year-to-date (YTD) return or performance of Williams-Sonoma (WSM) is up 7.73% and is outperforming the overall stock market by 0.95%.
Recently, the weekly return of Williams-Sonoma (WSM) is down -4.01% and is underperforming the overall market by -3.56%.
Although long term trend for Williams-Sonoma, Inc. looks good, the mid term and short term trends are faltering.
The overall 12Stocks.com Smart Investing & Trading Score is 60 (measures stock trend from 0-bearish to 100-bullish) which puts WSM in short term neutral to bullish trend.
The Smart Investing & Trading Score from previous trading session is 30 and hence a significant improvement of trend. Scroll down for key technical charts, support & resistance levels and analysis for Williams-Sonoma.
| Stock Analysis for WSM | |||||||
| Name: Williams-Sonoma, Inc. | |||||||
| Sector: Services & Goods | |||||||
| SubSector: Home Furnishing Stores | |||||||
| In A Glance Williams-Sonoma (WSM) Stock Performance and Technical Trend Chart View | |||||||
| |||||||
Weekly WSM Technical Chart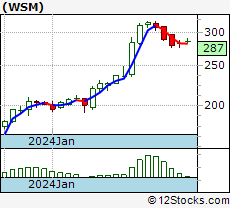 Daily WSM Technical Chart 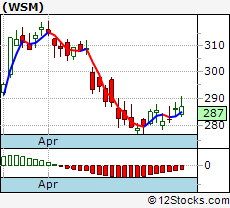 Add WSM To Watch List View List | |||||||
| 12Stocks.com Short Term Trend Analysis for WSM | |||||||
| 60 / 100 | |||||||
| The current technical trend score is 60 in a scale where 0 is bearish and 100 is bullish. | |||||||
| The technical trend score from previous session is 30. | |||||||
| Trend score updated daily. Not to be used for investing. | |||||||
Stocks Similar To Williams-Sonoma
|
|
|
|
Get the most comprehensive stock market coverage daily at 12Stocks.com ➞ Best Stocks Today ➞ Best Stocks Weekly ➞ Best Stocks Year-to-Date ➞ Best Stocks Trends ➞  Best Stocks Today 12Stocks.com Best Nasdaq Stocks ➞ Best S&P 500 Stocks ➞ Best Tech Stocks ➞ Best Biotech Stocks ➞ |
© 2025 12Stocks.com Terms & Conditions Privacy Contact Us
All Information Provided Only For Education And Not To Be Used For Investing or Trading. See Terms & Conditions


One More Thing ... Get Best Stocks Delivered Daily!
Never Ever Miss A Move With Our Top Ten Stocks Lists
Get Best Performing Stocks, Daily Market Trends & Insight
Take A Peek At Our Top Ten Stocks Lists: Daily, Weekly, Year-to-Date & Top Trends
Get Best Performing Stocks, Daily Market Trends & Insight
Take A Peek At Our Top Ten Stocks Lists: Daily, Weekly, Year-to-Date & Top Trends
Dow Stocks With Best Current Trends [0-bearish to 100-bullish]: McDonald s[100], American Express[100], Chevron [100], Travelers [90], Merck [90], Exxon Mobil[90], Boeing [90], Johnson & Johnson[80], Chase[70], Walt Disney[70] Best S&P 500 Stocks Year-to-Date Update:
Newmont [80.62%], Seagate [76.79%], Western Digital[64.74%], Dollar General[57.4%], Amphenol [53.61%], Dollar Tree[51.81%], IDEXX [51.78%], Wynn Resorts[45.9%], NVIDIA [42.68%], Tapestry [41.57%] Best Nasdaq 100 Stocks Weekly Update:
Biogen [8.6%], Alphabet [7.96%], Alphabet [7.58%], Pinduoduo [7.16%], Datadog [3.72%], MongoDB [3.71%], Trade Desk[3.03%], Ross Stores[2.82%], Workday [2.55%], AstraZeneca [2.54%] Today's Stock Market In A Nutshell:Euro [1.1%], Bonds [0.5%], Gold [0.5%], US Large Cap [0.3%], Emerging Markets [0.2%], US Small Cap [0.1%], US Mid Cap [-0.1%], Europe [-0.7%], US Dollar [-0.9%], China [-1.2%], Oil [-2.1%],