
 Login Sign Up


| |||||
 |  | ||||

| 12Stocks.com Market Intelligence |
Stock Charts, Performance & Trend Analysis for BSM
Black Stone Minerals L.P
|
| |||||||||||||||||||
 ➞
➞ ➞
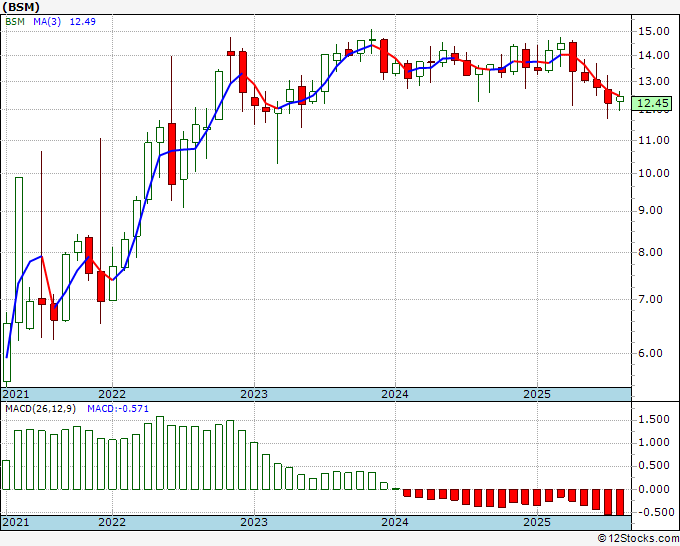
➞October 3, 2025 - The year-to-date (YTD) return or performance of Black Stone (BSM) is down -2.93484% and is underperforming the overall stock market by -17.69274%.
Recently, the weekly return of Black Stone (BSM) is down -1.2021% and is underperforming the overall market by -2.089249%.
Although long and mid term trends for Black Stone Minerals L.P looks good, the short term trends are deteriorating.
The overall 12Stocks.com Smart Investing & Trading Score is 80 (measures stock trend from 0-bearish to 100-bullish) which puts BSM in short term neutral to bullish trend.
The Smart Investing & Trading Score from previous trading session is 60 and an improvement of trend continues. Scroll down for key technical charts, support & resistance levels and analysis for Black Stone.
| Stock Analysis for BSM | |||||||
| Name: Black Stone Minerals L.P | |||||||
| Sector: Energy | |||||||
| SubSector: Oil & Gas E&P | |||||||
| In A Glance Black Stone (BSM) Stock Performance and Technical Trend Chart View | |||||||
| |||||||
Weekly BSM Technical Chart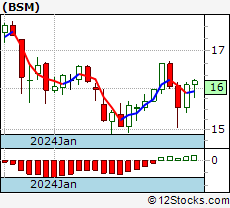 Daily BSM Technical Chart 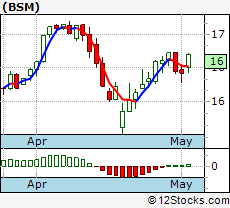 Add BSM To Watch List View List | |||||||
| 12Stocks.com Short Term Trend Analysis for BSM | |||||||
| 80 / 100 | |||||||
| The current technical trend score is 80 in a scale where 0 is bearish and 100 is bullish. | |||||||
| The technical trend score from previous session is 80. | |||||||
| Trend score updated daily. Not to be used for investing. | |||||||
Stocks Similar To Black Stone
|
|
|
|
Get the most comprehensive stock market coverage daily at 12Stocks.com ➞ Best Stocks Today ➞ Best Stocks Weekly ➞ Best Stocks Year-to-Date ➞ Best Stocks Trends ➞  Best Stocks Today 12Stocks.com Best Nasdaq Stocks ➞ Best S&P 500 Stocks ➞ Best Tech Stocks ➞ Best Biotech Stocks ➞ |
© 2025 12Stocks.com Terms & Conditions Privacy Contact Us
All Information Provided Only For Education And Not To Be Used For Investing or Trading. See Terms & Conditions


One More Thing ... Get Best Stocks Delivered Daily!
Never Ever Miss A Move With Our Top Ten Stocks Lists
Get Best Performing Stocks, Daily Market Trends & Insight
Take A Peek At Our Top Ten Stocks Lists: Daily, Weekly, Year-to-Date & Top Trends
Get Best Performing Stocks, Daily Market Trends & Insight
Take A Peek At Our Top Ten Stocks Lists: Daily, Weekly, Year-to-Date & Top Trends
Dow Stocks With Best Current Trends [0-bearish to 100-bullish]: Intel Corp[100], Caterpillar Inc[100], Unitedhealth [100], Johnson & Johnson[100], AMGEN Inc[100], Merck & Co Inc[100], 3M Co[90], Travelers [90], Nike Inc[90], [90] Best S&P 500 Stocks Year-to-Date Update:
Seagate [198.865%], Western Digital[181.204%], Newmont Corp[127.671%], Micron [110.87%], Lam Research[103.976%], Intel Corp[84.4708%], Warner Bros.[84.2%], NRG Energy[82.3658%], CVS Health[81.156%], Amphenol Corp[79.8571%] Best Nasdaq 100 Stocks Weekly Update:
Electronic Arts[20.1076%], Intel Corp[19.4747%], Lam Research[14.5184%], Micron [13.6232%], Biogen Inc[12.7697%], Astrazeneca [11.0138%], Applied Materials[11.0008%], Datadog Inc[10.9834%], Moderna Inc[9.62133%], ASML Holding[8.78936%] Today's Stock Market In A Nutshell:China [0.9%], US Small Cap [0.6%], Emerging Markets [0.5%], Europe [0.3%], US Dollar [0.1%], US Mid Cap [0.1%], India [0.1%], US Large Cap [0.1%], Bonds [0.1%], Euro [-0.1%], Gold [-0.3%], Oil [-2.2%],