
 Login Sign Up


| |||||
 |  | ||||

| 12Stocks.com Market Intelligence |
Stock Charts, Performance & Trend Analysis for BBY
Best Buy Co., Inc.
|
| |||||||||||||||||||
 ➞
➞ ➞
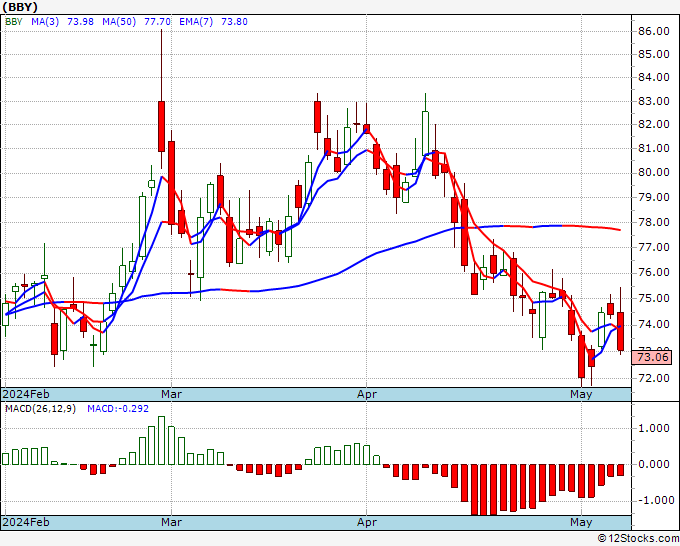
➞August 20, 2025 - The year-to-date (YTD) return or performance of Best Buy (BBY) is down -12.96% and is underperforming the overall stock market by -23.29%.
Recently, the weekly return of Best Buy (BBY) is up 7.86% and is outperforming the overall market by 5.8%.
All trends (long term, mid-term and short term) for Best Buy Co., Inc. looks good.
The overall 12Stocks.com Smart Investing & Trading Score is 90 (measures stock trend from 0-bearish to 100-bullish) which puts BBY in short term bullish trend.
The Smart Investing & Trading Score from previous trading session is 70 and hence an improvement of trend. Scroll down for key technical charts, support & resistance levels and analysis for Best Buy.
| Stock Analysis for BBY | |||||||
| Name: Best Buy Co., Inc. | |||||||
| Sector: Services & Goods | |||||||
| SubSector: Electronics Stores | |||||||
| In A Glance Best Buy (BBY) Stock Performance and Technical Trend Chart View | |||||||
| |||||||
Weekly BBY Technical Chart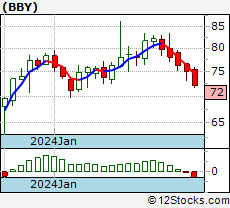 Daily BBY Technical Chart 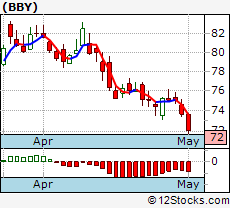 Add BBY To Watch List View List | |||||||
| 12Stocks.com Short Term Trend Analysis for BBY | |||||||
| 90 / 100 | |||||||
| The current technical trend score is 90 in a scale where 0 is bearish and 100 is bullish. | |||||||
| The technical trend score from previous session is 70. | |||||||
| Trend score updated daily. Not to be used for investing. | |||||||
Stocks Similar To Best Buy
|
|
|
|
Get the most comprehensive stock market coverage daily at 12Stocks.com ➞ Best Stocks Today ➞ Best Stocks Weekly ➞ Best Stocks Year-to-Date ➞ Best Stocks Trends ➞  Best Stocks Today 12Stocks.com Best Nasdaq Stocks ➞ Best S&P 500 Stocks ➞ Best Tech Stocks ➞ Best Biotech Stocks ➞ |
© 2025 12Stocks.com Terms & Conditions Privacy Contact Us
All Information Provided Only For Education And Not To Be Used For Investing or Trading. See Terms & Conditions


One More Thing ... Get Best Stocks Delivered Daily!
Never Ever Miss A Move With Our Top Ten Stocks Lists
Get Best Performing Stocks, Daily Market Trends & Insight
Take A Peek At Our Top Ten Stocks Lists: Daily, Weekly, Year-to-Date & Top Trends
Get Best Performing Stocks, Daily Market Trends & Insight
Take A Peek At Our Top Ten Stocks Lists: Daily, Weekly, Year-to-Date & Top Trends
Dow Stocks With Best Current Trends [0-bearish to 100-bullish]: Home Depot[100], Home Depot[100], Intel [100], Intel [100], Verizon [100], Verizon [100], Johnson & Johnson[100], Johnson & Johnson[100], [90], [90] Best S&P 500 Stocks Year-to-Date Update:
Newmont [86.18%], Newmont [86.18%], Seagate [84.27%], Seagate [84.27%], Tapestry [75.31%], Tapestry [75.31%], NRG Energy[73.7%], NRG Energy[73.7%], Western Digital[69.09%], Western Digital[69.09%] Best Nasdaq 100 Stocks Weekly Update:
Micron [14.24%], Micron [14.24%], Advanced Micro[13.06%], Advanced Micro[13.06%], NXP Semiconductors[11.95%], NXP Semiconductors[11.95%], Lam Research[11.26%], Lam Research[11.26%], ON Semiconductor[10.45%], ON Semiconductor[10.45%] Today's Stock Market In A Nutshell:Europe [14.7%], Europe [14.7%], Emerging Markets [9.6%], Emerging Markets [9.6%], US Small Cap [3.3%], US Small Cap [3.3%], US Mid Cap [2.3%], US Mid Cap [2.3%], Oil [2%], Oil [2%], US Large Cap [1.2%], US Large Cap [1.2%], Gold [1.2%], Gold [1.2%]