
 Login Sign Up


| |||||
 |  | ||||

| 12Stocks.com Market Intelligence |
Best Utilities Stocks
| In a hurry? Utilities Stocks Lists: Performance Trends Table, Stock Charts
Sort Utilities stocks: Daily, Weekly, Year-to-Date, Market Cap & Trends. Filter Utilities stocks list by size: All Utilities Large Mid-Range Small |
| 12Stocks.com Utilities Stocks Performances & Trends Daily | |||||||||
|
|  The overall Smart Investing & Trading Score is 10 (0-bearish to 100-bullish) which puts Utilities sector in short term bearish trend. The Smart Investing & Trading Score from previous trading session is 10 and an improvement of trend continues.
| ||||||||
Here are the Smart Investing & Trading Scores of the most requested Utilities stocks at 12Stocks.com (click stock name for detailed review):
|


| Consider signing up for our daily 12Stocks.com "Best Stocks Newsletter". You will never ever miss a big stock move again! |
| 12Stocks.com: Investing in Utilities sector with Stocks | |
|
The following table helps investors and traders sort through current performance and trends (as measured by Smart Investing & Trading Score) of various
stocks in the Utilities sector. Quick View: Move mouse or cursor over stock symbol (ticker) to view short-term Technical chart and over stock name to view long term chart. Click on  to add stock symbol to your watchlist and to add stock symbol to your watchlist and  to view watchlist. Click on any ticker or stock name for detailed market intelligence report for that stock. to view watchlist. Click on any ticker or stock name for detailed market intelligence report for that stock. |
12Stocks.com Performance of Stocks in Utilities Sector
| Ticker | Stock Name | Watchlist | Category | Recent Price | Smart Investing & Trading Score | Change % | YTD Change% |
| ES | Eversource Energy |   | Utilities - Regulated Electric | 63.08 | 10 | -0.54% | 12.06% |
| CMS | CMS Energy | | Utilities - Regulated Electric | 71.3 | 30 | -0.34% | 10.50% |
| EIX | Edison | | Utilities - Regulated Electric | 54.34 | 30 | -0.60% | 3.81% |
| BIP | Brookfield Infrastructure | | Utilities - | 31.45 | 20 | -0.43% | -2.98% |
| NI | NiSource | | Utilities - Regulated Gas | 40.3 | 10 | 1.18% | 10.36% |
| KEP | Korea Electric | | Utilities - Regulated Electric | 13.21 | 20 | 1.69% | 101.45% |
| EBR | Centrais Eletricas | | Utilities - Renewable | 8.24 | 100 | 1.04% | 38.15% |
| LNT | Alliant Energy | | Utilities - Regulated Electric | 64.37 | 30 | -0.54% | 11.10% |
| EVRG | Evergy | | Utilities - Regulated Electric | 71.55 | 60 | -0.04% | 13.80% |
| SBS | Companhia de | | Utilities - Regulated Water | 22.65 | 100 | 1.38% | 53.73% |
| WTRG | Essential | | Utilities - Regulated Water | 39.51 | 90 | -0.13% | 10.88% |
| PNW | Pinnacle West | | Utilities - Regulated Electric | 88.79 | 30 | -0.55% | 5.19% |
| AES | AES Corp | | Utilities - | 12.86 | 20 | 0.39% | 20.62% |
| OGE | Oge Energy | | Utilities - Regulated Electric | 44.66 | 10 | -0.68% | 12.24% |
| UGI | UGI Corp | | Utilities - Regulated Gas | 34.64 | 40 | -0.17% | 25.95% |
| BEP | Brookfield Renewable | | Utilities - Renewable | 25.38 | 10 | 0.16% | 12.24% |
| IDA | Idacorp | | Utilities - Regulated Electric | 125.10 | 60 | -0.18% | 18.24% |
| BEPC | Brookfield Renewable | | Utilities - Renewable | 33.70 | 40 | -0.12% | 23.94% |
| CWEN | Clearway Energy | | Utilities - Renewable | 29.81 | 20 | -1.91% | 17.81% |
| SWX | Southwest Gas | | Utilities - Regulated Gas | 79.88 | 60 | 0.24% | 10.16% |
| ORA | Ormat Technologies | | Utilities - Renewable | 91.89 | 80 | 0.35% | 37.19% |
| BIPC | Brookfield Infrastructure | | Utilities - Regulated Gas | 40.22 | 40 | -0.18% | -0.53% |
| ENIC | Enel Chile | | Utilities - Regulated Electric | 3.49 | 100 | -0.29% | 24.85% |
| NJR | New Jersey | | Utilities - Regulated Gas | 47.29 | 50 | 0.06% | 2.76% |
| POR | Portland General | | Utilities - Regulated Electric | 42.78 | 90 | -0.71% | -0.87% |
| For chart view version of above stock list: Chart View ➞ 0 - 25 , 25 - 50 , 50 - 75 , 75 - 100 | ||
 | Click To Change The Sort Order: By Market Cap or Company Size Performance: Year-to-date, Week and Day |  |
|
Get the most comprehensive stock market coverage daily at 12Stocks.com ➞ Best Stocks Today ➞ Best Stocks Weekly ➞ Best Stocks Year-to-Date ➞ Best Stocks Trends ➞  Best Stocks Today 12Stocks.com Best Nasdaq Stocks ➞ Best S&P 500 Stocks ➞ Best Tech Stocks ➞ Best Biotech Stocks ➞ |
| Detailed Overview of Utilities Stocks |
| Utilities Technical Overview, Leaders & Laggards, Top Utilities ETF Funds & Detailed Utilities Stocks List, Charts, Trends & More |
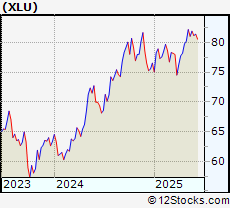
| Utilities Sector: Technical Analysis, Trends & YTD Performance | |
| Utilities sector is composed of stocks
from electric, gas, water, clean
utilities subsectors. Utilities sector, as represented by XLU, an exchange-traded fund [ETF] that holds basket of Utilities stocks (e.g, Duke Energy, Exelon) is up by 12.13% and is currently outperforming the overall market by 4.41% year-to-date. Below is a quick view of Technical charts and trends: |
|
 XLU Weekly Chart |
|
| Long Term Trend: Good | |
| Medium Term Trend: Not Good | |
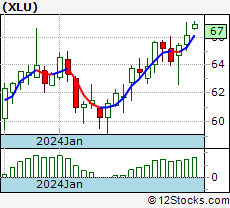
 XLU Daily Chart |
|
| Short Term Trend: Not Good | |
| Overall Trend Score: 10 | |
| YTD Performance: 12.13% | |
| **Trend Scores & Views Are Only For Educational Purposes And Not For Investing | |
| 12Stocks.com: Top Performing Utilities Sector Stocks | ||||||||||||||||||||||||||||||||||||||||||||||||
 The top performing Utilities sector stocks year to date are
Now, more recently, over last week, the top performing Utilities sector stocks on the move are


|
||||||||||||||||||||||||||||||||||||||||||||||||
| 12Stocks.com: Investing in Utilities Sector using Exchange Traded Funds | |
|
The following table shows list of key exchange traded funds (ETF) that
help investors track Utilities Index. For detailed view, check out our ETF Funds section of our website. Quick View: Move mouse or cursor over ETF symbol (ticker) to view short-term Technical chart and over ETF name to view long term chart. Click on ticker or stock name for detailed view. Click on to add stock symbol to your watchlist and to view watchlist. |
12Stocks.com List of ETFs that track Utilities Index
| Ticker | ETF Name | Watchlist | Recent Price | Smart Investing & Trading Score | Change % | Week % | Year-to-date % |
| 12Stocks.com: Charts, Trends, Fundamental Data and Performances of Utilities Stocks | |
|
We now take in-depth look at all Utilities stocks including charts, multi-period performances and overall trends (as measured by Smart Investing & Trading Score). One can sort Utilities stocks (click link to choose) by Daily, Weekly and by Year-to-Date performances. Also, one can sort by size of the company or by market capitalization. |
| Select Your Default Chart Type: | |||||
| |||||
| Click on stock symbol or name for detailed view. Click on to add stock symbol to your watchlist and to view watchlist. Quick View: Move mouse or cursor over "Daily" to quickly view daily Technical stock chart and over "Weekly" to view weekly Technical stock chart. | |||||
 | ES Eversource Energy |
| Sector: Utilities | |
| SubSector: Utilities - Regulated Electric | |
| MarketCap: 23576.9 Millions | |
| Recent Price: 63.08 Smart Investing & Trading Score: 10 | |
| Day Percent Change: -0.54% Day Change: -0.34 | |
| Week Change: -5.19% Year-to-date Change: 12.1% | |
| ES Links: Profile News Message Board | |
| Charts:- Daily , Weekly | |
| Add ES to Watchlist: View: Get Complete ES Trend Analysis ➞ | |
 | CMS CMS Energy Corporation |
| Sector: Utilities | |
| SubSector: Utilities - Regulated Electric | |
| MarketCap: 21417.4 Millions | |
| Recent Price: 71.3 Smart Investing & Trading Score: 30 | |
| Day Percent Change: -0.34% Day Change: -0.24 | |
| Week Change: -2.49% Year-to-date Change: 10.5% | |
| CMS Links: Profile News Message Board | |
| Charts:- Daily , Weekly | |
| Add CMS to Watchlist: View: Get Complete CMS Trend Analysis ➞ | |
 | EIX Edison International |
| Sector: Utilities | |
| SubSector: Utilities - Regulated Electric | |
| MarketCap: 20954.2 Millions | |
| Recent Price: 54.34 Smart Investing & Trading Score: 30 | |
| Day Percent Change: -0.6% Day Change: -0.33 | |
| Week Change: -2.27% Year-to-date Change: 3.8% | |
| EIX Links: Profile News Message Board | |
| Charts:- Daily , Weekly | |
| Add EIX to Watchlist: View: Get Complete EIX Trend Analysis ➞ | |
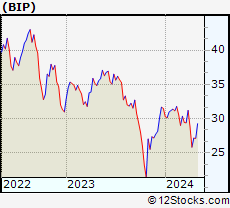 | BIP Brookfield Infrastructure Partners L.P |
| Sector: Utilities | |
| SubSector: Utilities - Diversified | |
| MarketCap: 19902.4 Millions | |
| Recent Price: 31.45 Smart Investing & Trading Score: 20 | |
| Day Percent Change: -0.43% Day Change: -0.13 | |
| Week Change: 0.57% Year-to-date Change: -3.0% | |
| BIP Links: Profile News Message Board | |
| Charts:- Daily , Weekly | |
| Add BIP to Watchlist: View: Get Complete BIP Trend Analysis ➞ | |
 | NI NiSource Inc |
| Sector: Utilities | |
| SubSector: Utilities - Regulated Gas | |
| MarketCap: 18989.6 Millions | |
| Recent Price: 40.3 Smart Investing & Trading Score: 10 | |
| Day Percent Change: 1.18% Day Change: 0.47 | |
| Week Change: -6.15% Year-to-date Change: 10.4% | |
| NI Links: Profile News Message Board | |
| Charts:- Daily , Weekly | |
| Add NI to Watchlist: View: Get Complete NI Trend Analysis ➞ | |
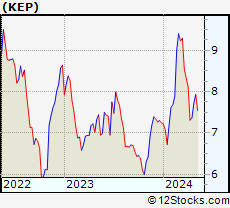 | KEP Korea Electric Power Corporation. ADR |
| Sector: Utilities | |
| SubSector: Utilities - Regulated Electric | |
| MarketCap: 17166.1 Millions | |
| Recent Price: 13.21 Smart Investing & Trading Score: 20 | |
| Day Percent Change: 1.69% Day Change: 0.23 | |
| Week Change: 0.8% Year-to-date Change: 101.5% | |
| KEP Links: Profile News Message Board | |
| Charts:- Daily , Weekly | |
| Add KEP to Watchlist: View: Get Complete KEP Trend Analysis ➞ | |
 | EBR Centrais Eletricas Brasileiras S.A. ADR |
| Sector: Utilities | |
| SubSector: Utilities - Renewable | |
| MarketCap: 16657.1 Millions | |
| Recent Price: 8.24 Smart Investing & Trading Score: 100 | |
| Day Percent Change: 1.04% Day Change: 0.08 | |
| Week Change: -5.26% Year-to-date Change: 38.2% | |
| EBR Links: Profile News Message Board | |
| Charts:- Daily , Weekly | |
| Add EBR to Watchlist: View: Get Complete EBR Trend Analysis ➞ | |
 | LNT Alliant Energy Corp |
| Sector: Utilities | |
| SubSector: Utilities - Regulated Electric | |
| MarketCap: 16605.3 Millions | |
| Recent Price: 64.37 Smart Investing & Trading Score: 30 | |
| Day Percent Change: -0.54% Day Change: -0.35 | |
| Week Change: -3.88% Year-to-date Change: 11.1% | |
| LNT Links: Profile News Message Board | |
| Charts:- Daily , Weekly | |
| Add LNT to Watchlist: View: Get Complete LNT Trend Analysis ➞ | |
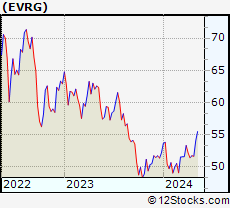 | EVRG Evergy Inc |
| Sector: Utilities | |
| SubSector: Utilities - Regulated Electric | |
| MarketCap: 16479.1 Millions | |
| Recent Price: 71.55 Smart Investing & Trading Score: 60 | |
| Day Percent Change: -0.04% Day Change: -0.03 | |
| Week Change: -1.04% Year-to-date Change: 13.8% | |
| EVRG Links: Profile News Message Board | |
| Charts:- Daily , Weekly | |
| Add EVRG to Watchlist: View: Get Complete EVRG Trend Analysis ➞ | |
 | SBS Companhia de Saneamento Basico do Estado de Sao Paulo. ADR |
| Sector: Utilities | |
| SubSector: Utilities - Regulated Water | |
| MarketCap: 15830.1 Millions | |
| Recent Price: 22.65 Smart Investing & Trading Score: 100 | |
| Day Percent Change: 1.38% Day Change: 0.29 | |
| Week Change: -1.71% Year-to-date Change: 53.7% | |
| SBS Links: Profile News Message Board | |
| Charts:- Daily , Weekly | |
| Add SBS to Watchlist: View: Get Complete SBS Trend Analysis ➞ | |
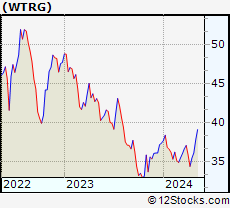 | WTRG Essential Utilities Inc |
| Sector: Utilities | |
| SubSector: Utilities - Regulated Water | |
| MarketCap: 11036.4 Millions | |
| Recent Price: 39.51 Smart Investing & Trading Score: 90 | |
| Day Percent Change: -0.13% Day Change: -0.05 | |
| Week Change: 0.38% Year-to-date Change: 10.9% | |
| WTRG Links: Profile News Message Board | |
| Charts:- Daily , Weekly | |
| Add WTRG to Watchlist: View: Get Complete WTRG Trend Analysis ➞ | |
 | PNW Pinnacle West Capital Corp |
| Sector: Utilities | |
| SubSector: Utilities - Regulated Electric | |
| MarketCap: 10629 Millions | |
| Recent Price: 88.79 Smart Investing & Trading Score: 30 | |
| Day Percent Change: -0.55% Day Change: -0.49 | |
| Week Change: -2.8% Year-to-date Change: 5.2% | |
| PNW Links: Profile News Message Board | |
| Charts:- Daily , Weekly | |
| Add PNW to Watchlist: View: Get Complete PNW Trend Analysis ➞ | |
 | AES AES Corp |
| Sector: Utilities | |
| SubSector: Utilities - Diversified | |
| MarketCap: 9206.8 Millions | |
| Recent Price: 12.86 Smart Investing & Trading Score: 20 | |
| Day Percent Change: 0.39% Day Change: 0.05 | |
| Week Change: -4.67% Year-to-date Change: 20.6% | |
| AES Links: Profile News Message Board | |
| Charts:- Daily , Weekly | |
| Add AES to Watchlist: View: Get Complete AES Trend Analysis ➞ | |
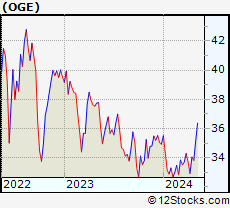 | OGE Oge Energy Corp |
| Sector: Utilities | |
| SubSector: Utilities - Regulated Electric | |
| MarketCap: 8891.6 Millions | |
| Recent Price: 44.66 Smart Investing & Trading Score: 10 | |
| Day Percent Change: -0.68% Day Change: -0.31 | |
| Week Change: -1.55% Year-to-date Change: 12.2% | |
| OGE Links: Profile News Message Board | |
| Charts:- Daily , Weekly | |
| Add OGE to Watchlist: View: Get Complete OGE Trend Analysis ➞ | |
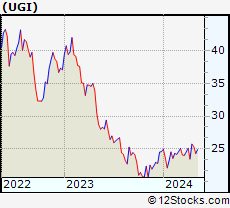 | UGI UGI Corp |
| Sector: Utilities | |
| SubSector: Utilities - Regulated Gas | |
| MarketCap: 7429.93 Millions | |
| Recent Price: 34.64 Smart Investing & Trading Score: 40 | |
| Day Percent Change: -0.17% Day Change: -0.06 | |
| Week Change: -2.69% Year-to-date Change: 26.0% | |
| UGI Links: Profile News Message Board | |
| Charts:- Daily , Weekly | |
| Add UGI to Watchlist: View: Get Complete UGI Trend Analysis ➞ | |
 | BEP Brookfield Renewable Partners LP |
| Sector: Utilities | |
| SubSector: Utilities - Renewable | |
| MarketCap: 7061.69 Millions | |
| Recent Price: 25.38 Smart Investing & Trading Score: 10 | |
| Day Percent Change: 0.16% Day Change: 0.04 | |
| Week Change: 1.85% Year-to-date Change: 12.2% | |
| BEP Links: Profile News Message Board | |
| Charts:- Daily , Weekly | |
| Add BEP to Watchlist: View: Get Complete BEP Trend Analysis ➞ | |
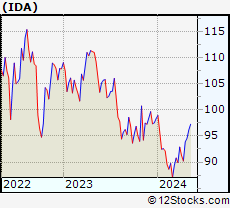 | IDA Idacorp, Inc |
| Sector: Utilities | |
| SubSector: Utilities - Regulated Electric | |
| MarketCap: 6773.57 Millions | |
| Recent Price: 125.10 Smart Investing & Trading Score: 60 | |
| Day Percent Change: -0.18% Day Change: -0.23 | |
| Week Change: 0.53% Year-to-date Change: 18.2% | |
| IDA Links: Profile News Message Board | |
| Charts:- Daily , Weekly | |
| Add IDA to Watchlist: View: Get Complete IDA Trend Analysis ➞ | |
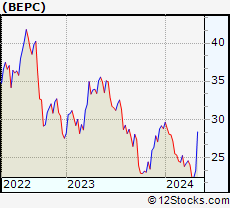 | BEPC Brookfield Renewable Corp |
| Sector: Utilities | |
| SubSector: Utilities - Renewable | |
| MarketCap: 5966.14 Millions | |
| Recent Price: 33.70 Smart Investing & Trading Score: 40 | |
| Day Percent Change: -0.12% Day Change: -0.04 | |
| Week Change: 1.24% Year-to-date Change: 23.9% | |
| BEPC Links: Profile News Message Board | |
| Charts:- Daily , Weekly | |
| Add BEPC to Watchlist: View: Get Complete BEPC Trend Analysis ➞ | |
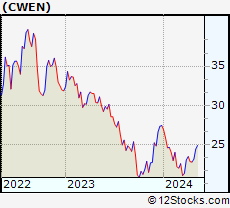 | CWEN Clearway Energy Inc |
| Sector: Utilities | |
| SubSector: Utilities - Renewable | |
| MarketCap: 5745.58 Millions | |
| Recent Price: 29.81 Smart Investing & Trading Score: 20 | |
| Day Percent Change: -1.91% Day Change: -0.58 | |
| Week Change: 1.64% Year-to-date Change: 17.8% | |
| CWEN Links: Profile News Message Board | |
| Charts:- Daily , Weekly | |
| Add CWEN to Watchlist: View: Get Complete CWEN Trend Analysis ➞ | |
 | SWX Southwest Gas Holdings Inc |
| Sector: Utilities | |
| SubSector: Utilities - Regulated Gas | |
| MarketCap: 5657.57 Millions | |
| Recent Price: 79.88 Smart Investing & Trading Score: 60 | |
| Day Percent Change: 0.24% Day Change: 0.18 | |
| Week Change: -3.65% Year-to-date Change: 10.2% | |
| SWX Links: Profile News Message Board | |
| Charts:- Daily , Weekly | |
| Add SWX to Watchlist: View: Get Complete SWX Trend Analysis ➞ | |
 | ORA Ormat Technologies Inc |
| Sector: Utilities | |
| SubSector: Utilities - Renewable | |
| MarketCap: 5531.91 Millions | |
| Recent Price: 91.89 Smart Investing & Trading Score: 80 | |
| Day Percent Change: 0.35% Day Change: 0.32 | |
| Week Change: 4.8% Year-to-date Change: 37.2% | |
| ORA Links: Profile News Message Board | |
| Charts:- Daily , Weekly | |
| Add ORA to Watchlist: View: Get Complete ORA Trend Analysis ➞ | |
 | BIPC Brookfield Infrastructure Corp |
| Sector: Utilities | |
| SubSector: Utilities - Regulated Gas | |
| MarketCap: 5270.51 Millions | |
| Recent Price: 40.22 Smart Investing & Trading Score: 40 | |
| Day Percent Change: -0.18% Day Change: -0.07 | |
| Week Change: 1.06% Year-to-date Change: -0.5% | |
| BIPC Links: Profile News Message Board | |
| Charts:- Daily , Weekly | |
| Add BIPC to Watchlist: View: Get Complete BIPC Trend Analysis ➞ | |
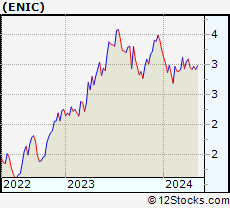 | ENIC Enel Chile S.A. ADR |
| Sector: Utilities | |
| SubSector: Utilities - Regulated Electric | |
| MarketCap: 5118.32 Millions | |
| Recent Price: 3.49 Smart Investing & Trading Score: 100 | |
| Day Percent Change: -0.29% Day Change: -0.01 | |
| Week Change: 0% Year-to-date Change: 24.9% | |
| ENIC Links: Profile News Message Board | |
| Charts:- Daily , Weekly | |
| Add ENIC to Watchlist: View: Get Complete ENIC Trend Analysis ➞ | |
 | NJR New Jersey Resources Corporation |
| Sector: Utilities | |
| SubSector: Utilities - Regulated Gas | |
| MarketCap: 4726.24 Millions | |
| Recent Price: 47.29 Smart Investing & Trading Score: 50 | |
| Day Percent Change: 0.06% Day Change: 0.03 | |
| Week Change: -1.01% Year-to-date Change: 2.8% | |
| NJR Links: Profile News Message Board | |
| Charts:- Daily , Weekly | |
| Add NJR to Watchlist: View: Get Complete NJR Trend Analysis ➞ | |
 | POR Portland General Electric Co |
| Sector: Utilities | |
| SubSector: Utilities - Regulated Electric | |
| MarketCap: 4690.37 Millions | |
| Recent Price: 42.78 Smart Investing & Trading Score: 90 | |
| Day Percent Change: -0.71% Day Change: -0.3 | |
| Week Change: -0.99% Year-to-date Change: -0.9% | |
| POR Links: Profile News Message Board | |
| Charts:- Daily , Weekly | |
| Add POR to Watchlist: View: Get Complete POR Trend Analysis ➞ | |
| For tabular summary view of above stock list: Summary View ➞ 0 - 25 , 25 - 50 , 50 - 75 , 75 - 100 | ||
| Click To Change The Sort Order: By Market Cap or Company Size Performance: Year-to-date, Week and Day | |
| Select Chart Type: | ||
|
Best Stocks Today 12Stocks.com |
© 2025 12Stocks.com Terms & Conditions Privacy Contact Us
All Information Provided Only For Education And Not To Be Used For Investing or Trading. See Terms & Conditions


One More Thing ... Get Best Stocks Delivered Daily!
Never Ever Miss A Move With Our Top Ten Stocks Lists
Find Best Stocks In Any Market - Bull or Bear Market
Take A Peek At Our Top Ten Stocks Lists: Daily, Weekly, Year-to-Date & Top Trends
Find Best Stocks In Any Market - Bull or Bear Market
Take A Peek At Our Top Ten Stocks Lists: Daily, Weekly, Year-to-Date & Top Trends
Utilities Stocks With Best Up Trends [0-bearish to 100-bullish]: Companhia de[100], Centrais Eletricas[100], Enel Chile[100], Pure Cycle[100], Cia Energetica[100], Consolidated Water[90], California Water[90], Chesapeake [90], Essential [90], Portland General[90], NorthWestern Energy[90]
Best Utilities Stocks Year-to-Date:
Korea Electric[101.45%], Companhia de[53.73%], Kenon [51.55%], Enlight Renewable[50.94%], Cia Paranaense[50.31%], NRG Energy[44.9%], Vistra Corp[38.43%], Centrais Eletricas[38.15%], Ormat Technologies[37.19%], Algonquin Power[33.51%], Consolidated Water[27.58%] Best Utilities Stocks This Week:
Ormat Technologies[4.8%], Stem [4.01%], Enlight Renewable[3.09%], Energy Vault[2.55%], Brookfield Renewable[1.85%], NorthWestern Energy[1.84%], Clearway Energy[1.64%], York Water[1.27%], Brookfield Renewable[1.24%], NRG Energy[1.19%], Brookfield Infrastructure[1.06%] Best Utilities Stocks Daily:
Cadiz [2.99%], Cadiz [2.53%], Korea Electric[1.69%], Companhia de[1.38%], NiSource [1.18%], Central Puerto[1.09%], RGC Resources[1.06%], Centrais Eletricas[1.04%], American Water[0.98%], Atmos Energy[0.44%], Centerpoint Energy[0.43%]