
 Login Sign Up


| |||||
 |  | ||||

| 12Stocks.com Market Intelligence |
Best Tech Stocks
| In a hurry? Tech Stocks Lists: Performance & Trends, Stock Charts, FANG Stocks
Sort Tech stocks: Daily, Weekly, Year-to-Date, Market Cap & Trends. Filter Tech stocks list by size:All Tech Large Mid-Range Small and MicroCap |
| 12Stocks.com Tech Stocks Performances & Trends Daily | |||||||||
|
|  The overall Smart Investing & Trading Score is 100 (0-bearish to 100-bullish) which puts Technology sector in short term bullish trend. The Smart Investing & Trading Score from previous trading session is 90 and an improvement of trend continues.
| ||||||||
Here are the Smart Investing & Trading Scores of the most requested Technology stocks at 12Stocks.com (click stock name for detailed review):
|


| 12Stocks.com: Investing in Technology sector with Stocks | |
|
The following table helps investors and traders sort through current performance and trends (as measured by Smart Investing & Trading Score) of various
stocks in the Tech sector. Quick View: Move mouse or cursor over stock symbol (ticker) to view short-term technical chart and over stock name to view long term chart. Click on  to add stock symbol to your watchlist and to add stock symbol to your watchlist and  to view watchlist. Click on any ticker or stock name for detailed market intelligence report for that stock. to view watchlist. Click on any ticker or stock name for detailed market intelligence report for that stock. |
12Stocks.com Performance of Stocks in Tech Sector
| Ticker | Stock Name | Watchlist | Category | Recent Price | Smart Investing & Trading Score | Change % | YTD Change% |
| TNGO | Tangoe |   | Software | 0.91 | 10 | 1.11% | 0.00% |
| EGAN | eGain Corp | | Software - | 9.05 | 80 | 2.38% | 47.39% |
| DMRC | Digimarc | | Software - | 9.62 | 40 | -2.04% | -76.07% |
| NIHD | NII | | Wireless | 2.64 | 20 | -4.00% | 0.00% |
| EXFY | Expensify | | Software - | 1.76 | 48 | 1.75% | -48.06% |
| CRNT | Ceragon Networks | | Communication | 2.33 | 70 | 2.19% | -52.06% |
| ICAD | iCAD | | Software | 3.87 | 40 | 3.75% | 94.47% |
| MXWL | Maxwell | | Electronics | 44.34 | 100 | 0.02% | 0.00% |
| LUNA | Luna Innovations | | Instruments | 0.77 | 20 | -23.00% | -61.69% |
| NH | NantHealth | | Healthcare Information | 13.02 | 70 | -0.31% | 0.00% |
| SEAT | Vivid Seats | | Internet Content & Information | 15.93 | 40 | -1.12% | -82.42% |
| SSTI | SoundThinking | | Software - | 12.01 | 30 | -0.25% | -5.88% |
| LFGR | Leaf | | Internet | 11.15 | 10 | 0.00% | 0.00% |
| NTP | Nam Tai | | Electronics | 67.76 | 70 | 0.68% | 0.00% |
| RSYS | RadiSys | | Computer Based | 43.92 | 70 | -0.45% | 0.00% |
| SFUN | Fang | | Internet | 85.00 | 60 | -6.75% | 0.00% |
| MINDP | Mitcham Industries | | Instruments | 13.30 | 20 | 0.00% | 0.00% |
| MRAM | Everspin | | Semiconductors | 10.42 | 100 | 3.68% | 62.56% |
| VERI | Veritone | | Software - Infrastructure | 5.29 | 90 | 9.52% | 65.31% |
| AXTI | AXT | | Semiconductor | 4.71 | 60 | -4.18% | 114.84% |
| DHX | DHI | | Software - | 2.67 | 10 | 1.14% | 52.57% |
| GAIA | Gaia | | Entertainment | 5.51 | 20 | -3.94% | 20.39% |
| RELL | Richardson Electronics | | Electronic Components | 9.52 | 20 | -0.94% | -31.52% |
| RVLT | Revolution Lighting | | Electronics | 2.72 | 10 | -2.51% | 0.00% |
| REKR | Rekor Systems | | Software - Infrastructure | 1.62 | 50 | 0.00% | -6.90% |
| For chart view version of above stock list: Chart View ➞ 0 - 25 , 25 - 50 , 50 - 75 , 75 - 100 , 100 - 125 , 125 - 150 , 150 - 175 , 175 - 200 , 200 - 225 , 225 - 250 , 250 - 275 , 275 - 300 , 300 - 325 , 325 - 350 , 350 - 375 | ||
 | Click To Change The Sort Order: By Market Cap or Company Size Performance: Year-to-date, Week and Day |  |
|
Get the most comprehensive stock market coverage daily at 12Stocks.com ➞ Best Stocks Today ➞ Best Stocks Weekly ➞ Best Stocks Year-to-Date ➞ Best Stocks Trends ➞  Best Stocks Today 12Stocks.com Best Nasdaq Stocks ➞ Best S&P 500 Stocks ➞ Best Tech Stocks ➞ Best Biotech Stocks ➞ |
| Detailed Overview of Tech Stocks |
| Tech Technical Overview, Leaders & Laggards, Top Tech ETF Funds & Detailed Tech Stocks List, Charts, Trends & More |
| Tech Sector: Technical Analysis, Trends & YTD Performance | |
| Technology sector is composed of stocks
from semiconductors, software, web, social media
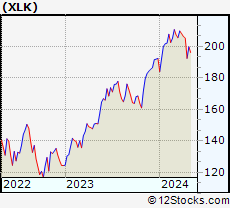
and services subsectors. Technology sector, as represented by XLK, an exchange-traded fund [ETF] that holds basket of tech stocks (e.g, Intel, Google) is up by 23.7823% and is currently outperforming the overall market by 9.0244% year-to-date. Below is a quick view of technical charts and trends: |
|
 XLK Weekly Chart |
|
| Long Term Trend: Very Good | |
| Medium Term Trend: Good | |
 XLK Daily Chart |
|
| Short Term Trend: Very Good | |
| Overall Trend Score: 100 | |
| YTD Performance: 23.7823% | |
| **Trend Scores & Views Are Only For Educational Purposes And Not For Investing | |
| 12Stocks.com: Top Performing Technology Sector Stocks | ||||||||||||||||||||||||||||||||||||||||||||||||
 The top performing Technology sector stocks year to date are
Now, more recently, over last week, the top performing Technology sector stocks on the move are


|
||||||||||||||||||||||||||||||||||||||||||||||||
| 12Stocks.com: Investing in Tech Sector using Exchange Traded Funds | |
|
The following table shows list of key exchange traded funds (ETF) that
help investors track Tech Index. For detailed view, check out our ETF Funds section of our website. Quick View: Move mouse or cursor over ETF symbol (ticker) to view short-term technical chart and over ETF name to view long term chart. Click on ticker or stock name for detailed view. Click on to add stock symbol to your watchlist and to view watchlist. |
12Stocks.com List of ETFs that track Tech Index
| Ticker | ETF Name | Watchlist | Recent Price | Smart Investing & Trading Score | Change % | Week % | Year-to-date % |
| IGN | Tech-Multimd Ntwk | | 53.86 | 40 | 0.918119 | -20.6435 | 0% |
| 12Stocks.com: Charts, Trends, Fundamental Data and Performances of Tech Stocks | |
|
We now take in-depth look at all Tech stocks including charts, multi-period performances and overall trends (as measured by Smart Investing & Trading Score). One can sort Tech stocks (click link to choose) by Daily, Weekly and by Year-to-Date performances. Also, one can sort by size of the company or by market capitalization. |
| Select Your Default Chart Type: | |||||
| |||||
| Click on stock symbol or name for detailed view. Click on to add stock symbol to your watchlist and to view watchlist. Quick View: Move mouse or cursor over "Daily" to quickly view daily technical stock chart and over "Weekly" to view weekly technical stock chart. | |||||


 | TNGO Tangoe, Inc. |
| Sector: Technology | |
| SubSector: Business Software & Services | |
| MarketCap: 182.17 Millions | |
| Recent Price: 0.91 Smart Investing & Trading Score: 10 | |
| Day Percent Change: 1.11111% Day Change: -9999 | |
| Week Change: -69.4631% Year-to-date Change: 0.0% | |
| TNGO Links: Profile News Message Board | |
| Charts:- Daily , Weekly | |
| Add TNGO to Watchlist: View: Get Complete TNGO Trend Analysis ➞ | |
 | EGAN eGain Corp |
| Sector: Technology | |
| SubSector: Software - Application | |
| MarketCap: 181.03 Millions | |
| Recent Price: 9.05 Smart Investing & Trading Score: 80 | |
| Day Percent Change: 2.37557% Day Change: 0.04 | |
| Week Change: 1.91441% Year-to-date Change: 47.4% | |
| EGAN Links: Profile News Message Board | |
| Charts:- Daily , Weekly | |
| Add EGAN to Watchlist: View: Get Complete EGAN Trend Analysis ➞ | |
 | DMRC Digimarc Corporation |
| Sector: Technology | |
| SubSector: Software - Application | |
| MarketCap: 180.82 Millions | |
| Recent Price: 9.62 Smart Investing & Trading Score: 40 | |
| Day Percent Change: -2.03666% Day Change: 0.09 | |
| Week Change: -2.92634% Year-to-date Change: -76.1% | |
| DMRC Links: Profile News Message Board | |
| Charts:- Daily , Weekly | |
| Add DMRC to Watchlist: View: Get Complete DMRC Trend Analysis ➞ | |
 | NIHD NII Holdings, Inc. |
| Sector: Technology | |
| SubSector: Wireless Communications | |
| MarketCap: 179.22 Millions | |
| Recent Price: 2.64 Smart Investing & Trading Score: 20 | |
| Day Percent Change: -4% Day Change: -9999 | |
| Week Change: -57.76% Year-to-date Change: 0.0% | |
| NIHD Links: Profile News Message Board | |
| Charts:- Daily , Weekly | |
| Add NIHD to Watchlist: View: Get Complete NIHD Trend Analysis ➞ | |
 | EXFY Expensify Inc |
| Sector: Technology | |
| SubSector: Software - Application | |
| MarketCap: 177.89 Millions | |
| Recent Price: 1.76 Smart Investing & Trading Score: 48 | |
| Day Percent Change: 1.75% Day Change: 0.03 | |
| Week Change: -3.33% Year-to-date Change: -48.1% | |
| EXFY Links: Profile News Message Board | |
| Charts:- Daily , Weekly | |
| Add EXFY to Watchlist: View: Get Complete EXFY Trend Analysis ➞ | |
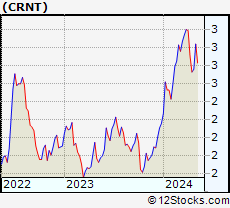 | CRNT Ceragon Networks Ltd |
| Sector: Technology | |
| SubSector: Communication Equipment | |
| MarketCap: 177.68 Millions | |
| Recent Price: 2.33 Smart Investing & Trading Score: 70 | |
| Day Percent Change: 2.19298% Day Change: 0.02 | |
| Week Change: -5.66802% Year-to-date Change: -52.1% | |
| CRNT Links: Profile News Message Board | |
| Charts:- Daily , Weekly | |
| Add CRNT to Watchlist: View: Get Complete CRNT Trend Analysis ➞ | |
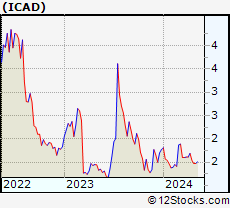 | ICAD iCAD, Inc. |
| Sector: Technology | |
| SubSector: Technical & System Software | |
| MarketCap: 174.8 Millions | |
| Recent Price: 3.87 Smart Investing & Trading Score: 40 | |
| Day Percent Change: 3.75335% Day Change: -9999 | |
| Week Change: 4.03226% Year-to-date Change: 94.5% | |
| ICAD Links: Profile News Message Board | |
| Charts:- Daily , Weekly | |
| Add ICAD to Watchlist: View: Get Complete ICAD Trend Analysis ➞ | |
 | MXWL Maxwell Technologies, Inc. |
| Sector: Technology | |
| SubSector: Diversified Electronics | |
| MarketCap: 170.6 Millions | |
| Recent Price: 44.34 Smart Investing & Trading Score: 100 | |
| Day Percent Change: 0.0225581% Day Change: -9999 | |
| Week Change: 162.057% Year-to-date Change: 0.0% | |
| MXWL Links: Profile News Message Board | |
| Charts:- Daily , Weekly | |
| Add MXWL to Watchlist: View: Get Complete MXWL Trend Analysis ➞ | |
 | LUNA Luna Innovations Incorporated |
| Sector: Technology | |
| SubSector: Scientific & Technical Instruments | |
| MarketCap: 166.353 Millions | |
| Recent Price: 0.77 Smart Investing & Trading Score: 20 | |
| Day Percent Change: -23% Day Change: -9999 | |
| Week Change: 14.9254% Year-to-date Change: -61.7% | |
| LUNA Links: Profile News Message Board | |
| Charts:- Daily , Weekly | |
| Add LUNA to Watchlist: View: Get Complete LUNA Trend Analysis ➞ | |
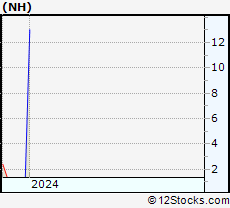 | NH NantHealth, Inc. |
| Sector: Technology | |
| SubSector: Healthcare Information Services | |
| MarketCap: 165.355 Millions | |
| Recent Price: 13.02 Smart Investing & Trading Score: 70 | |
| Day Percent Change: -0.306279% Day Change: -9999 | |
| Week Change: 3114.02% Year-to-date Change: 0.0% | |
| NH Links: Profile News Message Board | |
| Charts:- Daily , Weekly | |
| Add NH to Watchlist: View: Get Complete NH Trend Analysis ➞ | |
 | SEAT Vivid Seats Inc |
| Sector: Technology | |
| SubSector: Internet Content & Information | |
| MarketCap: 163.9 Millions | |
| Recent Price: 15.93 Smart Investing & Trading Score: 40 | |
| Day Percent Change: -1.11732% Day Change: -0.32 | |
| Week Change: 2.18089% Year-to-date Change: -82.4% | |
| SEAT Links: Profile News Message Board | |
| Charts:- Daily , Weekly | |
| Add SEAT to Watchlist: View: Get Complete SEAT Trend Analysis ➞ | |
 | SSTI SoundThinking Inc |
| Sector: Technology | |
| SubSector: Software - Application | |
| MarketCap: 157.33 Millions | |
| Recent Price: 12.01 Smart Investing & Trading Score: 30 | |
| Day Percent Change: -0.249169% Day Change: 0.09 | |
| Week Change: -2.1987% Year-to-date Change: -5.9% | |
| SSTI Links: Profile News Message Board | |
| Charts:- Daily , Weekly | |
| Add SSTI to Watchlist: View: Get Complete SSTI Trend Analysis ➞ | |
 | LFGR Leaf Group Ltd. |
| Sector: Technology | |
| SubSector: Internet Information Providers | |
| MarketCap: 156.85 Millions | |
| Recent Price: 11.15 Smart Investing & Trading Score: 10 | |
| Day Percent Change: 0% Day Change: -9999 | |
| Week Change: 0% Year-to-date Change: 0.0% | |
| LFGR Links: Profile News Message Board | |
| Charts:- Daily , Weekly | |
| Add LFGR to Watchlist: View: Get Complete LFGR Trend Analysis ➞ | |
 | NTP Nam Tai Property Inc. |
| Sector: Technology | |
| SubSector: Diversified Electronics | |
| MarketCap: 154.296 Millions | |
| Recent Price: 67.76 Smart Investing & Trading Score: 70 | |
| Day Percent Change: 0.683507% Day Change: -9999 | |
| Week Change: 5033.33% Year-to-date Change: 0.0% | |
| NTP Links: Profile News Message Board | |
| Charts:- Daily , Weekly | |
| Add NTP to Watchlist: View: Get Complete NTP Trend Analysis ➞ | |
 | RSYS RadiSys Corporation |
| Sector: Technology | |
| SubSector: Computer Based Systems | |
| MarketCap: 153.48 Millions | |
| Recent Price: 43.92 Smart Investing & Trading Score: 70 | |
| Day Percent Change: -0.453309% Day Change: -9999 | |
| Week Change: 919.026% Year-to-date Change: 0.0% | |
| RSYS Links: Profile News Message Board | |
| Charts:- Daily , Weekly | |
| Add RSYS to Watchlist: View: Get Complete RSYS Trend Analysis ➞ | |
 | SFUN Fang Holdings Limited |
| Sector: Technology | |
| SubSector: Internet Information Providers | |
| MarketCap: 152.68 Millions | |
| Recent Price: 85.00 Smart Investing & Trading Score: 60 | |
| Day Percent Change: -6.74712% Day Change: -9999 | |
| Week Change: 4150% Year-to-date Change: 0.0% | |
| SFUN Links: Profile News Message Board | |
| Charts:- Daily , Weekly | |
| Add SFUN to Watchlist: View: Get Complete SFUN Trend Analysis ➞ | |
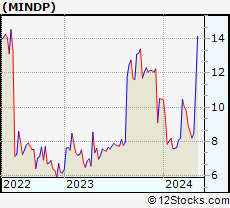 | MINDP Mitcham Industries, Inc. |
| Sector: Technology | |
| SubSector: Scientific & Technical Instruments | |
| MarketCap: 152.453 Millions | |
| Recent Price: 13.30 Smart Investing & Trading Score: 20 | |
| Day Percent Change: 0% Day Change: -9999 | |
| Week Change: 0% Year-to-date Change: 0.0% | |
| MINDP Links: Profile News Message Board | |
| Charts:- Daily , Weekly | |
| Add MINDP to Watchlist: View: Get Complete MINDP Trend Analysis ➞ | |
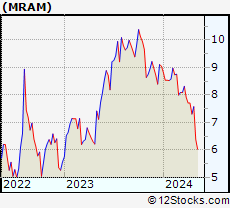 | MRAM Everspin Technologies Inc |
| Sector: Technology | |
| SubSector: Semiconductors | |
| MarketCap: 147.29 Millions | |
| Recent Price: 10.42 Smart Investing & Trading Score: 100 | |
| Day Percent Change: 3.68159% Day Change: 0.15 | |
| Week Change: 26.764% Year-to-date Change: 62.6% | |
| MRAM Links: Profile News Message Board | |
| Charts:- Daily , Weekly | |
| Add MRAM to Watchlist: View: Get Complete MRAM Trend Analysis ➞ | |
 | VERI Veritone Inc |
| Sector: Technology | |
| SubSector: Software - Infrastructure | |
| MarketCap: 147.02 Millions | |
| Recent Price: 5.29 Smart Investing & Trading Score: 90 | |
| Day Percent Change: 9.52381% Day Change: -0.01 | |
| Week Change: -4.85612% Year-to-date Change: 65.3% | |
| VERI Links: Profile News Message Board | |
| Charts:- Daily , Weekly | |
| Add VERI to Watchlist: View: Get Complete VERI Trend Analysis ➞ | |
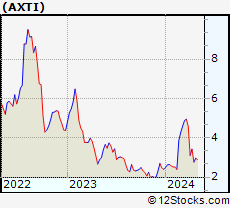 | AXTI AXT Inc |
| Sector: Technology | |
| SubSector: Semiconductor Equipment & Materials | |
| MarketCap: 143.45 Millions | |
| Recent Price: 4.71 Smart Investing & Trading Score: 60 | |
| Day Percent Change: -4.17515% Day Change: -0.03 | |
| Week Change: -1.97917% Year-to-date Change: 114.8% | |
| AXTI Links: Profile News Message Board | |
| Charts:- Daily , Weekly | |
| Add AXTI to Watchlist: View: Get Complete AXTI Trend Analysis ➞ | |
 | DHX DHI Group Inc |
| Sector: Technology | |
| SubSector: Software - Application | |
| MarketCap: 142.59 Millions | |
| Recent Price: 2.67 Smart Investing & Trading Score: 10 | |
| Day Percent Change: 1.13636% Day Change: -0.16 | |
| Week Change: -4.98221% Year-to-date Change: 52.6% | |
| DHX Links: Profile News Message Board | |
| Charts:- Daily , Weekly | |
| Add DHX to Watchlist: View: Get Complete DHX Trend Analysis ➞ | |
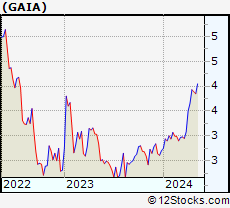 | GAIA Gaia Inc |
| Sector: Technology | |
| SubSector: Entertainment | |
| MarketCap: 139.61 Millions | |
| Recent Price: 5.51 Smart Investing & Trading Score: 20 | |
| Day Percent Change: -3.93728% Day Change: -0.32 | |
| Week Change: -10.9208% Year-to-date Change: 20.4% | |
| GAIA Links: Profile News Message Board | |
| Charts:- Daily , Weekly | |
| Add GAIA to Watchlist: View: Get Complete GAIA Trend Analysis ➞ | |
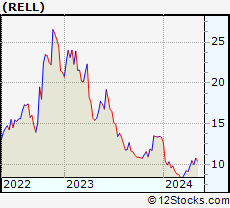 | RELL Richardson Electronics, Ltd |
| Sector: Technology | |
| SubSector: Electronic Components | |
| MarketCap: 139.59 Millions | |
| Recent Price: 9.52 Smart Investing & Trading Score: 20 | |
| Day Percent Change: -0.936524% Day Change: -0.13 | |
| Week Change: -4.8% Year-to-date Change: -31.5% | |
| RELL Links: Profile News Message Board | |
| Charts:- Daily , Weekly | |
| Add RELL to Watchlist: View: Get Complete RELL Trend Analysis ➞ | |
 | RVLT Revolution Lighting Technologies, Inc. |
| Sector: Technology | |
| SubSector: Diversified Electronics | |
| MarketCap: 139.05 Millions | |
| Recent Price: 2.72 Smart Investing & Trading Score: 10 | |
| Day Percent Change: -2.50896% Day Change: -9999 | |
| Week Change: -81.9509% Year-to-date Change: 0.0% | |
| RVLT Links: Profile News Message Board | |
| Charts:- Daily , Weekly | |
| Add RVLT to Watchlist: View: Get Complete RVLT Trend Analysis ➞ | |
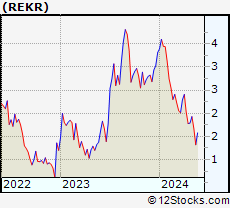 | REKR Rekor Systems Inc |
| Sector: Technology | |
| SubSector: Software - Infrastructure | |
| MarketCap: 137.7 Millions | |
| Recent Price: 1.62 Smart Investing & Trading Score: 50 | |
| Day Percent Change: 0% Day Change: 0.03 | |
| Week Change: -9.49721% Year-to-date Change: -6.9% | |
| REKR Links: Profile News Message Board | |
| Charts:- Daily , Weekly | |
| Add REKR to Watchlist: View: Get Complete REKR Trend Analysis ➞ | |
| For tabular summary view of above stock list: Summary View ➞ 0 - 25 , 25 - 50 , 50 - 75 , 75 - 100 , 100 - 125 , 125 - 150 , 150 - 175 , 175 - 200 , 200 - 225 , 225 - 250 , 250 - 275 , 275 - 300 , 300 - 325 , 325 - 350 , 350 - 375 | ||
| Click To Change The Sort Order: By Market Cap or Company Size Performance: Year-to-date, Week and Day | |
| Select Chart Type: | ||
|
Best Stocks Today 12Stocks.com |
© 2025 12Stocks.com Terms & Conditions Privacy Contact Us
All Information Provided Only For Education And Not To Be Used For Investing or Trading. See Terms & Conditions


One More Thing ... Get Best Stocks Delivered Daily!
Never Ever Miss A Move With Our Top Ten Stocks Lists
Find Best Stocks In Any Market - Bull or Bear Market
Take A Peek At Our Top Ten Stocks Lists: Daily, Weekly, Year-to-Date & Top Trends
Find Best Stocks In Any Market - Bull or Bear Market
Take A Peek At Our Top Ten Stocks Lists: Daily, Weekly, Year-to-Date & Top Trends
Technology Stocks With Best Up Trends [0-bearish to 100-bullish]: Sony [100], Bakkt [100], Rigetti Computing[100], Fair Isaac[100], Arqit Quantum[100], D-Wave Quantum[100], Navitas Semiconductor[100], Shoals [100], Vuzix [100], Arteris [100], Lantronix [100]
Best Technology Stocks Year-to-Date:
Xunlei [370.476%], Sify [315.033%], Wolfspeed [307.01%], Digital Turbine[265.057%], EchoStar Corp[247.253%], CuriosityStream [241.605%], Viasat [224.029%], Pagaya [222.638%], Oneconnect Financial[209.053%], D-Wave Quantum[203.954%], CommScope Holding[203.101%] Best Technology Stocks This Week:
GTT [443626%], Barracuda Networks[71050%], Mobile TeleSystems[10483.5%], Nam Tai[5033.33%], Ebix [4200.85%], Fang [4150%], NantHealth [3114.02%], Hemisphere Media[2981.82%], Yandex N.V[2935.27%], Wolfspeed [1961.98%], Castlight Health[1751.96%] Best Technology Stocks Daily:
Sony [194.565%], Bakkt [28.6091%], Rigetti Computing[18.4925%], Fair Isaac[17.979%], Arqit Quantum[17.9369%], Marti [17%], Latch [16.6667%], Oclaro [14.734%], D-Wave Quantum[13.968%], Arbe Robotics[13.0178%], Navitas Semiconductor[12.3288%]