
 Login Sign Up


| |||||
 |  | ||||

| 12Stocks.com Market Intelligence |
Best SmallCap Stocks
|
| In a hurry? Small Cap Stock Lists: Performance Trends Table, Stock Charts
Sort Small Cap stocks: Daily, Weekly, Year-to-Date, Market Cap & Trends. Filter Small Cap stocks list by sector: Show all, Tech, Finance, Energy, Staples, Retail, Industrial, Materials, Utilities and HealthCare Filter Small Cap stocks list by size: All Large Medium Small and MicroCap |
| 12Stocks.com Small Cap Stocks Performances & Trends Daily | |||||||||
|
|  The overall Smart Investing & Trading Score is 88 (0-bearish to 100-bullish) which puts Small Cap index in short term bullish trend. The Smart Investing & Trading Score from previous trading session is 56 and hence an improvement of trend.
| ||||||||
Here are the Smart Investing & Trading Scores of the most requested small cap stocks at 12Stocks.com (click stock name for detailed review):
|


| 12Stocks.com: Investing in Smallcap Index with Stocks | |
|
The following table helps investors and traders sort through current performance and trends (as measured by Smart Investing & Trading Score) of various
stocks in the Smallcap Index. Quick View: Move mouse or cursor over stock symbol (ticker) to view short-term technical chart and over stock name to view long term chart. Click on  to add stock symbol to your watchlist and to add stock symbol to your watchlist and  to view watchlist. Click on any ticker or stock name for detailed market intelligence report for that stock. to view watchlist. Click on any ticker or stock name for detailed market intelligence report for that stock. |
12Stocks.com Performance of Stocks in Smallcap Index
| Ticker | Stock Name | Watchlist | Category | Recent Price | Smart Investing & Trading Score | Change % | YTD Change% |
| HELE | Helen of Troy |   | Consumer Staples | 93.13 | 42 | 2.11% | -22.91% |
| SATS | EchoStar | | Technology | 15.68 | 68 | -2.00% | -5.37% |
| ALE | ALLETE | | Utilities | 59.58 | 93 | 0.95% | -2.58% |
| GBCI | Glacier Bancorp | | Financials | 37.12 | 42 | 0.00% | -10.16% |
| ENV | Envestnet | | Services & Goods | 62.95 | 85 | 1.30% | 27.13% |
| BPMC | Blueprint Medicines | | Health Care | 93.88 | 95 | 0.95% | 1.78% |
| AMN | AMN Healthcare | | Industrials | 57.25 | 67 | 0.23% | -23.54% |
| SIGI | Selective Insurance | | Financials | 100.26 | 0 | 0.13% | 0.78% |
| PSN | Parsons | | Industrials | 80.16 | 78 | 0.54% | 27.83% |
| DM | Dominion Midstream | | Energy | 0.85 | 25 | 3.20% | 12.90% |
| SAFE | Safehold | | Financials | 18.32 | 27 | 0.60% | -21.71% |
| FTDR | frontdoor | | Services & Goods | 31.36 | 64 | 0.98% | -10.97% |
| BL | BlackLine | | Technology | 61.13 | 68 | 0.49% | -2.10% |
| RDN | Radian Group | | Financials | 30.42 | 70 | 0.23% | 6.55% |
| WTS | Watts Water | | Industrials | 201.82 | 41 | 0.16% | -3.13% |
| VRNT | Verint Systems | | Technology | 31.02 | 83 | 0.31% | 14.78% |
| WDFC | WD-40 | | Materials | 224.34 | 10 | -0.52% | -6.16% |
| ESGR | Enstar Group | | Financials | 292.69 | 83 | 1.52% | -0.56% |
| ALLO | Allogene | | Health Care | 2.98 | 22 | 3.29% | -7.01% |
| SSD | Simpson | | Industrials | 177.32 | 32 | 2.14% | -10.44% |
| VLY | Valley National | | Financials | 7.23 | 10 | -1.23% | -33.43% |
| BLKB | Blackbaud | | Technology | 78.80 | 50 | 1.09% | -9.11% |
| BXMT | Blackstone Mortgage | | Financials | 18.02 | 20 | 0.59% | -15.30% |
| QTWO | Q2 | | Technology | 53.22 | 75 | -0.11% | 22.60% |
| EHTH | eHealth | | Financials | 4.45 | 27 | -1.77% | -48.97% |
| For chart view version of above stock list: Chart View ➞ 0 - 25 , 25 - 50 , 50 - 75 , 75 - 100 , 100 - 125 , 125 - 150 , 150 - 175 , 175 - 200 , 200 - 225 , 225 - 250 , 250 - 275 , 275 - 300 , 300 - 325 , 325 - 350 , 350 - 375 , 375 - 400 , 400 - 425 , 425 - 450 , 450 - 475 , 475 - 500 , 500 - 525 , 525 - 550 , 550 - 575 , 575 - 600 , 600 - 625 , 625 - 650 , 650 - 675 , 675 - 700 , 700 - 725 , 725 - 750 , 750 - 775 , 775 - 800 , 800 - 825 , 825 - 850 , 850 - 875 , 875 - 900 , 900 - 925 , 925 - 950 , 950 - 975 , 975 - 1000 , 1000 - 1025 , 1025 - 1050 , 1050 - 1075 , 1075 - 1100 , 1100 - 1125 , 1125 - 1150 , 1150 - 1175 , 1175 - 1200 , 1200 - 1225 , 1225 - 1250 , 1250 - 1275 , 1275 - 1300 , 1300 - 1325 , 1325 - 1350 , 1350 - 1375 , 1375 - 1400 , 1400 - 1425 , 1425 - 1450 , 1450 - 1475 , 1475 - 1500 | ||
 | Click To Change The Sort Order: By Market Cap or Company Size Performance: Year-to-date, Week and Day |  |
| Too many stocks? View smallcap stocks filtered by marketcap & sector |
| Marketcap: All SmallCap Stocks (default-no microcap), Large, Mid-Range, Small |
| Smallcap Sector: Tech, Finance, Energy, Staples, Retail, Industrial, Materials, & Medical |
|
Get the most comprehensive stock market coverage daily at 12Stocks.com ➞ Best Stocks Today ➞ Best Stocks Weekly ➞ Best Stocks Year-to-Date ➞ Best Stocks Trends ➞  Best Stocks Today 12Stocks.com Best Nasdaq Stocks ➞ Best S&P 500 Stocks ➞ Best Tech Stocks ➞ Best Biotech Stocks ➞ |
| Detailed Overview of SmallCap Stocks |
| SmallCap Technical Overview, Leaders & Laggards, Top SmallCap ETF Funds & Detailed SmallCap Stocks List, Charts, Trends & More |
| Smallcap: Technical Analysis, Trends & YTD Performance | |
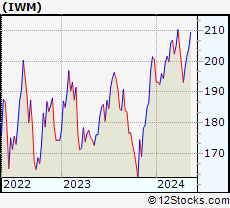
| SmallCap segment as represented by
IWM, an exchange-traded fund [ETF], holds basket of thousands of smallcap stocks from across all major sectors of the US stock market. The smallcap index (contains stocks like Riverbed & Sotheby's) is down by -0.44% and is currently underperforming the overall market by -6.94% year-to-date. Below is a quick view of technical charts and trends: | |
 IWM Weekly Chart |
|
| Long Term Trend: Very Good | |
| Medium Term Trend: Good | |
 IWM Daily Chart |
|
| Short Term Trend: Very Good | |
| Overall Trend Score: 88 | |
| YTD Performance: -0.44% | |
| **Trend Scores & Views Are Only For Educational Purposes And Not For Investing | |
| 12Stocks.com: Top Performing Small Cap Index Stocks | ||||||||||||||||||||||||||||||||||||||||||||||||
 The top performing Small Cap Index stocks year to date are
Now, more recently, over last week, the top performing Small Cap Index stocks on the move are


|
||||||||||||||||||||||||||||||||||||||||||||||||
| 12Stocks.com: Investing in Smallcap Index using Exchange Traded Funds | |
|
The following table shows list of key exchange traded funds (ETF) that
help investors track Smallcap index. The following list also includes leveraged ETF funds that track twice or thrice the daily returns of Smallcap indices. Short or inverse ETF funds move in the opposite direction to the index they track and are useful during market pullbacks or during bear markets. Quick View: Move mouse or cursor over ETF symbol (ticker) to view short-term technical chart and over ETF name to view long term chart. Click on ticker or stock name for detailed view. Click on to add stock symbol to your watchlist and to view watchlist. |
12Stocks.com List of ETFs that track Smallcap Index
| Ticker | ETF Name | Watchlist | Recent Price | Smart Investing & Trading Score | Change % | Week % | Year-to-date % |
| IWM | iShares Russell 2000 | | 199.82 | 88 | 0.72 | 0.72 | -0.44% |
| VTWO | Vanguard Russell 2000 ETF | | 80.77 | 88 | 0.69 | 0.69 | -0.41% |
| IWN | iShares Russell 2000 Value | | 152.09 | 93 | 0.63 | 0.63 | -2.09% |
| IJR | iShares Core S&P Small-Cap | | 106.37 | 93 | 0.68 | 0.68 | -1.74% |
| IWO | iShares Russell 2000 Growth | | 255.17 | 78 | 0.82 | 0.82 | 1.17% |
| IJS | iShares S&P Small-Cap 600 Value | | 97.96 | 70 | 0.79 | 0.79 | -4.96% |
| XSLV | PowerShares S&P SmallCap Low Volatil ETF | | 42.97 | 80 | 0.59 | 0.59 | -2.67% |
| IJT | iShares S&P Small-Cap 600 Growth | | 126.09 | 88 | 0.00 | 0 | 0.76% |
| SBB | ProShares Short SmallCap600 | | 16.31 | 8 | -0.46 | -0.46 | 2.39% |
| SMLV | SPDR SSGA US Small Cap Low Volatil ETF | | 107.77 | 75 | 0.23 | 0.23 | -4.22% |
| SAA | ProShares Ultra SmallCap600 | | 23.00 | 88 | -0.18 | -0.18 | -7.82% |
| SDD | ProShares UltraShort SmallCap600 | | 19.33 | 15 | -0.12 | -0.12 | 4.89% |
| 12Stocks.com: Charts, Trends, Fundamental Data and Performances of SmallCap Stocks | |
|
We now take in-depth look at all SmallCap stocks including charts, multi-period performances and overall trends (as measured by Smart Investing & Trading Score). One can sort SmallCap stocks (click link to choose) by Daily, Weekly and by Year-to-Date performances. Also, one can sort by size of the company or by market capitalization. |
| Select Your Default Chart Type: | |||||
| |||||
| Click on stock symbol or name for detailed view. Click on to add stock symbol to your watchlist and to view watchlist. Quick View: Move mouse or cursor over "Daily" to quickly view daily technical stock chart and over "Weekly" to view weekly technical stock chart. | |||||

 | HELE Helen of Troy Limited |
| Sector: Consumer Staples | |
| SubSector: Housewares & Accessories | |
| MarketCap: 3199.53 Millions | |
| Recent Price: 93.13 Smart Investing & Trading Score: 42 | |
| Day Percent Change: 2.11% Day Change: 1.92 | |
| Week Change: 2.11% Year-to-date Change: -22.9% | |
| HELE Links: Profile News Message Board | |
| Charts:- Daily , Weekly | |
| Add HELE to Watchlist: View: Get Complete HELE Trend Analysis ➞ | |
 | SATS EchoStar Corporation |
| Sector: Technology | |
| SubSector: Communication Equipment | |
| MarketCap: 3175.69 Millions | |
| Recent Price: 15.68 Smart Investing & Trading Score: 68 | |
| Day Percent Change: -2.00% Day Change: -0.32 | |
| Week Change: -2% Year-to-date Change: -5.4% | |
| SATS Links: Profile News Message Board | |
| Charts:- Daily , Weekly | |
| Add SATS to Watchlist: View: Get Complete SATS Trend Analysis ➞ | |
 | ALE ALLETE, Inc. |
| Sector: Utilities | |
| SubSector: Diversified Utilities | |
| MarketCap: 3145.4 Millions | |
| Recent Price: 59.58 Smart Investing & Trading Score: 93 | |
| Day Percent Change: 0.95% Day Change: 0.56 | |
| Week Change: 0.95% Year-to-date Change: -2.6% | |
| ALE Links: Profile News Message Board | |
| Charts:- Daily , Weekly | |
| Add ALE to Watchlist: View: Get Complete ALE Trend Analysis ➞ | |
 | GBCI Glacier Bancorp, Inc. |
| Sector: Financials | |
| SubSector: Regional - Pacific Banks | |
| MarketCap: 3142.89 Millions | |
| Recent Price: 37.12 Smart Investing & Trading Score: 42 | |
| Day Percent Change: 0.00% Day Change: 0.00 | |
| Week Change: 0% Year-to-date Change: -10.2% | |
| GBCI Links: Profile News Message Board | |
| Charts:- Daily , Weekly | |
| Add GBCI to Watchlist: View: Get Complete GBCI Trend Analysis ➞ | |
 | ENV Envestnet, Inc. |
| Sector: Services & Goods | |
| SubSector: Business Services | |
| MarketCap: 3114.02 Millions | |
| Recent Price: 62.95 Smart Investing & Trading Score: 85 | |
| Day Percent Change: 1.30% Day Change: 0.80 | |
| Week Change: 1.3% Year-to-date Change: 27.1% | |
| ENV Links: Profile News Message Board | |
| Charts:- Daily , Weekly | |
| Add ENV to Watchlist: View: Get Complete ENV Trend Analysis ➞ | |
 | BPMC Blueprint Medicines Corporation |
| Sector: Health Care | |
| SubSector: Biotechnology | |
| MarketCap: 3113.55 Millions | |
| Recent Price: 93.88 Smart Investing & Trading Score: 95 | |
| Day Percent Change: 0.95% Day Change: 0.88 | |
| Week Change: 0.95% Year-to-date Change: 1.8% | |
| BPMC Links: Profile News Message Board | |
| Charts:- Daily , Weekly | |
| Add BPMC to Watchlist: View: Get Complete BPMC Trend Analysis ➞ | |
 | AMN AMN Healthcare Services, Inc. |
| Sector: Industrials | |
| SubSector: General Building Materials | |
| MarketCap: 3064.03 Millions | |
| Recent Price: 57.25 Smart Investing & Trading Score: 67 | |
| Day Percent Change: 0.23% Day Change: 0.13 | |
| Week Change: 0.23% Year-to-date Change: -23.5% | |
| AMN Links: Profile News Message Board | |
| Charts:- Daily , Weekly | |
| Add AMN to Watchlist: View: Get Complete AMN Trend Analysis ➞ | |
 | SIGI Selective Insurance Group, Inc. |
| Sector: Financials | |
| SubSector: Property & Casualty Insurance | |
| MarketCap: 3039.12 Millions | |
| Recent Price: 100.26 Smart Investing & Trading Score: 0 | |
| Day Percent Change: 0.13% Day Change: 0.13 | |
| Week Change: 0.13% Year-to-date Change: 0.8% | |
| SIGI Links: Profile News Message Board | |
| Charts:- Daily , Weekly | |
| Add SIGI to Watchlist: View: Get Complete SIGI Trend Analysis ➞ | |
 | PSN Parsons Corporation |
| Sector: Industrials | |
| SubSector: Diversified Machinery | |
| MarketCap: 3021.16 Millions | |
| Recent Price: 80.16 Smart Investing & Trading Score: 78 | |
| Day Percent Change: 0.54% Day Change: 0.43 | |
| Week Change: 0.54% Year-to-date Change: 27.8% | |
| PSN Links: Profile News Message Board | |
| Charts:- Daily , Weekly | |
| Add PSN to Watchlist: View: Get Complete PSN Trend Analysis ➞ | |
 | DM Dominion Midstream Partners, LP |
| Sector: Energy | |
| SubSector: Oil & Gas Pipelines | |
| MarketCap: 3017.01 Millions | |
| Recent Price: 0.85 Smart Investing & Trading Score: 25 | |
| Day Percent Change: 3.20% Day Change: 0.03 | |
| Week Change: 3.2% Year-to-date Change: 12.9% | |
| DM Links: Profile News Message Board | |
| Charts:- Daily , Weekly | |
| Add DM to Watchlist: View: Get Complete DM Trend Analysis ➞ | |
 | SAFE Safehold Inc. |
| Sector: Financials | |
| SubSector: REIT - Diversified | |
| MarketCap: 2994.63 Millions | |
| Recent Price: 18.32 Smart Investing & Trading Score: 27 | |
| Day Percent Change: 0.60% Day Change: 0.11 | |
| Week Change: 0.6% Year-to-date Change: -21.7% | |
| SAFE Links: Profile News Message Board | |
| Charts:- Daily , Weekly | |
| Add SAFE to Watchlist: View: Get Complete SAFE Trend Analysis ➞ | |
 | FTDR frontdoor, inc. |
| Sector: Services & Goods | |
| SubSector: Business Services | |
| MarketCap: 2974.22 Millions | |
| Recent Price: 31.36 Smart Investing & Trading Score: 64 | |
| Day Percent Change: 0.98% Day Change: 0.30 | |
| Week Change: 0.98% Year-to-date Change: -11.0% | |
| FTDR Links: Profile News Message Board | |
| Charts:- Daily , Weekly | |
| Add FTDR to Watchlist: View: Get Complete FTDR Trend Analysis ➞ | |
 | BL BlackLine, Inc. |
| Sector: Technology | |
| SubSector: Application Software | |
| MarketCap: 2972.62 Millions | |
| Recent Price: 61.13 Smart Investing & Trading Score: 68 | |
| Day Percent Change: 0.49% Day Change: 0.30 | |
| Week Change: 0.49% Year-to-date Change: -2.1% | |
| BL Links: Profile News Message Board | |
| Charts:- Daily , Weekly | |
| Add BL to Watchlist: View: Get Complete BL Trend Analysis ➞ | |
 | RDN Radian Group Inc. |
| Sector: Financials | |
| SubSector: Property & Casualty Insurance | |
| MarketCap: 2950.12 Millions | |
| Recent Price: 30.42 Smart Investing & Trading Score: 70 | |
| Day Percent Change: 0.23% Day Change: 0.07 | |
| Week Change: 0.23% Year-to-date Change: 6.6% | |
| RDN Links: Profile News Message Board | |
| Charts:- Daily , Weekly | |
| Add RDN to Watchlist: View: Get Complete RDN Trend Analysis ➞ | |
 | WTS Watts Water Technologies, Inc. |
| Sector: Industrials | |
| SubSector: Industrial Equipment & Components | |
| MarketCap: 2903.29 Millions | |
| Recent Price: 201.82 Smart Investing & Trading Score: 41 | |
| Day Percent Change: 0.16% Day Change: 0.31 | |
| Week Change: 0.16% Year-to-date Change: -3.1% | |
| WTS Links: Profile News Message Board | |
| Charts:- Daily , Weekly | |
| Add WTS to Watchlist: View: Get Complete WTS Trend Analysis ➞ | |
 | VRNT Verint Systems Inc. |
| Sector: Technology | |
| SubSector: Business Software & Services | |
| MarketCap: 2902.18 Millions | |
| Recent Price: 31.02 Smart Investing & Trading Score: 83 | |
| Day Percent Change: 0.31% Day Change: 0.09 | |
| Week Change: 0.31% Year-to-date Change: 14.8% | |
| VRNT Links: Profile News Message Board | |
| Charts:- Daily , Weekly | |
| Add VRNT to Watchlist: View: Get Complete VRNT Trend Analysis ➞ | |
 | WDFC WD-40 Company |
| Sector: Materials | |
| SubSector: Specialty Chemicals | |
| MarketCap: 2900.57 Millions | |
| Recent Price: 224.34 Smart Investing & Trading Score: 10 | |
| Day Percent Change: -0.52% Day Change: -1.18 | |
| Week Change: -0.52% Year-to-date Change: -6.2% | |
| WDFC Links: Profile News Message Board | |
| Charts:- Daily , Weekly | |
| Add WDFC to Watchlist: View: Get Complete WDFC Trend Analysis ➞ | |
 | ESGR Enstar Group Limited |
| Sector: Financials | |
| SubSector: Property & Casualty Insurance | |
| MarketCap: 2886.02 Millions | |
| Recent Price: 292.69 Smart Investing & Trading Score: 83 | |
| Day Percent Change: 1.52% Day Change: 4.39 | |
| Week Change: 1.52% Year-to-date Change: -0.6% | |
| ESGR Links: Profile News Message Board | |
| Charts:- Daily , Weekly | |
| Add ESGR to Watchlist: View: Get Complete ESGR Trend Analysis ➞ | |
 | ALLO Allogene Therapeutics, Inc. |
| Sector: Health Care | |
| SubSector: Biotechnology | |
| MarketCap: 2858.65 Millions | |
| Recent Price: 2.98 Smart Investing & Trading Score: 22 | |
| Day Percent Change: 3.29% Day Change: 0.09 | |
| Week Change: 3.29% Year-to-date Change: -7.0% | |
| ALLO Links: Profile News Message Board | |
| Charts:- Daily , Weekly | |
| Add ALLO to Watchlist: View: Get Complete ALLO Trend Analysis ➞ | |
 | SSD Simpson Manufacturing Co., Inc. |
| Sector: Industrials | |
| SubSector: Small Tools & Accessories | |
| MarketCap: 2850.16 Millions | |
| Recent Price: 177.32 Smart Investing & Trading Score: 32 | |
| Day Percent Change: 2.14% Day Change: 3.71 | |
| Week Change: 2.14% Year-to-date Change: -10.4% | |
| SSD Links: Profile News Message Board | |
| Charts:- Daily , Weekly | |
| Add SSD to Watchlist: View: Get Complete SSD Trend Analysis ➞ | |
 | VLY Valley National Bancorp |
| Sector: Financials | |
| SubSector: Regional - Northeast Banks | |
| MarketCap: 2843.09 Millions | |
| Recent Price: 7.23 Smart Investing & Trading Score: 10 | |
| Day Percent Change: -1.23% Day Change: -0.09 | |
| Week Change: -1.23% Year-to-date Change: -33.4% | |
| VLY Links: Profile News Message Board | |
| Charts:- Daily , Weekly | |
| Add VLY to Watchlist: View: Get Complete VLY Trend Analysis ➞ | |
 | BLKB Blackbaud, Inc. |
| Sector: Technology | |
| SubSector: Business Software & Services | |
| MarketCap: 2838.48 Millions | |
| Recent Price: 78.80 Smart Investing & Trading Score: 50 | |
| Day Percent Change: 1.09% Day Change: 0.85 | |
| Week Change: 1.09% Year-to-date Change: -9.1% | |
| BLKB Links: Profile News Message Board | |
| Charts:- Daily , Weekly | |
| Add BLKB to Watchlist: View: Get Complete BLKB Trend Analysis ➞ | |
 | BXMT Blackstone Mortgage Trust, Inc. |
| Sector: Financials | |
| SubSector: Mortgage Investment | |
| MarketCap: 2820.69 Millions | |
| Recent Price: 18.02 Smart Investing & Trading Score: 20 | |
| Day Percent Change: 0.59% Day Change: 0.11 | |
| Week Change: 0.59% Year-to-date Change: -15.3% | |
| BXMT Links: Profile News Message Board | |
| Charts:- Daily , Weekly | |
| Add BXMT to Watchlist: View: Get Complete BXMT Trend Analysis ➞ | |
 | QTWO Q2 Holdings, Inc. |
| Sector: Technology | |
| SubSector: Business Software & Services | |
| MarketCap: 2815.88 Millions | |
| Recent Price: 53.22 Smart Investing & Trading Score: 75 | |
| Day Percent Change: -0.11% Day Change: -0.06 | |
| Week Change: -0.11% Year-to-date Change: 22.6% | |
| QTWO Links: Profile News Message Board | |
| Charts:- Daily , Weekly | |
| Add QTWO to Watchlist: View: Get Complete QTWO Trend Analysis ➞ | |
 | EHTH eHealth, Inc. |
| Sector: Financials | |
| SubSector: Insurance Brokers | |
| MarketCap: 2813.57 Millions | |
| Recent Price: 4.45 Smart Investing & Trading Score: 27 | |
| Day Percent Change: -1.77% Day Change: -0.08 | |
| Week Change: -1.77% Year-to-date Change: -49.0% | |
| EHTH Links: Profile News Message Board | |
| Charts:- Daily , Weekly | |
| Add EHTH to Watchlist: View: Get Complete EHTH Trend Analysis ➞ | |
| For tabular summary view of above stock list: Summary View ➞ 0 - 25 , 25 - 50 , 50 - 75 , 75 - 100 , 100 - 125 , 125 - 150 , 150 - 175 , 175 - 200 , 200 - 225 , 225 - 250 , 250 - 275 , 275 - 300 , 300 - 325 , 325 - 350 , 350 - 375 , 375 - 400 , 400 - 425 , 425 - 450 , 450 - 475 , 475 - 500 , 500 - 525 , 525 - 550 , 550 - 575 , 575 - 600 , 600 - 625 , 625 - 650 , 650 - 675 , 675 - 700 , 700 - 725 , 725 - 750 , 750 - 775 , 775 - 800 , 800 - 825 , 825 - 850 , 850 - 875 , 875 - 900 , 900 - 925 , 925 - 950 , 950 - 975 , 975 - 1000 , 1000 - 1025 , 1025 - 1050 , 1050 - 1075 , 1075 - 1100 , 1100 - 1125 , 1125 - 1150 , 1150 - 1175 , 1175 - 1200 , 1200 - 1225 , 1225 - 1250 , 1250 - 1275 , 1275 - 1300 , 1300 - 1325 , 1325 - 1350 , 1350 - 1375 , 1375 - 1400 , 1400 - 1425 , 1425 - 1450 , 1450 - 1475 , 1475 - 1500 | ||
| Click To Change The Sort Order: By Market Cap or Company Size Performance: Year-to-date, Week and Day | |
| Select Chart Type: | ||
| Too many stocks? View smallcap stocks filtered by marketcap & sector |
| Marketcap: All SmallCap Stocks (default-no microcap), Large, Mid-Range, Small & MicroCap |
| Sector: Tech, Finance, Energy, Staples, Retail, Industrial, Materials, Utilities & Medical |
|
Best Stocks Today 12Stocks.com |
© 2024 12Stocks.com Terms & Conditions Privacy Contact Us
All Information Provided Only For Education And Not To Be Used For Investing or Trading. See Terms & Conditions


One More Thing ... Get Best Stocks Delivered Daily!
Never Ever Miss A Move With Our Top Ten Stocks Lists
Find Best Stocks In Any Market - Bull or Bear Market
Take A Peek At Our Top Ten Stocks Lists: Daily, Weekly, Year-to-Date & Top Trends
Find Best Stocks In Any Market - Bull or Bear Market
Take A Peek At Our Top Ten Stocks Lists: Daily, Weekly, Year-to-Date & Top Trends
Smallcap Stocks With Best Up Trends [0-bearish to 100-bullish]: Bakkt [100], Deciphera [100], Phibro Animal[100], Heartland Financial[100], Sight Sciences[100], TPI Composites[100], Fulton Financial[100], PTC [100], PaySign [100], Cullinan Oncology[100], Richardson Electronics[100]
Best Smallcap Stocks Year-to-Date:
CareMax [510.31%], Bakkt [363.68%], Viking [305.7%], Alpine Immune[239.57%], Longboard [232.41%], Super Micro[208.09%], Avidity Biosciences[177.32%], Cullinan Oncology[165.18%], Arcutis Bio[162.38%], Hippo [142.48%], Stoke [124.43%] Best Smallcap Stocks This Week:
Deciphera [72.05%], Phibro Animal[21.45%], Heartland Financial[19.15%], MultiPlan [16.09%], Sight Sciences[14.39%], Pacific Biosciences[13.27%], Codexis [12.59%], TPI Composites[11.87%], Velo3D [11.5%], Children s[11.14%], Zevia PBC[10.97%] Best Smallcap Stocks Daily:
Bakkt [2486.94%], Deciphera [72.05%], Phibro Animal[21.45%], Heartland Financial[19.15%], MultiPlan [16.09%], Sight Sciences[14.39%], Pacific Biosciences[13.27%], Codexis [12.59%], TPI Composites[11.87%], Velo3D [11.50%], Children s[11.14%]