
 Login Sign Up


| |||||
 |  | ||||

| 12Stocks.com Market Intelligence |
Best SmallCap Stocks
|
| In a hurry? Small Cap Stock Lists: Performance Trends Table, Stock Charts
Sort Small Cap stocks: Daily, Weekly, Year-to-Date, Market Cap & Trends. Filter Small Cap stocks list by sector: Show all, Tech, Finance, Energy, Staples, Retail, Industrial, Materials, Utilities and HealthCare Filter Small Cap stocks list by size: All Large Medium Small and MicroCap |
| 12Stocks.com Small Cap Stocks Performances & Trends Daily | |||||||||
|
|  The overall Smart Investing & Trading Score is 88 (0-bearish to 100-bullish) which puts Small Cap index in short term bullish trend. The Smart Investing & Trading Score from previous trading session is 56 and hence an improvement of trend.
| ||||||||
Here are the Smart Investing & Trading Scores of the most requested small cap stocks at 12Stocks.com (click stock name for detailed review):
|


| 12Stocks.com: Investing in Smallcap Index with Stocks | |
|
The following table helps investors and traders sort through current performance and trends (as measured by Smart Investing & Trading Score) of various
stocks in the Smallcap Index. Quick View: Move mouse or cursor over stock symbol (ticker) to view short-term technical chart and over stock name to view long term chart. Click on  to add stock symbol to your watchlist and to add stock symbol to your watchlist and  to view watchlist. Click on any ticker or stock name for detailed market intelligence report for that stock. to view watchlist. Click on any ticker or stock name for detailed market intelligence report for that stock. |
12Stocks.com Performance of Stocks in Smallcap Index
| Ticker | Stock Name | Watchlist | Category | Recent Price | Smart Investing & Trading Score | Change % | YTD Change% |
| CSV | Carriage Services |   | Services & Goods | 25.83 | 100 | 3.65% | 3.28% |
| EBTC | Enterprise Bancorp | | Financials | 24.90 | 57 | 0.00% | -22.81% |
| OMGA | Omega | | Health Care | 2.31 | 10 | 1.54% | -23.42% |
| PLCE | Children s | | Services & Goods | 7.88 | 57 | 11.14% | -66.06% |
| ADTN | ADTRAN | | Technology | 4.49 | 20 | 1.35% | -38.83% |
| IMRX | Immuneering | | Health Care | 1.50 | 15 | 1.70% | -80.30% |
| ZIMV | ZimVie | | Health Care | 15.87 | 40 | 0.32% | -10.44% |
| ZVIA | Zevia PBC | | Consumer Staples | 0.89 | 35 | 10.97% | -55.94% |
| TNGX | Tango | | Health Care | 7.48 | 32 | 0.54% | -24.44% |
| NOG | Northern Oil | | Energy | 43.29 | 95 | 0.05% | 16.78% |
| ARTNA | Artesian Resources | | Utilities | 34.95 | 67 | 1.29% | -15.69% |
| BHB | Bar Harbor | | Financials | 25.83 | 67 | 1.25% | -12.02% |
| LEGH | Legacy Housing | | Industrials | 20.67 | 64 | 1.82% | -18.04% |
| HCI | HCI Group | | Financials | 114.94 | 85 | -0.05% | 31.51% |
| HUMA | Humacyte | | Health Care | 3.98 | 76 | -0.13% | 40.32% |
| LOCO | El Pollo | | Services & Goods | 8.77 | 57 | -1.63% | -0.62% |
| TDW | Tidewater | | Energy | 96.34 | 83 | 0.65% | 33.61% |
| AFRI | Forafric Global | | Consumer Staples | 10.43 | 73 | 0.00% | -1.51% |
| KLTR | Kaltura | | Technology | 1.25 | 20 | 0.00% | -36.22% |
| CARS | Cars.com | | Services & Goods | 17.03 | 64 | 0.06% | -10.23% |
| XPEL | XPEL | | Consumer Staples | 54.74 | 53 | 0.00% | 1.65% |
| CLAR | Clarus | | Consumer Staples | 6.33 | 83 | 0.80% | -8.19% |
| GPMT | Granite Point | | Financials | 4.43 | 49 | 1.03% | -25.34% |
| VRCA | Verrica | | Health Care | 7.19 | 100 | 4.66% | -1.78% |
| RMNI | Rimini Street | | Technology | 2.81 | 25 | 0.36% | -14.07% |
| For chart view version of above stock list: Chart View ➞ 0 - 25 , 25 - 50 , 50 - 75 , 75 - 100 , 100 - 125 , 125 - 150 , 150 - 175 , 175 - 200 , 200 - 225 , 225 - 250 , 250 - 275 , 275 - 300 , 300 - 325 , 325 - 350 , 350 - 375 , 375 - 400 , 400 - 425 , 425 - 450 , 450 - 475 , 475 - 500 , 500 - 525 , 525 - 550 , 550 - 575 , 575 - 600 , 600 - 625 , 625 - 650 , 650 - 675 , 675 - 700 , 700 - 725 , 725 - 750 , 750 - 775 , 775 - 800 , 800 - 825 , 825 - 850 , 850 - 875 , 875 - 900 , 900 - 925 , 925 - 950 , 950 - 975 , 975 - 1000 , 1000 - 1025 , 1025 - 1050 , 1050 - 1075 , 1075 - 1100 , 1100 - 1125 , 1125 - 1150 , 1150 - 1175 , 1175 - 1200 , 1200 - 1225 , 1225 - 1250 , 1250 - 1275 , 1275 - 1300 , 1300 - 1325 , 1325 - 1350 , 1350 - 1375 , 1375 - 1400 , 1400 - 1425 , 1425 - 1450 , 1450 - 1475 , 1475 - 1500 | ||
 | Click To Change The Sort Order: By Market Cap or Company Size Performance: Year-to-date, Week and Day |  |
| Too many stocks? View smallcap stocks filtered by marketcap & sector |
| Marketcap: All SmallCap Stocks (default-no microcap), Large, Mid-Range, Small |
| Smallcap Sector: Tech, Finance, Energy, Staples, Retail, Industrial, Materials, & Medical |
|
Get the most comprehensive stock market coverage daily at 12Stocks.com ➞ Best Stocks Today ➞ Best Stocks Weekly ➞ Best Stocks Year-to-Date ➞ Best Stocks Trends ➞  Best Stocks Today 12Stocks.com Best Nasdaq Stocks ➞ Best S&P 500 Stocks ➞ Best Tech Stocks ➞ Best Biotech Stocks ➞ |
| Detailed Overview of SmallCap Stocks |
| SmallCap Technical Overview, Leaders & Laggards, Top SmallCap ETF Funds & Detailed SmallCap Stocks List, Charts, Trends & More |
| Smallcap: Technical Analysis, Trends & YTD Performance | |
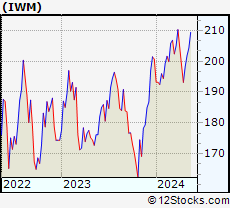
| SmallCap segment as represented by
IWM, an exchange-traded fund [ETF], holds basket of thousands of smallcap stocks from across all major sectors of the US stock market. The smallcap index (contains stocks like Riverbed & Sotheby's) is down by -0.44% and is currently underperforming the overall market by -6.94% year-to-date. Below is a quick view of technical charts and trends: | |
 IWM Weekly Chart |
|
| Long Term Trend: Very Good | |
| Medium Term Trend: Good | |
 IWM Daily Chart |
|
| Short Term Trend: Very Good | |
| Overall Trend Score: 88 | |
| YTD Performance: -0.44% | |
| **Trend Scores & Views Are Only For Educational Purposes And Not For Investing | |
| 12Stocks.com: Top Performing Small Cap Index Stocks | ||||||||||||||||||||||||||||||||||||||||||||||||
 The top performing Small Cap Index stocks year to date are
Now, more recently, over last week, the top performing Small Cap Index stocks on the move are


|
||||||||||||||||||||||||||||||||||||||||||||||||
| 12Stocks.com: Investing in Smallcap Index using Exchange Traded Funds | |
|
The following table shows list of key exchange traded funds (ETF) that
help investors track Smallcap index. The following list also includes leveraged ETF funds that track twice or thrice the daily returns of Smallcap indices. Short or inverse ETF funds move in the opposite direction to the index they track and are useful during market pullbacks or during bear markets. Quick View: Move mouse or cursor over ETF symbol (ticker) to view short-term technical chart and over ETF name to view long term chart. Click on ticker or stock name for detailed view. Click on to add stock symbol to your watchlist and to view watchlist. |
12Stocks.com List of ETFs that track Smallcap Index
| Ticker | ETF Name | Watchlist | Recent Price | Smart Investing & Trading Score | Change % | Week % | Year-to-date % |
| IWM | iShares Russell 2000 | | 199.82 | 88 | 0.72 | 0.72 | -0.44% |
| VTWO | Vanguard Russell 2000 ETF | | 80.77 | 88 | 0.69 | 0.69 | -0.41% |
| IWN | iShares Russell 2000 Value | | 152.09 | 93 | 0.63 | 0.63 | -2.09% |
| IJR | iShares Core S&P Small-Cap | | 106.37 | 93 | 0.68 | 0.68 | -1.74% |
| IWO | iShares Russell 2000 Growth | | 255.17 | 78 | 0.82 | 0.82 | 1.17% |
| IJS | iShares S&P Small-Cap 600 Value | | 97.96 | 70 | 0.79 | 0.79 | -4.96% |
| XSLV | PowerShares S&P SmallCap Low Volatil ETF | | 42.97 | 80 | 0.59 | 0.59 | -2.67% |
| IJT | iShares S&P Small-Cap 600 Growth | | 126.09 | 88 | 0.00 | 0 | 0.76% |
| SBB | ProShares Short SmallCap600 | | 16.31 | 8 | -0.46 | -0.46 | 2.39% |
| SMLV | SPDR SSGA US Small Cap Low Volatil ETF | | 107.77 | 75 | 0.23 | 0.23 | -4.22% |
| SAA | ProShares Ultra SmallCap600 | | 23.00 | 88 | -0.18 | -0.18 | -7.82% |
| SDD | ProShares UltraShort SmallCap600 | | 19.33 | 15 | -0.12 | -0.12 | 4.89% |
| 12Stocks.com: Charts, Trends, Fundamental Data and Performances of SmallCap Stocks | |
|
We now take in-depth look at all SmallCap stocks including charts, multi-period performances and overall trends (as measured by Smart Investing & Trading Score). One can sort SmallCap stocks (click link to choose) by Daily, Weekly and by Year-to-Date performances. Also, one can sort by size of the company or by market capitalization. |
| Select Your Default Chart Type: | |||||
| |||||
| Click on stock symbol or name for detailed view. Click on to add stock symbol to your watchlist and to view watchlist. Quick View: Move mouse or cursor over "Daily" to quickly view daily technical stock chart and over "Weekly" to view weekly technical stock chart. | |||||

 | CSV Carriage Services, Inc. |
| Sector: Services & Goods | |
| SubSector: Personal Services | |
| MarketCap: 304.725 Millions | |
| Recent Price: 25.83 Smart Investing & Trading Score: 100 | |
| Day Percent Change: 3.65% Day Change: 0.91 | |
| Week Change: 3.65% Year-to-date Change: 3.3% | |
| CSV Links: Profile News Message Board | |
| Charts:- Daily , Weekly | |
| Add CSV to Watchlist: View: Get Complete CSV Trend Analysis ➞ | |
 | EBTC Enterprise Bancorp, Inc. |
| Sector: Financials | |
| SubSector: Savings & Loans | |
| MarketCap: 304.53 Millions | |
| Recent Price: 24.90 Smart Investing & Trading Score: 57 | |
| Day Percent Change: 0.00% Day Change: 0.00 | |
| Week Change: 0% Year-to-date Change: -22.8% | |
| EBTC Links: Profile News Message Board | |
| Charts:- Daily , Weekly | |
| Add EBTC to Watchlist: View: Get Complete EBTC Trend Analysis ➞ | |
 | OMGA Omega Therapeutics, Inc. |
| Sector: Health Care | |
| SubSector: Biotechnology | |
| MarketCap: 304 Millions | |
| Recent Price: 2.31 Smart Investing & Trading Score: 10 | |
| Day Percent Change: 1.54% Day Change: 0.04 | |
| Week Change: 1.54% Year-to-date Change: -23.4% | |
| OMGA Links: Profile News Message Board | |
| Charts:- Daily , Weekly | |
| Add OMGA to Watchlist: View: Get Complete OMGA Trend Analysis ➞ | |
 | PLCE The Children s Place, Inc. |
| Sector: Services & Goods | |
| SubSector: Apparel Stores | |
| MarketCap: 303.608 Millions | |
| Recent Price: 7.88 Smart Investing & Trading Score: 57 | |
| Day Percent Change: 11.14% Day Change: 0.79 | |
| Week Change: 11.14% Year-to-date Change: -66.1% | |
| PLCE Links: Profile News Message Board | |
| Charts:- Daily , Weekly | |
| Add PLCE to Watchlist: View: Get Complete PLCE Trend Analysis ➞ | |
 | ADTN ADTRAN, Inc. |
| Sector: Technology | |
| SubSector: Communication Equipment | |
| MarketCap: 303.539 Millions | |
| Recent Price: 4.49 Smart Investing & Trading Score: 20 | |
| Day Percent Change: 1.35% Day Change: 0.06 | |
| Week Change: 1.35% Year-to-date Change: -38.8% | |
| ADTN Links: Profile News Message Board | |
| Charts:- Daily , Weekly | |
| Add ADTN to Watchlist: View: Get Complete ADTN Trend Analysis ➞ | |
 | IMRX Immuneering Corporation |
| Sector: Health Care | |
| SubSector: Biotechnology | |
| MarketCap: 303 Millions | |
| Recent Price: 1.50 Smart Investing & Trading Score: 15 | |
| Day Percent Change: 1.70% Day Change: 0.03 | |
| Week Change: 1.7% Year-to-date Change: -80.3% | |
| IMRX Links: Profile News Message Board | |
| Charts:- Daily , Weekly | |
| Add IMRX to Watchlist: View: Get Complete IMRX Trend Analysis ➞ | |
 | ZIMV ZimVie Inc. |
| Sector: Health Care | |
| SubSector: Medical Devices | |
| MarketCap: 303 Millions | |
| Recent Price: 15.87 Smart Investing & Trading Score: 40 | |
| Day Percent Change: 0.32% Day Change: 0.05 | |
| Week Change: 0.32% Year-to-date Change: -10.4% | |
| ZIMV Links: Profile News Message Board | |
| Charts:- Daily , Weekly | |
| Add ZIMV to Watchlist: View: Get Complete ZIMV Trend Analysis ➞ | |
 | ZVIA Zevia PBC |
| Sector: Consumer Staples | |
| SubSector: Beverages - Non-Alcoholic | |
| MarketCap: 303 Millions | |
| Recent Price: 0.89 Smart Investing & Trading Score: 35 | |
| Day Percent Change: 10.97% Day Change: 0.09 | |
| Week Change: 10.97% Year-to-date Change: -55.9% | |
| ZVIA Links: Profile News Message Board | |
| Charts:- Daily , Weekly | |
| Add ZVIA to Watchlist: View: Get Complete ZVIA Trend Analysis ➞ | |
 | TNGX Tango Therapeutics, Inc. |
| Sector: Health Care | |
| SubSector: Biotechnology | |
| MarketCap: 302 Millions | |
| Recent Price: 7.48 Smart Investing & Trading Score: 32 | |
| Day Percent Change: 0.54% Day Change: 0.04 | |
| Week Change: 0.54% Year-to-date Change: -24.4% | |
| TNGX Links: Profile News Message Board | |
| Charts:- Daily , Weekly | |
| Add TNGX to Watchlist: View: Get Complete TNGX Trend Analysis ➞ | |
 | NOG Northern Oil and Gas, Inc. |
| Sector: Energy | |
| SubSector: Oil & Gas Drilling & Exploration | |
| MarketCap: 301.939 Millions | |
| Recent Price: 43.29 Smart Investing & Trading Score: 95 | |
| Day Percent Change: 0.05% Day Change: 0.02 | |
| Week Change: 0.05% Year-to-date Change: 16.8% | |
| NOG Links: Profile News Message Board | |
| Charts:- Daily , Weekly | |
| Add NOG to Watchlist: View: Get Complete NOG Trend Analysis ➞ | |
 | ARTNA Artesian Resources Corporation |
| Sector: Utilities | |
| SubSector: Water Utilities | |
| MarketCap: 299.402 Millions | |
| Recent Price: 34.95 Smart Investing & Trading Score: 67 | |
| Day Percent Change: 1.29% Day Change: 0.45 | |
| Week Change: 1.29% Year-to-date Change: -15.7% | |
| ARTNA Links: Profile News Message Board | |
| Charts:- Daily , Weekly | |
| Add ARTNA to Watchlist: View: Get Complete ARTNA Trend Analysis ➞ | |
 | BHB Bar Harbor Bankshares |
| Sector: Financials | |
| SubSector: Regional - Northeast Banks | |
| MarketCap: 298.099 Millions | |
| Recent Price: 25.83 Smart Investing & Trading Score: 67 | |
| Day Percent Change: 1.25% Day Change: 0.32 | |
| Week Change: 1.25% Year-to-date Change: -12.0% | |
| BHB Links: Profile News Message Board | |
| Charts:- Daily , Weekly | |
| Add BHB to Watchlist: View: Get Complete BHB Trend Analysis ➞ | |
 | LEGH Legacy Housing Corporation |
| Sector: Industrials | |
| SubSector: Residential Construction | |
| MarketCap: 298.006 Millions | |
| Recent Price: 20.67 Smart Investing & Trading Score: 64 | |
| Day Percent Change: 1.82% Day Change: 0.37 | |
| Week Change: 1.82% Year-to-date Change: -18.0% | |
| LEGH Links: Profile News Message Board | |
| Charts:- Daily , Weekly | |
| Add LEGH to Watchlist: View: Get Complete LEGH Trend Analysis ➞ | |
 | HCI HCI Group, Inc. |
| Sector: Financials | |
| SubSector: Property & Casualty Insurance | |
| MarketCap: 297.412 Millions | |
| Recent Price: 114.94 Smart Investing & Trading Score: 85 | |
| Day Percent Change: -0.05% Day Change: -0.06 | |
| Week Change: -0.05% Year-to-date Change: 31.5% | |
| HCI Links: Profile News Message Board | |
| Charts:- Daily , Weekly | |
| Add HCI to Watchlist: View: Get Complete HCI Trend Analysis ➞ | |
 | HUMA Humacyte, Inc. |
| Sector: Health Care | |
| SubSector: Biotechnology | |
| MarketCap: 297 Millions | |
| Recent Price: 3.98 Smart Investing & Trading Score: 76 | |
| Day Percent Change: -0.13% Day Change: -0.01 | |
| Week Change: -0.13% Year-to-date Change: 40.3% | |
| HUMA Links: Profile News Message Board | |
| Charts:- Daily , Weekly | |
| Add HUMA to Watchlist: View: Get Complete HUMA Trend Analysis ➞ | |
 | LOCO El Pollo Loco Holdings, Inc. |
| Sector: Services & Goods | |
| SubSector: Restaurants | |
| MarketCap: 296.97 Millions | |
| Recent Price: 8.77 Smart Investing & Trading Score: 57 | |
| Day Percent Change: -1.63% Day Change: -0.14 | |
| Week Change: -1.63% Year-to-date Change: -0.6% | |
| LOCO Links: Profile News Message Board | |
| Charts:- Daily , Weekly | |
| Add LOCO to Watchlist: View: Get Complete LOCO Trend Analysis ➞ | |
 | TDW Tidewater Inc. |
| Sector: Energy | |
| SubSector: Oil & Gas Equipment & Services | |
| MarketCap: 295.061 Millions | |
| Recent Price: 96.34 Smart Investing & Trading Score: 83 | |
| Day Percent Change: 0.65% Day Change: 0.63 | |
| Week Change: 0.65% Year-to-date Change: 33.6% | |
| TDW Links: Profile News Message Board | |
| Charts:- Daily , Weekly | |
| Add TDW to Watchlist: View: Get Complete TDW Trend Analysis ➞ | |
 | AFRI Forafric Global PLC |
| Sector: Consumer Staples | |
| SubSector: Farm Products | |
| MarketCap: 295 Millions | |
| Recent Price: 10.43 Smart Investing & Trading Score: 73 | |
| Day Percent Change: 0.00% Day Change: 0.00 | |
| Week Change: 0% Year-to-date Change: -1.5% | |
| AFRI Links: Profile News Message Board | |
| Charts:- Daily , Weekly | |
| Add AFRI to Watchlist: View: Get Complete AFRI Trend Analysis ➞ | |
 | KLTR Kaltura, Inc. |
| Sector: Technology | |
| SubSector: Software - Application | |
| MarketCap: 293 Millions | |
| Recent Price: 1.25 Smart Investing & Trading Score: 20 | |
| Day Percent Change: 0.00% Day Change: 0.00 | |
| Week Change: 0% Year-to-date Change: -36.2% | |
| KLTR Links: Profile News Message Board | |
| Charts:- Daily , Weekly | |
| Add KLTR to Watchlist: View: Get Complete KLTR Trend Analysis ➞ | |
 | CARS Cars.com Inc. |
| Sector: Services & Goods | |
| SubSector: Auto Dealerships | |
| MarketCap: 290.321 Millions | |
| Recent Price: 17.03 Smart Investing & Trading Score: 64 | |
| Day Percent Change: 0.06% Day Change: 0.01 | |
| Week Change: 0.06% Year-to-date Change: -10.2% | |
| CARS Links: Profile News Message Board | |
| Charts:- Daily , Weekly | |
| Add CARS to Watchlist: View: Get Complete CARS Trend Analysis ➞ | |
 | XPEL XPEL, Inc. |
| Sector: Consumer Staples | |
| SubSector: Auto Parts | |
| MarketCap: 290.239 Millions | |
| Recent Price: 54.74 Smart Investing & Trading Score: 53 | |
| Day Percent Change: 0.00% Day Change: 0.00 | |
| Week Change: 0% Year-to-date Change: 1.7% | |
| XPEL Links: Profile News Message Board | |
| Charts:- Daily , Weekly | |
| Add XPEL to Watchlist: View: Get Complete XPEL Trend Analysis ➞ | |
 | CLAR Clarus Corporation |
| Sector: Consumer Staples | |
| SubSector: Sporting Goods | |
| MarketCap: 290.144 Millions | |
| Recent Price: 6.33 Smart Investing & Trading Score: 83 | |
| Day Percent Change: 0.80% Day Change: 0.05 | |
| Week Change: 0.8% Year-to-date Change: -8.2% | |
| CLAR Links: Profile News Message Board | |
| Charts:- Daily , Weekly | |
| Add CLAR to Watchlist: View: Get Complete CLAR Trend Analysis ➞ | |
 | GPMT Granite Point Mortgage Trust Inc. |
| Sector: Financials | |
| SubSector: Mortgage Investment | |
| MarketCap: 289.739 Millions | |
| Recent Price: 4.43 Smart Investing & Trading Score: 49 | |
| Day Percent Change: 1.03% Day Change: 0.04 | |
| Week Change: 1.03% Year-to-date Change: -25.3% | |
| GPMT Links: Profile News Message Board | |
| Charts:- Daily , Weekly | |
| Add GPMT to Watchlist: View: Get Complete GPMT Trend Analysis ➞ | |
 | VRCA Verrica Pharmaceuticals Inc. |
| Sector: Health Care | |
| SubSector: Biotechnology | |
| MarketCap: 289.585 Millions | |
| Recent Price: 7.19 Smart Investing & Trading Score: 100 | |
| Day Percent Change: 4.66% Day Change: 0.32 | |
| Week Change: 4.66% Year-to-date Change: -1.8% | |
| VRCA Links: Profile News Message Board | |
| Charts:- Daily , Weekly | |
| Add VRCA to Watchlist: View: Get Complete VRCA Trend Analysis ➞ | |
 | RMNI Rimini Street, Inc. |
| Sector: Technology | |
| SubSector: Application Software | |
| MarketCap: 288.762 Millions | |
| Recent Price: 2.81 Smart Investing & Trading Score: 25 | |
| Day Percent Change: 0.36% Day Change: 0.01 | |
| Week Change: 0.36% Year-to-date Change: -14.1% | |
| RMNI Links: Profile News Message Board | |
| Charts:- Daily , Weekly | |
| Add RMNI to Watchlist: View: Get Complete RMNI Trend Analysis ➞ | |
| For tabular summary view of above stock list: Summary View ➞ 0 - 25 , 25 - 50 , 50 - 75 , 75 - 100 , 100 - 125 , 125 - 150 , 150 - 175 , 175 - 200 , 200 - 225 , 225 - 250 , 250 - 275 , 275 - 300 , 300 - 325 , 325 - 350 , 350 - 375 , 375 - 400 , 400 - 425 , 425 - 450 , 450 - 475 , 475 - 500 , 500 - 525 , 525 - 550 , 550 - 575 , 575 - 600 , 600 - 625 , 625 - 650 , 650 - 675 , 675 - 700 , 700 - 725 , 725 - 750 , 750 - 775 , 775 - 800 , 800 - 825 , 825 - 850 , 850 - 875 , 875 - 900 , 900 - 925 , 925 - 950 , 950 - 975 , 975 - 1000 , 1000 - 1025 , 1025 - 1050 , 1050 - 1075 , 1075 - 1100 , 1100 - 1125 , 1125 - 1150 , 1150 - 1175 , 1175 - 1200 , 1200 - 1225 , 1225 - 1250 , 1250 - 1275 , 1275 - 1300 , 1300 - 1325 , 1325 - 1350 , 1350 - 1375 , 1375 - 1400 , 1400 - 1425 , 1425 - 1450 , 1450 - 1475 , 1475 - 1500 | ||
| Click To Change The Sort Order: By Market Cap or Company Size Performance: Year-to-date, Week and Day | |
| Select Chart Type: | ||
| Too many stocks? View smallcap stocks filtered by marketcap & sector |
| Marketcap: All SmallCap Stocks (default-no microcap), Large, Mid-Range, Small & MicroCap |
| Sector: Tech, Finance, Energy, Staples, Retail, Industrial, Materials, Utilities & Medical |
|
Best Stocks Today 12Stocks.com |
© 2024 12Stocks.com Terms & Conditions Privacy Contact Us
All Information Provided Only For Education And Not To Be Used For Investing or Trading. See Terms & Conditions


One More Thing ... Get Best Stocks Delivered Daily!
Never Ever Miss A Move With Our Top Ten Stocks Lists
Find Best Stocks In Any Market - Bull or Bear Market
Take A Peek At Our Top Ten Stocks Lists: Daily, Weekly, Year-to-Date & Top Trends
Find Best Stocks In Any Market - Bull or Bear Market
Take A Peek At Our Top Ten Stocks Lists: Daily, Weekly, Year-to-Date & Top Trends
Smallcap Stocks With Best Up Trends [0-bearish to 100-bullish]: Bakkt [100], Deciphera [100], Phibro Animal[100], Heartland Financial[100], Sight Sciences[100], TPI Composites[100], Fulton Financial[100], PTC [100], PaySign [100], Cullinan Oncology[100], Richardson Electronics[100]
Best Smallcap Stocks Year-to-Date:
CareMax [510.31%], Bakkt [363.68%], Viking [305.7%], Alpine Immune[239.57%], Longboard [232.41%], Super Micro[208.09%], Avidity Biosciences[177.32%], Cullinan Oncology[165.18%], Arcutis Bio[162.38%], Hippo [142.48%], Stoke [124.43%] Best Smallcap Stocks This Week:
Deciphera [72.05%], Phibro Animal[21.45%], Heartland Financial[19.15%], MultiPlan [16.09%], Sight Sciences[14.39%], Pacific Biosciences[13.27%], Codexis [12.59%], TPI Composites[11.87%], Velo3D [11.5%], Children s[11.14%], Zevia PBC[10.97%] Best Smallcap Stocks Daily:
Bakkt [2486.94%], Deciphera [72.05%], Phibro Animal[21.45%], Heartland Financial[19.15%], MultiPlan [16.09%], Sight Sciences[14.39%], Pacific Biosciences[13.27%], Codexis [12.59%], TPI Composites[11.87%], Velo3D [11.50%], Children s[11.14%]