
 Login Sign Up


| |||||
 |  | ||||

| 12Stocks.com Market Intelligence |
Best SmallCap Stocks
|
| In a hurry? Small Cap Stock Lists: Performance Trends Table, Stock Charts
Sort Small Cap stocks: Daily, Weekly, Year-to-Date, Market Cap & Trends. Filter Small Cap stocks list by sector: Show all, Tech, Finance, Energy, Staples, Retail, Industrial, Materials, Utilities and HealthCare Filter Small Cap stocks list by size: All Large Medium Small and MicroCap |
| 12Stocks.com Small Cap Stocks Performances & Trends Daily | |||||||||
|
|  The overall Smart Investing & Trading Score is 88 (0-bearish to 100-bullish) which puts Small Cap index in short term bullish trend. The Smart Investing & Trading Score from previous trading session is 56 and hence an improvement of trend.
| ||||||||
Here are the Smart Investing & Trading Scores of the most requested small cap stocks at 12Stocks.com (click stock name for detailed review):
|


| 12Stocks.com: Investing in Smallcap Index with Stocks | |
|
The following table helps investors and traders sort through current performance and trends (as measured by Smart Investing & Trading Score) of various
stocks in the Smallcap Index. Quick View: Move mouse or cursor over stock symbol (ticker) to view short-term technical chart and over stock name to view long term chart. Click on  to add stock symbol to your watchlist and to add stock symbol to your watchlist and  to view watchlist. Click on any ticker or stock name for detailed market intelligence report for that stock. to view watchlist. Click on any ticker or stock name for detailed market intelligence report for that stock. |
12Stocks.com Performance of Stocks in Smallcap Index
| Ticker | Stock Name | Watchlist | Category | Recent Price | Smart Investing & Trading Score | Change % | YTD Change% |
| BKH | Black Hills |   | Utilities | 54.45 | 88 | 1.10% | 0.93% |
| EQC | Equity Commonwealth | | Financials | 18.73 | 67 | 0.67% | -2.47% |
| ORA | Ormat | | Utilities | 64.00 | 52 | 1.41% | -15.56% |
| CHGG | Chegg | | Services & Goods | 6.88 | 35 | -3.17% | -39.48% |
| EXPO | Exponent | | Services & Goods | 93.86 | 100 | -1.42% | 6.61% |
| INST | Instructure | | Technology | 19.65 | 49 | 0.00% | -27.25% |
| HBI | Hanesbrands | | Consumer Staples | 4.54 | 28 | 1.23% | 1.68% |
| IOVA | Iovance Bio | | Health Care | 12.01 | 63 | 3.14% | 47.66% |
| ADPT | Adaptive Bio | | Health Care | 2.67 | 47 | 2.69% | -45.51% |
| AWR | American States | | Utilities | 70.45 | 62 | 0.77% | -12.40% |
| FFIN | First Financial | | Financials | 30.10 | 25 | -0.86% | -0.66% |
| QLYS | Qualys | | Technology | 168.84 | 32 | -0.90% | -13.98% |
| ARVN | Arvinas | | Health Care | 32.05 | 17 | -0.99% | -22.13% |
| SWX | Southwest Gas | | Utilities | 74.78 | 66 | -0.29% | 18.05% |
| APPF | AppFolio | | Technology | 242.21 | 90 | -0.22% | 39.81% |
| HQY | HealthEquity | | Technology | 80.50 | 78 | 0.31% | 21.43% |
| BLUE | bluebird bio | | Health Care | 0.98 | 37 | 5.86% | -29.21% |
| TRNO | Terreno Realty | | Financials | 54.80 | 10 | 1.24% | -12.56% |
| BCPC | Balchem | | Materials | 139.62 | 38 | 0.26% | -6.14% |
| NJR | New Jersey | | Utilities | 43.41 | 83 | 0.16% | -2.62% |
| RELY | Remitly Global | | Technology | 18.13 | 71 | 0.39% | -6.64% |
| HPP | Hudson Pacific | | Financials | 6.00 | 42 | 4.81% | -35.61% |
| NEOG | Neogen | | Health Care | 12.47 | 49 | 2.72% | -37.99% |
| ALLK | Allakos | | Health Care | 1.10 | 47 | 7.84% | -59.71% |
| ARWR | Arrowhead | | Health Care | 22.41 | 27 | 1.31% | -26.76% |
| For chart view version of above stock list: Chart View ➞ 0 - 25 , 25 - 50 , 50 - 75 , 75 - 100 , 100 - 125 , 125 - 150 , 150 - 175 , 175 - 200 , 200 - 225 , 225 - 250 , 250 - 275 , 275 - 300 , 300 - 325 , 325 - 350 , 350 - 375 , 375 - 400 , 400 - 425 , 425 - 450 , 450 - 475 , 475 - 500 , 500 - 525 , 525 - 550 , 550 - 575 , 575 - 600 , 600 - 625 , 625 - 650 , 650 - 675 , 675 - 700 , 700 - 725 , 725 - 750 , 750 - 775 , 775 - 800 , 800 - 825 , 825 - 850 , 850 - 875 , 875 - 900 , 900 - 925 , 925 - 950 , 950 - 975 , 975 - 1000 , 1000 - 1025 , 1025 - 1050 , 1050 - 1075 , 1075 - 1100 , 1100 - 1125 , 1125 - 1150 , 1150 - 1175 , 1175 - 1200 , 1200 - 1225 , 1225 - 1250 , 1250 - 1275 , 1275 - 1300 , 1300 - 1325 , 1325 - 1350 , 1350 - 1375 , 1375 - 1400 , 1400 - 1425 , 1425 - 1450 , 1450 - 1475 , 1475 - 1500 | ||
 | Click To Change The Sort Order: By Market Cap or Company Size Performance: Year-to-date, Week and Day |  |
| Too many stocks? View smallcap stocks filtered by marketcap & sector |
| Marketcap: All SmallCap Stocks (default-no microcap), Large, Mid-Range, Small |
| Smallcap Sector: Tech, Finance, Energy, Staples, Retail, Industrial, Materials, & Medical |
|
Get the most comprehensive stock market coverage daily at 12Stocks.com ➞ Best Stocks Today ➞ Best Stocks Weekly ➞ Best Stocks Year-to-Date ➞ Best Stocks Trends ➞  Best Stocks Today 12Stocks.com Best Nasdaq Stocks ➞ Best S&P 500 Stocks ➞ Best Tech Stocks ➞ Best Biotech Stocks ➞ |
| Detailed Overview of SmallCap Stocks |
| SmallCap Technical Overview, Leaders & Laggards, Top SmallCap ETF Funds & Detailed SmallCap Stocks List, Charts, Trends & More |
| Smallcap: Technical Analysis, Trends & YTD Performance | |
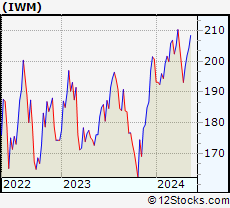
| SmallCap segment as represented by
IWM, an exchange-traded fund [ETF], holds basket of thousands of smallcap stocks from across all major sectors of the US stock market. The smallcap index (contains stocks like Riverbed & Sotheby's) is down by -0.44% and is currently underperforming the overall market by -6.94% year-to-date. Below is a quick view of technical charts and trends: | |
 IWM Weekly Chart |
|
| Long Term Trend: Very Good | |
| Medium Term Trend: Good | |
 IWM Daily Chart |
|
| Short Term Trend: Very Good | |
| Overall Trend Score: 88 | |
| YTD Performance: -0.44% | |
| **Trend Scores & Views Are Only For Educational Purposes And Not For Investing | |
| 12Stocks.com: Top Performing Small Cap Index Stocks | ||||||||||||||||||||||||||||||||||||||||||||||||
 The top performing Small Cap Index stocks year to date are
Now, more recently, over last week, the top performing Small Cap Index stocks on the move are


|
||||||||||||||||||||||||||||||||||||||||||||||||
| 12Stocks.com: Investing in Smallcap Index using Exchange Traded Funds | |
|
The following table shows list of key exchange traded funds (ETF) that
help investors track Smallcap index. The following list also includes leveraged ETF funds that track twice or thrice the daily returns of Smallcap indices. Short or inverse ETF funds move in the opposite direction to the index they track and are useful during market pullbacks or during bear markets. Quick View: Move mouse or cursor over ETF symbol (ticker) to view short-term technical chart and over ETF name to view long term chart. Click on ticker or stock name for detailed view. Click on to add stock symbol to your watchlist and to view watchlist. |
12Stocks.com List of ETFs that track Smallcap Index
| Ticker | ETF Name | Watchlist | Recent Price | Smart Investing & Trading Score | Change % | Week % | Year-to-date % |
| IWM | iShares Russell 2000 | | 199.82 | 88 | 0.72 | 0.72 | -0.44% |
| VTWO | Vanguard Russell 2000 ETF | | 80.77 | 88 | 0.69 | 0.69 | -0.41% |
| IWN | iShares Russell 2000 Value | | 152.09 | 93 | 0.63 | 0.63 | -2.09% |
| IJR | iShares Core S&P Small-Cap | | 106.37 | 93 | 0.68 | 0.68 | -1.74% |
| IWO | iShares Russell 2000 Growth | | 255.17 | 78 | 0.82 | 0.82 | 1.17% |
| IJS | iShares S&P Small-Cap 600 Value | | 97.96 | 70 | 0.79 | 0.79 | -4.96% |
| XSLV | PowerShares S&P SmallCap Low Volatil ETF | | 42.97 | 80 | 0.59 | 0.59 | -2.67% |
| IJT | iShares S&P Small-Cap 600 Growth | | 126.09 | 88 | 0.00 | 0 | 0.76% |
| SBB | ProShares Short SmallCap600 | | 16.31 | 8 | -0.46 | -0.46 | 2.39% |
| SMLV | SPDR SSGA US Small Cap Low Volatil ETF | | 107.77 | 75 | 0.23 | 0.23 | -4.22% |
| SAA | ProShares Ultra SmallCap600 | | 23.00 | 88 | -0.18 | -0.18 | -7.82% |
| SDD | ProShares UltraShort SmallCap600 | | 19.33 | 15 | -0.12 | -0.12 | 4.89% |
| 12Stocks.com: Charts, Trends, Fundamental Data and Performances of SmallCap Stocks | |
|
We now take in-depth look at all SmallCap stocks including charts, multi-period performances and overall trends (as measured by Smart Investing & Trading Score). One can sort SmallCap stocks (click link to choose) by Daily, Weekly and by Year-to-Date performances. Also, one can sort by size of the company or by market capitalization. |
| Select Your Default Chart Type: | |||||
| |||||
| Click on stock symbol or name for detailed view. Click on to add stock symbol to your watchlist and to view watchlist. Quick View: Move mouse or cursor over "Daily" to quickly view daily technical stock chart and over "Weekly" to view weekly technical stock chart. | |||||

 | BKH Black Hills Corporation |
| Sector: Utilities | |
| SubSector: Electric Utilities | |
| MarketCap: 3666.94 Millions | |
| Recent Price: 54.45 Smart Investing & Trading Score: 88 | |
| Day Percent Change: 1.10% Day Change: 0.59 | |
| Week Change: 1.1% Year-to-date Change: 0.9% | |
| BKH Links: Profile News Message Board | |
| Charts:- Daily , Weekly | |
| Add BKH to Watchlist: View: Get Complete BKH Trend Analysis ➞ | |
 | EQC Equity Commonwealth |
| Sector: Financials | |
| SubSector: REIT - Office | |
| MarketCap: 3659.36 Millions | |
| Recent Price: 18.73 Smart Investing & Trading Score: 67 | |
| Day Percent Change: 0.67% Day Change: 0.13 | |
| Week Change: 0.67% Year-to-date Change: -2.5% | |
| EQC Links: Profile News Message Board | |
| Charts:- Daily , Weekly | |
| Add EQC to Watchlist: View: Get Complete EQC Trend Analysis ➞ | |
 | ORA Ormat Technologies, Inc. |
| Sector: Utilities | |
| SubSector: Electric Utilities | |
| MarketCap: 3610.74 Millions | |
| Recent Price: 64.00 Smart Investing & Trading Score: 52 | |
| Day Percent Change: 1.41% Day Change: 0.89 | |
| Week Change: 1.41% Year-to-date Change: -15.6% | |
| ORA Links: Profile News Message Board | |
| Charts:- Daily , Weekly | |
| Add ORA to Watchlist: View: Get Complete ORA Trend Analysis ➞ | |
 | CHGG Chegg, Inc. |
| Sector: Services & Goods | |
| SubSector: Education & Training Services | |
| MarketCap: 3606.86 Millions | |
| Recent Price: 6.88 Smart Investing & Trading Score: 35 | |
| Day Percent Change: -3.17% Day Change: -0.22 | |
| Week Change: -3.17% Year-to-date Change: -39.5% | |
| CHGG Links: Profile News Message Board | |
| Charts:- Daily , Weekly | |
| Add CHGG to Watchlist: View: Get Complete CHGG Trend Analysis ➞ | |
 | EXPO Exponent, Inc. |
| Sector: Services & Goods | |
| SubSector: Management Services | |
| MarketCap: 3605.95 Millions | |
| Recent Price: 93.86 Smart Investing & Trading Score: 100 | |
| Day Percent Change: -1.42% Day Change: -1.35 | |
| Week Change: -1.42% Year-to-date Change: 6.6% | |
| EXPO Links: Profile News Message Board | |
| Charts:- Daily , Weekly | |
| Add EXPO to Watchlist: View: Get Complete EXPO Trend Analysis ➞ | |
 | INST Instructure Holdings, Inc. |
| Sector: Technology | |
| SubSector: Software - Application | |
| MarketCap: 3580 Millions | |
| Recent Price: 19.65 Smart Investing & Trading Score: 49 | |
| Day Percent Change: 0.00% Day Change: 0.00 | |
| Week Change: 0% Year-to-date Change: -27.3% | |
| INST Links: Profile News Message Board | |
| Charts:- Daily , Weekly | |
| Add INST to Watchlist: View: Get Complete INST Trend Analysis ➞ | |
 | HBI Hanesbrands Inc. |
| Sector: Consumer Staples | |
| SubSector: Textile - Apparel Clothing | |
| MarketCap: 3559.75 Millions | |
| Recent Price: 4.54 Smart Investing & Trading Score: 28 | |
| Day Percent Change: 1.23% Day Change: 0.05 | |
| Week Change: 1.23% Year-to-date Change: 1.7% | |
| HBI Links: Profile News Message Board | |
| Charts:- Daily , Weekly | |
| Add HBI to Watchlist: View: Get Complete HBI Trend Analysis ➞ | |
 | IOVA Iovance Biotherapeutics, Inc. |
| Sector: Health Care | |
| SubSector: Biotechnology | |
| MarketCap: 3533.35 Millions | |
| Recent Price: 12.01 Smart Investing & Trading Score: 63 | |
| Day Percent Change: 3.14% Day Change: 0.37 | |
| Week Change: 3.14% Year-to-date Change: 47.7% | |
| IOVA Links: Profile News Message Board | |
| Charts:- Daily , Weekly | |
| Add IOVA to Watchlist: View: Get Complete IOVA Trend Analysis ➞ | |
 | ADPT Adaptive Biotechnologies Corporation |
| Sector: Health Care | |
| SubSector: Biotechnology | |
| MarketCap: 3525.75 Millions | |
| Recent Price: 2.67 Smart Investing & Trading Score: 47 | |
| Day Percent Change: 2.69% Day Change: 0.07 | |
| Week Change: 2.69% Year-to-date Change: -45.5% | |
| ADPT Links: Profile News Message Board | |
| Charts:- Daily , Weekly | |
| Add ADPT to Watchlist: View: Get Complete ADPT Trend Analysis ➞ | |
 | AWR American States Water Company |
| Sector: Utilities | |
| SubSector: Water Utilities | |
| MarketCap: 3519.12 Millions | |
| Recent Price: 70.45 Smart Investing & Trading Score: 62 | |
| Day Percent Change: 0.77% Day Change: 0.54 | |
| Week Change: 0.77% Year-to-date Change: -12.4% | |
| AWR Links: Profile News Message Board | |
| Charts:- Daily , Weekly | |
| Add AWR to Watchlist: View: Get Complete AWR Trend Analysis ➞ | |
 | FFIN First Financial Bankshares, Inc. |
| Sector: Financials | |
| SubSector: Regional - Southwest Banks | |
| MarketCap: 3503.75 Millions | |
| Recent Price: 30.10 Smart Investing & Trading Score: 25 | |
| Day Percent Change: -0.86% Day Change: -0.26 | |
| Week Change: -0.86% Year-to-date Change: -0.7% | |
| FFIN Links: Profile News Message Board | |
| Charts:- Daily , Weekly | |
| Add FFIN to Watchlist: View: Get Complete FFIN Trend Analysis ➞ | |
 | QLYS Qualys, Inc. |
| Sector: Technology | |
| SubSector: Application Software | |
| MarketCap: 3475.02 Millions | |
| Recent Price: 168.84 Smart Investing & Trading Score: 32 | |
| Day Percent Change: -0.90% Day Change: -1.53 | |
| Week Change: -0.9% Year-to-date Change: -14.0% | |
| QLYS Links: Profile News Message Board | |
| Charts:- Daily , Weekly | |
| Add QLYS to Watchlist: View: Get Complete QLYS Trend Analysis ➞ | |
 | ARVN Arvinas, Inc. |
| Sector: Health Care | |
| SubSector: Biotechnology | |
| MarketCap: 3469.85 Millions | |
| Recent Price: 32.05 Smart Investing & Trading Score: 17 | |
| Day Percent Change: -0.99% Day Change: -0.32 | |
| Week Change: -0.99% Year-to-date Change: -22.1% | |
| ARVN Links: Profile News Message Board | |
| Charts:- Daily , Weekly | |
| Add ARVN to Watchlist: View: Get Complete ARVN Trend Analysis ➞ | |
 | SWX Southwest Gas Holdings, Inc. |
| Sector: Utilities | |
| SubSector: Gas Utilities | |
| MarketCap: 3427.87 Millions | |
| Recent Price: 74.78 Smart Investing & Trading Score: 66 | |
| Day Percent Change: -0.29% Day Change: -0.22 | |
| Week Change: -0.29% Year-to-date Change: 18.1% | |
| SWX Links: Profile News Message Board | |
| Charts:- Daily , Weekly | |
| Add SWX to Watchlist: View: Get Complete SWX Trend Analysis ➞ | |
 | APPF AppFolio, Inc. |
| Sector: Technology | |
| SubSector: Application Software | |
| MarketCap: 3412.02 Millions | |
| Recent Price: 242.21 Smart Investing & Trading Score: 90 | |
| Day Percent Change: -0.22% Day Change: -0.54 | |
| Week Change: -0.22% Year-to-date Change: 39.8% | |
| APPF Links: Profile News Message Board | |
| Charts:- Daily , Weekly | |
| Add APPF to Watchlist: View: Get Complete APPF Trend Analysis ➞ | |
 | HQY HealthEquity, Inc. |
| Sector: Technology | |
| SubSector: Healthcare Information Services | |
| MarketCap: 3369.75 Millions | |
| Recent Price: 80.50 Smart Investing & Trading Score: 78 | |
| Day Percent Change: 0.31% Day Change: 0.24 | |
| Week Change: 0.31% Year-to-date Change: 21.4% | |
| HQY Links: Profile News Message Board | |
| Charts:- Daily , Weekly | |
| Add HQY to Watchlist: View: Get Complete HQY Trend Analysis ➞ | |
 | BLUE bluebird bio, Inc. |
| Sector: Health Care | |
| SubSector: Biotechnology | |
| MarketCap: 3365.05 Millions | |
| Recent Price: 0.98 Smart Investing & Trading Score: 37 | |
| Day Percent Change: 5.86% Day Change: 0.05 | |
| Week Change: 5.86% Year-to-date Change: -29.2% | |
| BLUE Links: Profile News Message Board | |
| Charts:- Daily , Weekly | |
| Add BLUE to Watchlist: View: Get Complete BLUE Trend Analysis ➞ | |
 | TRNO Terreno Realty Corporation |
| Sector: Financials | |
| SubSector: REIT - Industrial | |
| MarketCap: 3359.69 Millions | |
| Recent Price: 54.80 Smart Investing & Trading Score: 10 | |
| Day Percent Change: 1.24% Day Change: 0.67 | |
| Week Change: 1.24% Year-to-date Change: -12.6% | |
| TRNO Links: Profile News Message Board | |
| Charts:- Daily , Weekly | |
| Add TRNO to Watchlist: View: Get Complete TRNO Trend Analysis ➞ | |
 | BCPC Balchem Corporation |
| Sector: Materials | |
| SubSector: Specialty Chemicals | |
| MarketCap: 3330.17 Millions | |
| Recent Price: 139.62 Smart Investing & Trading Score: 38 | |
| Day Percent Change: 0.26% Day Change: 0.36 | |
| Week Change: 0.26% Year-to-date Change: -6.1% | |
| BCPC Links: Profile News Message Board | |
| Charts:- Daily , Weekly | |
| Add BCPC to Watchlist: View: Get Complete BCPC Trend Analysis ➞ | |
 | NJR New Jersey Resources Corporation |
| Sector: Utilities | |
| SubSector: Gas Utilities | |
| MarketCap: 3320.27 Millions | |
| Recent Price: 43.41 Smart Investing & Trading Score: 83 | |
| Day Percent Change: 0.16% Day Change: 0.07 | |
| Week Change: 0.16% Year-to-date Change: -2.6% | |
| NJR Links: Profile News Message Board | |
| Charts:- Daily , Weekly | |
| Add NJR to Watchlist: View: Get Complete NJR Trend Analysis ➞ | |
 | RELY Remitly Global, Inc. |
| Sector: Technology | |
| SubSector: Software - Infrastructure | |
| MarketCap: 3320 Millions | |
| Recent Price: 18.13 Smart Investing & Trading Score: 71 | |
| Day Percent Change: 0.39% Day Change: 0.07 | |
| Week Change: 0.39% Year-to-date Change: -6.6% | |
| RELY Links: Profile News Message Board | |
| Charts:- Daily , Weekly | |
| Add RELY to Watchlist: View: Get Complete RELY Trend Analysis ➞ | |
 | HPP Hudson Pacific Properties, Inc. |
| Sector: Financials | |
| SubSector: REIT - Office | |
| MarketCap: 3267.16 Millions | |
| Recent Price: 6.00 Smart Investing & Trading Score: 42 | |
| Day Percent Change: 4.81% Day Change: 0.28 | |
| Week Change: 4.81% Year-to-date Change: -35.6% | |
| HPP Links: Profile News Message Board | |
| Charts:- Daily , Weekly | |
| Add HPP to Watchlist: View: Get Complete HPP Trend Analysis ➞ | |
 | NEOG Neogen Corporation |
| Sector: Health Care | |
| SubSector: Diagnostic Substances | |
| MarketCap: 3234.71 Millions | |
| Recent Price: 12.47 Smart Investing & Trading Score: 49 | |
| Day Percent Change: 2.72% Day Change: 0.33 | |
| Week Change: 2.72% Year-to-date Change: -38.0% | |
| NEOG Links: Profile News Message Board | |
| Charts:- Daily , Weekly | |
| Add NEOG to Watchlist: View: Get Complete NEOG Trend Analysis ➞ | |
 | ALLK Allakos Inc. |
| Sector: Health Care | |
| SubSector: Biotechnology | |
| MarketCap: 3233.55 Millions | |
| Recent Price: 1.10 Smart Investing & Trading Score: 47 | |
| Day Percent Change: 7.84% Day Change: 0.08 | |
| Week Change: 7.84% Year-to-date Change: -59.7% | |
| ALLK Links: Profile News Message Board | |
| Charts:- Daily , Weekly | |
| Add ALLK to Watchlist: View: Get Complete ALLK Trend Analysis ➞ | |
 | ARWR Arrowhead Pharmaceuticals, Inc. |
| Sector: Health Care | |
| SubSector: Biotechnology | |
| MarketCap: 3226.15 Millions | |
| Recent Price: 22.41 Smart Investing & Trading Score: 27 | |
| Day Percent Change: 1.31% Day Change: 0.29 | |
| Week Change: 1.31% Year-to-date Change: -26.8% | |
| ARWR Links: Profile News Message Board | |
| Charts:- Daily , Weekly | |
| Add ARWR to Watchlist: View: Get Complete ARWR Trend Analysis ➞ | |
| For tabular summary view of above stock list: Summary View ➞ 0 - 25 , 25 - 50 , 50 - 75 , 75 - 100 , 100 - 125 , 125 - 150 , 150 - 175 , 175 - 200 , 200 - 225 , 225 - 250 , 250 - 275 , 275 - 300 , 300 - 325 , 325 - 350 , 350 - 375 , 375 - 400 , 400 - 425 , 425 - 450 , 450 - 475 , 475 - 500 , 500 - 525 , 525 - 550 , 550 - 575 , 575 - 600 , 600 - 625 , 625 - 650 , 650 - 675 , 675 - 700 , 700 - 725 , 725 - 750 , 750 - 775 , 775 - 800 , 800 - 825 , 825 - 850 , 850 - 875 , 875 - 900 , 900 - 925 , 925 - 950 , 950 - 975 , 975 - 1000 , 1000 - 1025 , 1025 - 1050 , 1050 - 1075 , 1075 - 1100 , 1100 - 1125 , 1125 - 1150 , 1150 - 1175 , 1175 - 1200 , 1200 - 1225 , 1225 - 1250 , 1250 - 1275 , 1275 - 1300 , 1300 - 1325 , 1325 - 1350 , 1350 - 1375 , 1375 - 1400 , 1400 - 1425 , 1425 - 1450 , 1450 - 1475 , 1475 - 1500 | ||
| Click To Change The Sort Order: By Market Cap or Company Size Performance: Year-to-date, Week and Day | |
| Select Chart Type: | ||
| Too many stocks? View smallcap stocks filtered by marketcap & sector |
| Marketcap: All SmallCap Stocks (default-no microcap), Large, Mid-Range, Small & MicroCap |
| Sector: Tech, Finance, Energy, Staples, Retail, Industrial, Materials, Utilities & Medical |
|
Best Stocks Today 12Stocks.com |
© 2024 12Stocks.com Terms & Conditions Privacy Contact Us
All Information Provided Only For Education And Not To Be Used For Investing or Trading. See Terms & Conditions


One More Thing ... Get Best Stocks Delivered Daily!
Never Ever Miss A Move With Our Top Ten Stocks Lists
Find Best Stocks In Any Market - Bull or Bear Market
Take A Peek At Our Top Ten Stocks Lists: Daily, Weekly, Year-to-Date & Top Trends
Find Best Stocks In Any Market - Bull or Bear Market
Take A Peek At Our Top Ten Stocks Lists: Daily, Weekly, Year-to-Date & Top Trends
Smallcap Stocks With Best Up Trends [0-bearish to 100-bullish]: Bakkt [100], Deciphera [100], Phibro Animal[100], Heartland Financial[100], Sight Sciences[100], TPI Composites[100], Fulton Financial[100], PTC [100], PaySign [100], Cullinan Oncology[100], Richardson Electronics[100]
Best Smallcap Stocks Year-to-Date:
CareMax [510.31%], Bakkt [363.68%], Viking [305.7%], Alpine Immune[239.57%], Longboard [232.41%], Super Micro[208.09%], Avidity Biosciences[177.32%], Cullinan Oncology[165.18%], Arcutis Bio[162.38%], Hippo [142.48%], Stoke [124.43%] Best Smallcap Stocks This Week:
Deciphera [72.05%], Phibro Animal[21.45%], Heartland Financial[19.15%], MultiPlan [16.09%], Sight Sciences[14.39%], Pacific Biosciences[13.27%], Codexis [12.59%], TPI Composites[11.87%], Velo3D [11.5%], Children s[11.14%], Zevia PBC[10.97%] Best Smallcap Stocks Daily:
Bakkt [2486.94%], Deciphera [72.05%], Phibro Animal[21.45%], Heartland Financial[19.15%], MultiPlan [16.09%], Sight Sciences[14.39%], Pacific Biosciences[13.27%], Codexis [12.59%], TPI Composites[11.87%], Velo3D [11.50%], Children s[11.14%]