
 Login Sign Up


| |||||
 |  | ||||

| 12Stocks.com Market Intelligence |
Best Materials Stocks
| In a hurry? Materials Stocks Lists: Performance Trends Table, Stock Charts
Sort Materials stocks: Daily, Weekly, Year-to-Date, Market Cap & Trends. Filter Materials stocks list by size: All Materials Large Mid-Range Small |
| 12Stocks.com Materials Stocks Performances & Trends Daily | |||||||||
|
|  The overall Smart Investing & Trading Score is 50 (0-bearish to 100-bullish) which puts Materials sector in short term neutral trend. The Smart Investing & Trading Score from previous trading session is 90 and hence a deterioration of trend.
| ||||||||
Here are the Smart Investing & Trading Scores of the most requested Materials stocks at 12Stocks.com (click stock name for detailed review):
|


| Consider signing up for our daily 12Stocks.com "Best Stocks Newsletter". You will never ever miss a big stock move again! |
| 12Stocks.com: Investing in Materials sector with Stocks | |
|
The following table helps investors and traders sort through current performance and trends (as measured by Smart Investing & Trading Score) of various
stocks in the Materials sector. Quick View: Move mouse or cursor over stock symbol (ticker) to view short-term Technical chart and over stock name to view long term chart. Click on  to add stock symbol to your watchlist and to add stock symbol to your watchlist and  to view watchlist. Click on any ticker or stock name for detailed market intelligence report for that stock. to view watchlist. Click on any ticker or stock name for detailed market intelligence report for that stock. |
12Stocks.com Performance of Stocks in Materials Sector
| Ticker | Stock Name | Watchlist | Category | Recent Price | Smart Investing & Trading Score | Change % | YTD Change% |
| WDFC | WD-40 |   | Chemicals | 216.04 | 0 | -0.27% | -8.09% |
| PAAS | Pan American | | Silver | 33.92 | 100 | 2.46% | 59.81% |
| BVN | Compania de | | Metals/Minerals | 19.14 | 100 | 0.49% | 62.82% |
| BTG | B2Gold | | Gold | 4.13 | 100 | 2.36% | 61.91% |
| ASH | Ashland Global | | Chemicals | 56.15 | 50 | -0.33% | -23.46% |
| CCJ | Cameco | | Metals/Minerals | 77.39 | 40 | 1.36% | 39.00% |
| BAK | Braskem S.A | | Chemicals | 3.48 | 60 | 4.48% | -21.50% |
| KNF | Knife River | | Building Materials | 81.00 | 30 | 1.14% | -13.73% |
| TX | Ternium S.A | | Steel & Iron | 33.16 | 100 | 1.22% | 18.44% |
| NG | NovaGold | | Gold | 6.84 | 100 | 0.51% | 78.68% |
| KWR | Quaker Chemical | | Chemicals | 145.07 | 50 | -0.05% | -1.51% |
| OLN | Olin | | Chemicals | 23.66 | 100 | -1.17% | -36.71% |
| SID | Companhia Siderurgica | | Steel & Iron | 1.41 | 60 | 1.60% | -11.81% |
| SXT | Sensient Technologies | | Chemicals | 113.46 | 30 | 0.65% | 62.67% |
| ESI | Element | | Chemicals | 25.72 | 50 | -0.24% | -1.06% |
| SCL | Stepan | | Chemicals | 50.03 | 0 | 0.22% | -22.01% |
| AGI | Alamos Gold | | Gold | 30.45 | 100 | 4.79% | 50.94% |
| CMC | Commercial Metals | | Steel & Iron | 57.67 | 70 | -0.19% | 14.78% |
| CC | Chemours | | Chemicals | 15.40 | 90 | -1.32% | -14.19% |
| SLVM | Sylvamo | | Paper & Paper Products | 46.13 | 30 | -3.86% | -46.20% |
| IOSP | Innospec | | Chemicals | 87.59 | 50 | 0.41% | -22.96% |
| FUL | H.B. Fuller | | Chemicals | 61.05 | 40 | -0.08% | -11.08% |
| SSRM | SSR | | Gold | 19.31 | 100 | 2.86% | 143.10% |
| CMP | Compass Minerals | | Metals/Minerals | 19.05 | 20 | 1.54% | 69.78% |
| HMY | Harmony Gold | | Gold | 13.28 | 30 | 2.71% | 95.23% |
| For chart view version of above stock list: Chart View ➞ 0 - 25 , 25 - 50 , 50 - 75 , 75 - 100 , 100 - 125 , 125 - 150 , 150 - 175 | ||
 | Click To Change The Sort Order: By Market Cap or Company Size Performance: Year-to-date, Week and Day |  |
|
Get the most comprehensive stock market coverage daily at 12Stocks.com ➞ Best Stocks Today ➞ Best Stocks Weekly ➞ Best Stocks Year-to-Date ➞ Best Stocks Trends ➞  Best Stocks Today 12Stocks.com Best Nasdaq Stocks ➞ Best S&P 500 Stocks ➞ Best Tech Stocks ➞ Best Biotech Stocks ➞ |
| Detailed Overview of Materials Stocks |
| Materials Technical Overview, Leaders & Laggards, Top Materials ETF Funds & Detailed Materials Stocks List, Charts, Trends & More |
| Materials Sector: Technical Analysis, Trends & YTD Performance | |
| Materials sector is composed of stocks
from mining, metals, agricultural, precious metals
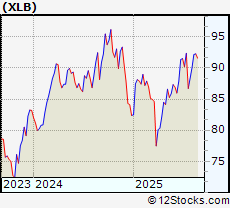
and chemical subsectors. Materials sector, as represented by XLB, an exchange-traded fund [ETF] that holds basket of Materials stocks (e.g, Dow Chemical, Newmont Mining) is up by 4.17% and is currently underperforming the overall market by -2.35% year-to-date. Below is a quick view of Technical charts and trends: |
|
 XLB Weekly Chart |
|
| Long Term Trend: Very Good | |
| Medium Term Trend: Very Good | |
 XLB Daily Chart |
|
| Short Term Trend: Not Good | |
| Overall Trend Score: 50 | |
| YTD Performance: 4.17% | |
| **Trend Scores & Views Are Only For Educational Purposes And Not For Investing | |
| 12Stocks.com: Top Performing Materials Sector Stocks | ||||||||||||||||||||||||||||||||||||||||||||||||
 The top performing Materials sector stocks year to date are
Now, more recently, over last week, the top performing Materials sector stocks on the move are


|
||||||||||||||||||||||||||||||||||||||||||||||||
| 12Stocks.com: Investing in Materials Sector using Exchange Traded Funds | |
|
The following table shows list of key exchange traded funds (ETF) that
help investors track Materials Index. For detailed view, check out our ETF Funds section of our website. Quick View: Move mouse or cursor over ETF symbol (ticker) to view short-term Technical chart and over ETF name to view long term chart. Click on ticker or stock name for detailed view. Click on to add stock symbol to your watchlist and to view watchlist. |
12Stocks.com List of ETFs that track Materials Index
| Ticker | ETF Name | Watchlist | Recent Price | Smart Investing & Trading Score | Change % | Week % | Year-to-date % |
| XLB | Materials | | 91.59 | 50 | -0.75 | -0.75 | 4.17% |
| IYM | Basic Materials | | 149.09 | 60 | 0.24 | 0.13 | 13.21% |
| VAW | Materials | | 208.36 | 60 | 0.22 | 0.06 | 9.5% |
| GDX | Gold Miners | | 64.8 | 100 | 2.58 | 2.58 | 66.32% |
| UYM | Basic Materials | | 25.76 | 50 | 4.43 | 5.28 | 3.59% |
| XME | Metals and Mining | | 82.33 | 90 | 3.45 | 0.48 | 35.53% |
| MOO | Agribusiness | | 74.81 | 30 | 1.53 | 2.58 | 9.25% |
| DBA | Agriculture | | 27.77 | 50 | 1.14 | 1.96 | -0.04% |
| GLD | Gold | | 325.59 | 100 | 2.36 | 2.36 | 25.92% |
| SLV | Silver | | 36.19 | 100 | 2.08 | 2.41 | 23.92% |
| SLX | Steel | | 71.09 | 30 | 3.27 | 2.01 | 16.52% |
| COPX | Copper Miners | | 49.81 | 100 | 0.78 | 0.28 | 22.81% |
| SIL | Silver Miners | | 58.10 | 100 | 1.7 | 0.22 | 70% |
| MXI | Global Materials | | 90.09 | 60 | 0.11 | 0.47 | 14.18% |
| RTM | S&P 500 Eq | | 33.93 | 90 | 0.59 | 0.27 | 2.57% |
| GDXJ | Junior Gold Miners | | 80.05 | 100 | 2.03 | 2.75 | 74.9% |
| 12Stocks.com: Charts, Trends, Fundamental Data and Performances of Materials Stocks | |
|
We now take in-depth look at all Materials stocks including charts, multi-period performances and overall trends (as measured by Smart Investing & Trading Score). One can sort Materials stocks (click link to choose) by Daily, Weekly and by Year-to-Date performances. Also, one can sort by size of the company or by market capitalization. |
| Select Your Default Chart Type: | |||||
| |||||
| Click on stock symbol or name for detailed view. Click on to add stock symbol to your watchlist and to view watchlist. Quick View: Move mouse or cursor over "Daily" to quickly view daily Technical stock chart and over "Weekly" to view weekly Technical stock chart. | |||||

 | WDFC WD-40 Company |
| Sector: Materials | |
| SubSector: Specialty Chemicals | |
| MarketCap: 2900.57 Millions | |
| Recent Price: 216.04 Smart Investing & Trading Score: 0 | |
| Day Percent Change: -0.27% Day Change: -0.6 | |
| Week Change: -1.09% Year-to-date Change: -8.1% | |
| WDFC Links: Profile News Message Board | |
| Charts:- Daily , Weekly | |
| Add WDFC to Watchlist: View: Get Complete WDFC Trend Analysis ➞ | |
 | PAAS Pan American Silver Corp. |
| Sector: Materials | |
| SubSector: Silver | |
| MarketCap: 2832.56 Millions | |
| Recent Price: 33.92 Smart Investing & Trading Score: 100 | |
| Day Percent Change: 2.46% Day Change: 0.77 | |
| Week Change: 2.01% Year-to-date Change: 59.8% | |
| PAAS Links: Profile News Message Board | |
| Charts:- Daily , Weekly | |
| Add PAAS to Watchlist: View: Get Complete PAAS Trend Analysis ➞ | |
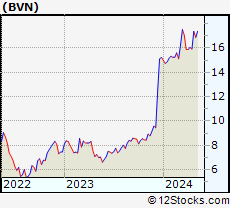 | BVN Compania de Minas Buenaventura S.A.A. |
| Sector: Materials | |
| SubSector: Industrial Metals & Minerals | |
| MarketCap: 2827.8 Millions | |
| Recent Price: 19.14 Smart Investing & Trading Score: 100 | |
| Day Percent Change: 0.49% Day Change: 0.09 | |
| Week Change: 0.77% Year-to-date Change: 62.8% | |
| BVN Links: Profile News Message Board | |
| Charts:- Daily , Weekly | |
| Add BVN to Watchlist: View: Get Complete BVN Trend Analysis ➞ | |
 | BTG B2Gold Corp. |
| Sector: Materials | |
| SubSector: Gold | |
| MarketCap: 2792.39 Millions | |
| Recent Price: 4.13 Smart Investing & Trading Score: 100 | |
| Day Percent Change: 2.36% Day Change: 0.09 | |
| Week Change: 1.83% Year-to-date Change: 61.9% | |
| BTG Links: Profile News Message Board | |
| Charts:- Daily , Weekly | |
| Add BTG to Watchlist: View: Get Complete BTG Trend Analysis ➞ | |
 | ASH Ashland Global Holdings Inc. |
| Sector: Materials | |
| SubSector: Chemicals - Major Diversified | |
| MarketCap: 2764.16 Millions | |
| Recent Price: 56.15 Smart Investing & Trading Score: 50 | |
| Day Percent Change: -0.33% Day Change: -0.18 | |
| Week Change: -0.33% Year-to-date Change: -23.5% | |
| ASH Links: Profile News Message Board | |
| Charts:- Daily , Weekly | |
| Add ASH to Watchlist: View: Get Complete ASH Trend Analysis ➞ | |
 | CCJ Cameco Corporation |
| Sector: Materials | |
| SubSector: Industrial Metals & Minerals | |
| MarketCap: 2722.9 Millions | |
| Recent Price: 77.39 Smart Investing & Trading Score: 40 | |
| Day Percent Change: 1.36% Day Change: 0.96 | |
| Week Change: -5.45% Year-to-date Change: 39.0% | |
| CCJ Links: Profile News Message Board | |
| Charts:- Daily , Weekly | |
| Add CCJ to Watchlist: View: Get Complete CCJ Trend Analysis ➞ | |
 | BAK Braskem S.A. |
| Sector: Materials | |
| SubSector: Chemicals - Major Diversified | |
| MarketCap: 2715.86 Millions | |
| Recent Price: 3.48 Smart Investing & Trading Score: 60 | |
| Day Percent Change: 4.48% Day Change: 0.13 | |
| Week Change: 5.21% Year-to-date Change: -21.5% | |
| BAK Links: Profile News Message Board | |
| Charts:- Daily , Weekly | |
| Add BAK to Watchlist: View: Get Complete BAK Trend Analysis ➞ | |
 | KNF Knife River Corporation |
| Sector: Materials | |
| SubSector: Building Materials | |
| MarketCap: 2570 Millions | |
| Recent Price: 81.00 Smart Investing & Trading Score: 30 | |
| Day Percent Change: 1.14% Day Change: 0.99 | |
| Week Change: -3.65% Year-to-date Change: -13.7% | |
| KNF Links: Profile News Message Board | |
| Charts:- Daily , Weekly | |
| Add KNF to Watchlist: View: Get Complete KNF Trend Analysis ➞ | |
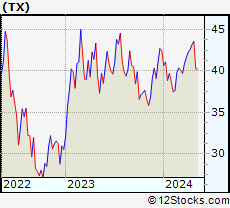 | TX Ternium S.A. |
| Sector: Materials | |
| SubSector: Steel & Iron | |
| MarketCap: 2568.88 Millions | |
| Recent Price: 33.16 Smart Investing & Trading Score: 100 | |
| Day Percent Change: 1.22% Day Change: 0.39 | |
| Week Change: 0.22% Year-to-date Change: 18.4% | |
| TX Links: Profile News Message Board | |
| Charts:- Daily , Weekly | |
| Add TX to Watchlist: View: Get Complete TX Trend Analysis ➞ | |
 | NG NovaGold Resources Inc. |
| Sector: Materials | |
| SubSector: Gold | |
| MarketCap: 2499.49 Millions | |
| Recent Price: 6.84 Smart Investing & Trading Score: 100 | |
| Day Percent Change: 0.51% Day Change: 0.03 | |
| Week Change: -0.34% Year-to-date Change: 78.7% | |
| NG Links: Profile News Message Board | |
| Charts:- Daily , Weekly | |
| Add NG to Watchlist: View: Get Complete NG Trend Analysis ➞ | |
 | KWR Quaker Chemical Corporation |
| Sector: Materials | |
| SubSector: Specialty Chemicals | |
| MarketCap: 2411.67 Millions | |
| Recent Price: 145.07 Smart Investing & Trading Score: 50 | |
| Day Percent Change: -0.05% Day Change: -0.07 | |
| Week Change: 0.51% Year-to-date Change: -1.5% | |
| KWR Links: Profile News Message Board | |
| Charts:- Daily , Weekly | |
| Add KWR to Watchlist: View: Get Complete KWR Trend Analysis ➞ | |
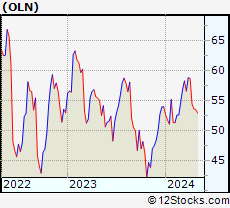 | OLN Olin Corporation |
| Sector: Materials | |
| SubSector: Specialty Chemicals | |
| MarketCap: 2126.87 Millions | |
| Recent Price: 23.66 Smart Investing & Trading Score: 100 | |
| Day Percent Change: -1.17% Day Change: -0.25 | |
| Week Change: -2.59% Year-to-date Change: -36.7% | |
| OLN Links: Profile News Message Board | |
| Charts:- Daily , Weekly | |
| Add OLN to Watchlist: View: Get Complete OLN Trend Analysis ➞ | |
 | SID Companhia Siderurgica Nacional |
| Sector: Materials | |
| SubSector: Steel & Iron | |
| MarketCap: 2087.58 Millions | |
| Recent Price: 1.41 Smart Investing & Trading Score: 60 | |
| Day Percent Change: 1.6% Day Change: 0.02 | |
| Week Change: -3.79% Year-to-date Change: -11.8% | |
| SID Links: Profile News Message Board | |
| Charts:- Daily , Weekly | |
| Add SID to Watchlist: View: Get Complete SID Trend Analysis ➞ | |
 | SXT Sensient Technologies Corporation |
| Sector: Materials | |
| SubSector: Specialty Chemicals | |
| MarketCap: 1961.37 Millions | |
| Recent Price: 113.46 Smart Investing & Trading Score: 30 | |
| Day Percent Change: 0.65% Day Change: 0.74 | |
| Week Change: -1.02% Year-to-date Change: 62.7% | |
| SXT Links: Profile News Message Board | |
| Charts:- Daily , Weekly | |
| Add SXT to Watchlist: View: Get Complete SXT Trend Analysis ➞ | |
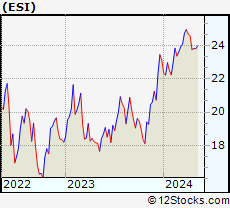 | ESI Element Solutions Inc |
| Sector: Materials | |
| SubSector: Specialty Chemicals | |
| MarketCap: 1924.77 Millions | |
| Recent Price: 25.72 Smart Investing & Trading Score: 50 | |
| Day Percent Change: -0.24% Day Change: -0.06 | |
| Week Change: -0.91% Year-to-date Change: -1.1% | |
| ESI Links: Profile News Message Board | |
| Charts:- Daily , Weekly | |
| Add ESI to Watchlist: View: Get Complete ESI Trend Analysis ➞ | |
 | SCL Stepan Company |
| Sector: Materials | |
| SubSector: Specialty Chemicals | |
| MarketCap: 1812.97 Millions | |
| Recent Price: 50.03 Smart Investing & Trading Score: 0 | |
| Day Percent Change: 0.22% Day Change: 0.11 | |
| Week Change: -1.13% Year-to-date Change: -22.0% | |
| SCL Links: Profile News Message Board | |
| Charts:- Daily , Weekly | |
| Add SCL to Watchlist: View: Get Complete SCL Trend Analysis ➞ | |
 | AGI Alamos Gold Inc. |
| Sector: Materials | |
| SubSector: Gold | |
| MarketCap: 1740.39 Millions | |
| Recent Price: 30.45 Smart Investing & Trading Score: 100 | |
| Day Percent Change: 4.79% Day Change: 1.27 | |
| Week Change: 9.37% Year-to-date Change: 50.9% | |
| AGI Links: Profile News Message Board | |
| Charts:- Daily , Weekly | |
| Add AGI to Watchlist: View: Get Complete AGI Trend Analysis ➞ | |
 | CMC Commercial Metals Company |
| Sector: Materials | |
| SubSector: Steel & Iron | |
| MarketCap: 1724.78 Millions | |
| Recent Price: 57.67 Smart Investing & Trading Score: 70 | |
| Day Percent Change: -0.19% Day Change: -0.11 | |
| Week Change: -1.44% Year-to-date Change: 14.8% | |
| CMC Links: Profile News Message Board | |
| Charts:- Daily , Weekly | |
| Add CMC to Watchlist: View: Get Complete CMC Trend Analysis ➞ | |
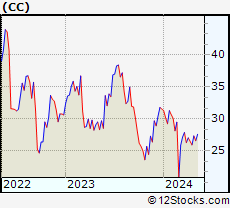 | CC The Chemours Company |
| Sector: Materials | |
| SubSector: Specialty Chemicals | |
| MarketCap: 1718.17 Millions | |
| Recent Price: 15.40 Smart Investing & Trading Score: 90 | |
| Day Percent Change: -1.32% Day Change: -0.19 | |
| Week Change: -6.1% Year-to-date Change: -14.2% | |
| CC Links: Profile News Message Board | |
| Charts:- Daily , Weekly | |
| Add CC to Watchlist: View: Get Complete CC Trend Analysis ➞ | |
 | SLVM Sylvamo Corporation |
| Sector: Materials | |
| SubSector: Paper & Paper Products | |
| MarketCap: 1710 Millions | |
| Recent Price: 46.13 Smart Investing & Trading Score: 30 | |
| Day Percent Change: -3.86% Day Change: -1.67 | |
| Week Change: -6.94% Year-to-date Change: -46.2% | |
| SLVM Links: Profile News Message Board | |
| Charts:- Daily , Weekly | |
| Add SLVM to Watchlist: View: Get Complete SLVM Trend Analysis ➞ | |
 | IOSP Innospec Inc. |
| Sector: Materials | |
| SubSector: Specialty Chemicals | |
| MarketCap: 1665.57 Millions | |
| Recent Price: 87.59 Smart Investing & Trading Score: 50 | |
| Day Percent Change: 0.41% Day Change: 0.34 | |
| Week Change: 0.62% Year-to-date Change: -23.0% | |
| IOSP Links: Profile News Message Board | |
| Charts:- Daily , Weekly | |
| Add IOSP to Watchlist: View: Get Complete IOSP Trend Analysis ➞ | |
 | FUL H.B. Fuller Company |
| Sector: Materials | |
| SubSector: Specialty Chemicals | |
| MarketCap: 1655.67 Millions | |
| Recent Price: 61.05 Smart Investing & Trading Score: 40 | |
| Day Percent Change: -0.08% Day Change: -0.05 | |
| Week Change: -0.19% Year-to-date Change: -11.1% | |
| FUL Links: Profile News Message Board | |
| Charts:- Daily , Weekly | |
| Add FUL to Watchlist: View: Get Complete FUL Trend Analysis ➞ | |
 | SSRM SSR Mining Inc. |
| Sector: Materials | |
| SubSector: Gold | |
| MarketCap: 1546.09 Millions | |
| Recent Price: 19.31 Smart Investing & Trading Score: 100 | |
| Day Percent Change: 2.86% Day Change: 0.47 | |
| Week Change: 5.22% Year-to-date Change: 143.1% | |
| SSRM Links: Profile News Message Board | |
| Charts:- Daily , Weekly | |
| Add SSRM to Watchlist: View: Get Complete SSRM Trend Analysis ➞ | |
 | CMP Compass Minerals International, Inc. |
| Sector: Materials | |
| SubSector: Industrial Metals & Minerals | |
| MarketCap: 1512.1 Millions | |
| Recent Price: 19.05 Smart Investing & Trading Score: 20 | |
| Day Percent Change: 1.54% Day Change: 0.29 | |
| Week Change: 1.92% Year-to-date Change: 69.8% | |
| CMP Links: Profile News Message Board | |
| Charts:- Daily , Weekly | |
| Add CMP to Watchlist: View: Get Complete CMP Trend Analysis ➞ | |
 | HMY Harmony Gold Mining Company Limited |
| Sector: Materials | |
| SubSector: Gold | |
| MarketCap: 1371.69 Millions | |
| Recent Price: 13.28 Smart Investing & Trading Score: 30 | |
| Day Percent Change: 2.71% Day Change: 0.42 | |
| Week Change: 4.26% Year-to-date Change: 95.2% | |
| HMY Links: Profile News Message Board | |
| Charts:- Daily , Weekly | |
| Add HMY to Watchlist: View: Get Complete HMY Trend Analysis ➞ | |
| For tabular summary view of above stock list: Summary View ➞ 0 - 25 , 25 - 50 , 50 - 75 , 75 - 100 , 100 - 125 , 125 - 150 , 150 - 175 | ||
| Click To Change The Sort Order: By Market Cap or Company Size Performance: Year-to-date, Week and Day | |
| Select Chart Type: | ||
|
Best Stocks Today 12Stocks.com |
© 2025 12Stocks.com Terms & Conditions Privacy Contact Us
All Information Provided Only For Education And Not To Be Used For Investing or Trading. See Terms & Conditions


One More Thing ... Get Best Stocks Delivered Daily!
Never Ever Miss A Move With Our Top Ten Stocks Lists
Find Best Stocks In Any Market - Bull or Bear Market
Take A Peek At Our Top Ten Stocks Lists: Daily, Weekly, Year-to-Date & Top Trends
Find Best Stocks In Any Market - Bull or Bear Market
Take A Peek At Our Top Ten Stocks Lists: Daily, Weekly, Year-to-Date & Top Trends
Materials Stocks With Best Up Trends [0-bearish to 100-bullish]: DRDGOLD [100], Green Plains[100], Gold Royalty[100], i-80 Gold[100], Alamos Gold[100], Vox Royalty[100], Endeavour Silver[100], Fortuna Silver[100], IAMGOLD [100], New Gold[100], New Found[100]
Best Materials Stocks Year-to-Date:
MP [337.69%], Dominion Diamond[207.43%], Gold Royalty[161.16%], Sibanye Stillwater[148.79%], AngloGold Ashanti[143.42%], SSR [143.1%], Gold Fields[133.46%], New Gold[119.35%], Ramaco [117.85%], Kinross Gold[111.46%], Coeur [104.02%] Best Materials Stocks This Week:
Dominion Diamond[33.17%], DRDGOLD [12.42%], i-80 Gold[12.09%], Alamos Gold[9.37%], New Gold[6.67%], Trilogy Metals[5.77%], IAMGOLD [5.75%], McEwen [5.39%], SSR [5.22%], Braskem S.A[5.21%], GrowGeneration [5.13%] Best Materials Stocks Daily:
Dominion Diamond[28.83%], Energy Fuels[10.2%], DRDGOLD [8.49%], 5E Advanced[8.29%], Origin [7.47%], Green Plains[6.96%], Gold Royalty[6.76%], Aceto [6.67%], i-80 Gold[6.31%], GrowGeneration [5.13%], Ramaco [5.05%]