
 Login Sign Up


| |||||
 |  | ||||

| 12Stocks.com Market Intelligence |
Best Healthcare Stocks
 | "Discover best trending healthcare stocks with 12Stocks.com." |
| - Subu Vdaygiri, Founder, 12Stocks.com |
| In a hurry? Healthcare Stocks Lists: Performance Trends Table, Stock Charts
Sort Healthcare stocks: Daily, Weekly, Year-to-Date, Market Cap & Trends. Filter Healthcare stocks list by size:All Healthcare Large Mid-Range Small |
| 12Stocks.com Healthcare Stocks Performances & Trends Daily | |||||||||
|
|  The overall Smart Investing & Trading Score is 100 (0-bearish to 100-bullish) which puts Healthcare sector in short term bullish trend. The Smart Investing & Trading Score from previous trading session is 70 and an improvement of trend continues.
| ||||||||
Here are the Smart Investing & Trading Scores of the most requested Healthcare stocks at 12Stocks.com (click stock name for detailed review):
|


| 12Stocks.com: Investing in Healthcare sector with Stocks | |
|
The following table helps investors and traders sort through current performance and trends (as measured by Smart Investing & Trading Score) of various
stocks in the Healthcare sector. Quick View: Move mouse or cursor over stock symbol (ticker) to view short-term Technical chart and over stock name to view long term chart. Click on  to add stock symbol to your watchlist and to add stock symbol to your watchlist and  to view watchlist. Click on any ticker or stock name for detailed market intelligence report for that stock. to view watchlist. Click on any ticker or stock name for detailed market intelligence report for that stock. |
12Stocks.com Performance of Stocks in Healthcare Sector
| Ticker | Stock Name | Watchlist | Category | Recent Price | Smart Investing & Trading Score | Change % | YTD Change% |
| MRK | Merck & Co |   | Drug Manufacturers - General | 89.51 | 100 | -0.69% | -8.05% |
| DHR | Danaher Corp | | Diagnostics & Research | 210.33 | 100 | -1.20% | -8.19% |
| INMD | Inmode | | Medical Devices | 15.46 | 100 | 1.18% | -8.84% |
| ZTS | Zoetis | | Drug Manufacturers - Specialty & Generic | 146.49 | 80 | -0.31% | -9.03% |
| EVO | Evotec SE | | Drug Manufacturers - Specialty & Generic | 3.88 | 90 | 3.19% | -9.13% |
| ICLR | Icon | | Diagnostics & Research | 192.96 | 100 | 0.34% | -9.25% |
| GLSI | Greenwich LifeSciences | | Biotechnology | 10.65 | 50 | 5.34% | -9.28% |
| KRON | Kronos Bio | | Biotechnology | 0.88 | 40 | 1.49% | -9.29% |
| PHR | Phreesia | | Health Information | 22.84 | 10 | 1.74% | -9.33% |
| NSPR | InspireMD | | Medical Devices | 2.41 | 30 | 0.42% | -9.40% |
| ALC | Alcon | | Instruments | 75.11 | 50 | 0.00% | -9.67% |
| RDY | Dr. Reddy's | | Drug Manufacturers - Specialty & Generic | 14.07 | 50 | -0.92% | -9.76% |
| BIO | Bio-Rad | | Medical Devices | 294.24 | 100 | -1.25% | -9.79% |
| PMVP | PMV | | Biotechnology | 1.38 | 20 | 1.47% | -9.80% |
| ABEO | Abeona | | Biotechnology | 5.32 | 10 | 0.76% | -9.98% |
| BNTX | BioNTech SE | | Biotechnology | 103.44 | 80 | 0.88% | -10.29% |
| EBS | Emergent Bio | | Drug Manufacturers - Specialty & Generic | 9.19 | 100 | 0.00% | -10.52% |
| JYNT | Joint Corp | | Medical Care Facilities | 9.30 | 0 | 0.32% | -10.83% |
| TDOC | Teladoc Health | | Health Information | 8.48 | 80 | 8.72% | -10.92% |
| FOLD | Amicus | | Biotechnology | 8.24 | 60 | 6.94% | -11.44% |
| RCUS | Arcus Biosciences | | Biotechnology | 13.37 | 70 | -0.82% | -11.63% |
| OSUR | Orasure Technologies | | Instruments | 3.12 | 10 | -0.79% | -11.72% |
| DVA | DaVita | | Medical Care Facilities | 132.10 | 60 | -0.58% | -11.83% |
| VCYT | Veracyte | | Diagnostics & Research | 35.65 | 100 | -1.55% | -11.84% |
| NKTX | Nkarta | | Biotechnology | 2.19 | 90 | 2.82% | -12.40% |
| For chart view version of above stock list: Chart View ➞ 0 - 25 , 25 - 50 , 50 - 75 , 75 - 100 , 100 - 125 , 125 - 150 , 150 - 175 , 175 - 200 , 200 - 225 , 225 - 250 , 250 - 275 , 275 - 300 , 300 - 325 , 325 - 350 , 350 - 375 , 375 - 400 , 400 - 425 , 425 - 450 , 450 - 475 , 475 - 500 , 500 - 525 , 525 - 550 , 550 - 575 , 575 - 600 , 600 - 625 , 625 - 650 , 650 - 675 , 675 - 700 , 700 - 725 , 725 - 750 , 750 - 775 , 775 - 800 , 800 - 825 , 825 - 850 , 850 - 875 , 875 - 900 , 900 - 925 , 925 - 950 , 950 - 975 , 975 - 1000 | ||
 | Click To Change The Sort Order: By Market Cap or Company Size Performance: Year-to-date, Week and Day |  |
|
Get the most comprehensive stock market coverage daily at 12Stocks.com ➞ Best Stocks Today ➞ Best Stocks Weekly ➞ Best Stocks Year-to-Date ➞ Best Stocks Trends ➞  Best Stocks Today 12Stocks.com Best Nasdaq Stocks ➞ Best S&P 500 Stocks ➞ Best Tech Stocks ➞ Best Biotech Stocks ➞ |
| Detailed Overview of Healthcare Stocks |
| Healthcare Technical Overview, Leaders & Laggards, Top Healthcare ETF Funds & Detailed Healthcare Stocks List, Charts, Trends & More |
| Healthcare Sector: Technical Analysis, Trends & YTD Performance | |
| Healthcare sector is composed of stocks
from pharmaceutical, biotech, diagnostics labs, insurance providers
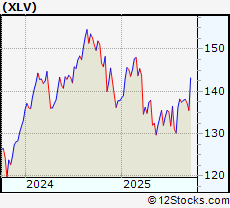
and healthcare services. Healthcare sector, as represented by XLV, an exchange-traded fund [ETF] that holds basket of Healthcare stocks (e.g, Merck, Amgen) is up by 4.95646% and is currently underperforming the overall market by -9.80144% year-to-date. Below is a quick view of Technical charts and trends: |
|
 XLV Weekly Chart |
|
| Long Term Trend: Very Good | |
| Medium Term Trend: Very Good | |
 XLV Daily Chart |
|
| Short Term Trend: Very Good | |
| Overall Trend Score: 100 | |
| YTD Performance: 4.95646% | |
| **Trend Scores & Views Are Only For Educational Purposes And Not For Investing | |
| 12Stocks.com: Top Performing Healthcare Sector Stocks | ||||||||||||||||||||||||||||||||||||||||||||||
 The top performing Healthcare sector stocks year to date are
Now, more recently, over last week, the top performing Healthcare sector stocks on the move are


|
||||||||||||||||||||||||||||||||||||||||||||||
| 12Stocks.com: Investing in Healthcare Sector using Exchange Traded Funds | |
|
The following table shows list of key exchange traded funds (ETF) that
help investors track Healthcare Index. For detailed view, check out our ETF Funds section of our website. Quick View: Move mouse or cursor over ETF symbol (ticker) to view short-term Technical chart and over ETF name to view long term chart. Click on ticker or stock name for detailed view. Click on to add stock symbol to your watchlist and to view watchlist. |
12Stocks.com List of ETFs that track Healthcare Index
| Ticker | ETF Name | Watchlist | Recent Price | Smart Investing & Trading Score | Change % | Week % | Year-to-date % |
| BTEC | Principal Healthcare Innovators | | 39.49 | 30 | 0 | 1.02328 | 0% |
| 12Stocks.com: Charts, Trends, Fundamental Data and Performances of Healthcare Stocks | |
|
We now take in-depth look at all Healthcare stocks including charts, multi-period performances and overall trends (as measured by Smart Investing & Trading Score). One can sort Healthcare stocks (click link to choose) by Daily, Weekly and by Year-to-Date performances. Also, one can sort by size of the company or by market capitalization. |
| Select Your Default Chart Type: | |||||
| |||||
| Click on stock symbol or name for detailed view. Click on to add stock symbol to your watchlist and to view watchlist. Quick View: Move mouse or cursor over "Daily" to quickly view daily Technical stock chart and over "Weekly" to view weekly Technical stock chart. | |||||

 | MRK Merck & Co Inc |
| Sector: Health Care | |
| SubSector: Drug Manufacturers - General | |
| MarketCap: 211587 Millions | |
| Recent Price: 89.51 Smart Investing & Trading Score: 100 | |
| Day Percent Change: -0.687895% Day Change: -1.1 | |
| Week Change: 12.3509% Year-to-date Change: -8.0% | |
| MRK Links: Profile News Message Board | |
| Charts:- Daily , Weekly | |
| Add MRK to Watchlist: View: Get Complete MRK Trend Analysis ➞ | |
 | DHR Danaher Corp |
| Sector: Health Care | |
| SubSector: Diagnostics & Research | |
| MarketCap: 143361 Millions | |
| Recent Price: 210.33 Smart Investing & Trading Score: 100 | |
| Day Percent Change: -1.19786% Day Change: -1.46 | |
| Week Change: 13.1354% Year-to-date Change: -8.2% | |
| DHR Links: Profile News Message Board | |
| Charts:- Daily , Weekly | |
| Add DHR to Watchlist: View: Get Complete DHR Trend Analysis ➞ | |
 | INMD Inmode Ltd |
| Sector: Health Care | |
| SubSector: Medical Devices | |
| MarketCap: 1041.99 Millions | |
| Recent Price: 15.46 Smart Investing & Trading Score: 100 | |
| Day Percent Change: 1.17801% Day Change: 0.02 | |
| Week Change: 3.41137% Year-to-date Change: -8.8% | |
| INMD Links: Profile News Message Board | |
| Charts:- Daily , Weekly | |
| Add INMD to Watchlist: View: Get Complete INMD Trend Analysis ➞ | |
 | ZTS Zoetis Inc |
| Sector: Health Care | |
| SubSector: Drug Manufacturers - Specialty & Generic | |
| MarketCap: 67948.9 Millions | |
| Recent Price: 146.49 Smart Investing & Trading Score: 80 | |
| Day Percent Change: -0.313032% Day Change: 0.68 | |
| Week Change: 3.40227% Year-to-date Change: -9.0% | |
| ZTS Links: Profile News Message Board | |
| Charts:- Daily , Weekly | |
| Add ZTS to Watchlist: View: Get Complete ZTS Trend Analysis ➞ | |
 | EVO Evotec SE ADR |
| Sector: Health Care | |
| SubSector: Drug Manufacturers - Specialty & Generic | |
| MarketCap: 1236.1 Millions | |
| Recent Price: 3.88 Smart Investing & Trading Score: 90 | |
| Day Percent Change: 3.19149% Day Change: -0.03 | |
| Week Change: 5.14905% Year-to-date Change: -9.1% | |
| EVO Links: Profile News Message Board | |
| Charts:- Daily , Weekly | |
| Add EVO to Watchlist: View: Get Complete EVO Trend Analysis ➞ | |
 | ICLR Icon Plc |
| Sector: Health Care | |
| SubSector: Diagnostics & Research | |
| MarketCap: 13600.8 Millions | |
| Recent Price: 192.96 Smart Investing & Trading Score: 100 | |
| Day Percent Change: 0.337996% Day Change: -0.93 | |
| Week Change: 15.2069% Year-to-date Change: -9.3% | |
| ICLR Links: Profile News Message Board | |
| Charts:- Daily , Weekly | |
| Add ICLR to Watchlist: View: Get Complete ICLR Trend Analysis ➞ | |
 | GLSI Greenwich LifeSciences Inc |
| Sector: Health Care | |
| SubSector: Biotechnology | |
| MarketCap: 148.98 Millions | |
| Recent Price: 10.65 Smart Investing & Trading Score: 50 | |
| Day Percent Change: 5.34125% Day Change: -0.09 | |
| Week Change: -2.69529% Year-to-date Change: -9.3% | |
| GLSI Links: Profile News Message Board | |
| Charts:- Daily , Weekly | |
| Add GLSI to Watchlist: View: Get Complete GLSI Trend Analysis ➞ | |
 | KRON Kronos Bio, Inc. |
| Sector: Health Care | |
| SubSector: Biotechnology | |
| MarketCap: 17287 Millions | |
| Recent Price: 0.88 Smart Investing & Trading Score: 40 | |
| Day Percent Change: 1.48772% Day Change: -9999 | |
| Week Change: 0.89429% Year-to-date Change: -9.3% | |
| KRON Links: Profile News Message Board | |
| Charts:- Daily , Weekly | |
| Add KRON to Watchlist: View: Get Complete KRON Trend Analysis ➞ | |
 | PHR Phreesia Inc |
| Sector: Health Care | |
| SubSector: Health Information Services | |
| MarketCap: 1673.86 Millions | |
| Recent Price: 22.84 Smart Investing & Trading Score: 10 | |
| Day Percent Change: 1.73719% Day Change: 1.06 | |
| Week Change: -3.46576% Year-to-date Change: -9.3% | |
| PHR Links: Profile News Message Board | |
| Charts:- Daily , Weekly | |
| Add PHR to Watchlist: View: Get Complete PHR Trend Analysis ➞ | |
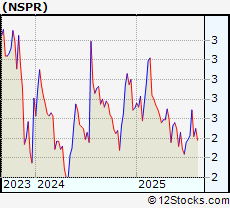 | NSPR InspireMD Inc |
| Sector: Health Care | |
| SubSector: Medical Devices | |
| MarketCap: 100.96 Millions | |
| Recent Price: 2.41 Smart Investing & Trading Score: 30 | |
| Day Percent Change: 0.416667% Day Change: -0.08 | |
| Week Change: -0.413223% Year-to-date Change: -9.4% | |
| NSPR Links: Profile News Message Board | |
| Charts:- Daily , Weekly | |
| Add NSPR to Watchlist: View: Get Complete NSPR Trend Analysis ➞ | |
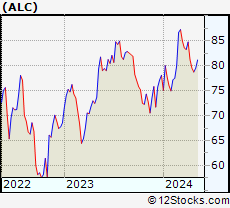 | ALC Alcon Inc |
| Sector: Health Care | |
| SubSector: Medical Instruments & Supplies | |
| MarketCap: 39652.1 Millions | |
| Recent Price: 75.11 Smart Investing & Trading Score: 50 | |
| Day Percent Change: 0% Day Change: 0 | |
| Week Change: 0.146667% Year-to-date Change: -9.7% | |
| ALC Links: Profile News Message Board | |
| Charts:- Daily , Weekly | |
| Add ALC to Watchlist: View: Get Complete ALC Trend Analysis ➞ | |
 | RDY Dr. Reddy's Laboratories Ltd. ADR |
| Sector: Health Care | |
| SubSector: Drug Manufacturers - Specialty & Generic | |
| MarketCap: 11935.6 Millions | |
| Recent Price: 14.07 Smart Investing & Trading Score: 50 | |
| Day Percent Change: -0.915493% Day Change: -0.06 | |
| Week Change: -2.56233% Year-to-date Change: -9.8% | |
| RDY Links: Profile News Message Board | |
| Charts:- Daily , Weekly | |
| Add RDY to Watchlist: View: Get Complete RDY Trend Analysis ➞ | |
 | BIO Bio-Rad Laboratories Inc |
| Sector: Health Care | |
| SubSector: Medical Devices | |
| MarketCap: 7998.24 Millions | |
| Recent Price: 294.24 Smart Investing & Trading Score: 100 | |
| Day Percent Change: -1.24518% Day Change: -2.45 | |
| Week Change: 6.36975% Year-to-date Change: -9.8% | |
| BIO Links: Profile News Message Board | |
| Charts:- Daily , Weekly | |
| Add BIO to Watchlist: View: Get Complete BIO Trend Analysis ➞ | |
 | PMVP PMV Pharmaceuticals Inc |
| Sector: Health Care | |
| SubSector: Biotechnology | |
| MarketCap: 77.37 Millions | |
| Recent Price: 1.38 Smart Investing & Trading Score: 20 | |
| Day Percent Change: 1.47059% Day Change: -0.01 | |
| Week Change: -6.12245% Year-to-date Change: -9.8% | |
| PMVP Links: Profile News Message Board | |
| Charts:- Daily , Weekly | |
| Add PMVP to Watchlist: View: Get Complete PMVP Trend Analysis ➞ | |
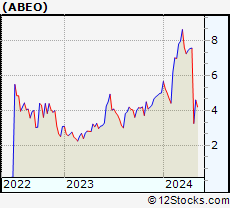 | ABEO Abeona Therapeutics Inc |
| Sector: Health Care | |
| SubSector: Biotechnology | |
| MarketCap: 353.31 Millions | |
| Recent Price: 5.32 Smart Investing & Trading Score: 10 | |
| Day Percent Change: 0.757576% Day Change: 0.11 | |
| Week Change: -4.14414% Year-to-date Change: -10.0% | |
| ABEO Links: Profile News Message Board | |
| Charts:- Daily , Weekly | |
| Add ABEO to Watchlist: View: Get Complete ABEO Trend Analysis ➞ | |
 | BNTX BioNTech SE ADR |
| Sector: Health Care | |
| SubSector: Biotechnology | |
| MarketCap: 27035.4 Millions | |
| Recent Price: 103.44 Smart Investing & Trading Score: 80 | |
| Day Percent Change: 0.877706% Day Change: 0.9 | |
| Week Change: 3.69925% Year-to-date Change: -10.3% | |
| BNTX Links: Profile News Message Board | |
| Charts:- Daily , Weekly | |
| Add BNTX to Watchlist: View: Get Complete BNTX Trend Analysis ➞ | |
 | EBS Emergent Biosolutions Inc |
| Sector: Health Care | |
| SubSector: Drug Manufacturers - Specialty & Generic | |
| MarketCap: 404.4 Millions | |
| Recent Price: 9.19 Smart Investing & Trading Score: 100 | |
| Day Percent Change: 0% Day Change: 0.07 | |
| Week Change: 10.8565% Year-to-date Change: -10.5% | |
| EBS Links: Profile News Message Board | |
| Charts:- Daily , Weekly | |
| Add EBS to Watchlist: View: Get Complete EBS Trend Analysis ➞ | |
 | JYNT Joint Corp |
| Sector: Health Care | |
| SubSector: Medical Care Facilities | |
| MarketCap: 163.25 Millions | |
| Recent Price: 9.30 Smart Investing & Trading Score: 0 | |
| Day Percent Change: 0.323625% Day Change: 0.2 | |
| Week Change: -6.06061% Year-to-date Change: -10.8% | |
| JYNT Links: Profile News Message Board | |
| Charts:- Daily , Weekly | |
| Add JYNT to Watchlist: View: Get Complete JYNT Trend Analysis ➞ | |
 | TDOC Teladoc Health Inc |
| Sector: Health Care | |
| SubSector: Health Information Services | |
| MarketCap: 1381.72 Millions | |
| Recent Price: 8.48 Smart Investing & Trading Score: 80 | |
| Day Percent Change: 8.71795% Day Change: 0.58 | |
| Week Change: 0.952381% Year-to-date Change: -10.9% | |
| TDOC Links: Profile News Message Board | |
| Charts:- Daily , Weekly | |
| Add TDOC to Watchlist: View: Get Complete TDOC Trend Analysis ➞ | |
 | FOLD Amicus Therapeutics Inc |
| Sector: Health Care | |
| SubSector: Biotechnology | |
| MarketCap: 2462.83 Millions | |
| Recent Price: 8.24 Smart Investing & Trading Score: 60 | |
| Day Percent Change: 6.93904% Day Change: 0.2 | |
| Week Change: -1.25749% Year-to-date Change: -11.4% | |
| FOLD Links: Profile News Message Board | |
| Charts:- Daily , Weekly | |
| Add FOLD to Watchlist: View: Get Complete FOLD Trend Analysis ➞ | |
 | RCUS Arcus Biosciences Inc |
| Sector: Health Care | |
| SubSector: Biotechnology | |
| MarketCap: 1297.39 Millions | |
| Recent Price: 13.37 Smart Investing & Trading Score: 70 | |
| Day Percent Change: -0.816024% Day Change: 0.39 | |
| Week Change: 6.8745% Year-to-date Change: -11.6% | |
| RCUS Links: Profile News Message Board | |
| Charts:- Daily , Weekly | |
| Add RCUS to Watchlist: View: Get Complete RCUS Trend Analysis ➞ | |
 | OSUR Orasure Technologies Inc |
| Sector: Health Care | |
| SubSector: Medical Instruments & Supplies | |
| MarketCap: 236.23 Millions | |
| Recent Price: 3.12 Smart Investing & Trading Score: 10 | |
| Day Percent Change: -0.793651% Day Change: -0.04 | |
| Week Change: -3.25077% Year-to-date Change: -11.7% | |
| OSUR Links: Profile News Message Board | |
| Charts:- Daily , Weekly | |
| Add OSUR to Watchlist: View: Get Complete OSUR Trend Analysis ➞ | |
 | DVA DaVita Inc |
| Sector: Health Care | |
| SubSector: Medical Care Facilities | |
| MarketCap: 9857.7 Millions | |
| Recent Price: 132.10 Smart Investing & Trading Score: 60 | |
| Day Percent Change: -0.579514% Day Change: -0.38 | |
| Week Change: -1.13755% Year-to-date Change: -11.8% | |
| DVA Links: Profile News Message Board | |
| Charts:- Daily , Weekly | |
| Add DVA to Watchlist: View: Get Complete DVA Trend Analysis ➞ | |
 | VCYT Veracyte Inc |
| Sector: Health Care | |
| SubSector: Diagnostics & Research | |
| MarketCap: 2551.32 Millions | |
| Recent Price: 35.65 Smart Investing & Trading Score: 100 | |
| Day Percent Change: -1.54653% Day Change: -0.06 | |
| Week Change: 9.08813% Year-to-date Change: -11.8% | |
| VCYT Links: Profile News Message Board | |
| Charts:- Daily , Weekly | |
| Add VCYT to Watchlist: View: Get Complete VCYT Trend Analysis ➞ | |
 | NKTX Nkarta Inc |
| Sector: Health Care | |
| SubSector: Biotechnology | |
| MarketCap: 160.52 Millions | |
| Recent Price: 2.19 Smart Investing & Trading Score: 90 | |
| Day Percent Change: 2.8169% Day Change: 0.06 | |
| Week Change: 6.31068% Year-to-date Change: -12.4% | |
| NKTX Links: Profile News Message Board | |
| Charts:- Daily , Weekly | |
| Add NKTX to Watchlist: View: Get Complete NKTX Trend Analysis ➞ | |
| For tabular summary view of above stock list: Summary View ➞ 0 - 25 , 25 - 50 , 50 - 75 , 75 - 100 , 100 - 125 , 125 - 150 , 150 - 175 , 175 - 200 , 200 - 225 , 225 - 250 , 250 - 275 , 275 - 300 , 300 - 325 , 325 - 350 , 350 - 375 , 375 - 400 , 400 - 425 , 425 - 450 , 450 - 475 , 475 - 500 , 500 - 525 , 525 - 550 , 550 - 575 , 575 - 600 , 600 - 625 , 625 - 650 , 650 - 675 , 675 - 700 , 700 - 725 , 725 - 750 , 750 - 775 , 775 - 800 , 800 - 825 , 825 - 850 , 850 - 875 , 875 - 900 , 900 - 925 , 925 - 950 , 950 - 975 , 975 - 1000 | ||
| Click To Change The Sort Order: By Market Cap or Company Size Performance: Year-to-date, Week and Day | |
| Select Chart Type: | ||
|
Best Stocks Today 12Stocks.com |
© 2025 12Stocks.com Terms & Conditions Privacy Contact Us
All Information Provided Only For Education And Not To Be Used For Investing or Trading. See Terms & Conditions


One More Thing ... Get Best Stocks Delivered Daily!
Never Ever Miss A Move With Our Top Ten Stocks Lists
Find Best Stocks In Any Market - Bull or Bear Market
Take A Peek At Our Top Ten Stocks Lists: Daily, Weekly, Year-to-Date & Top Trends
Find Best Stocks In Any Market - Bull or Bear Market
Take A Peek At Our Top Ten Stocks Lists: Daily, Weekly, Year-to-Date & Top Trends
Healthcare Stocks With Best Up Trends [0-bearish to 100-bullish]: Taysha Gene[100], DBV Technologies[100], Valneva SE[100], ClearPoint Neuro[100], Prime Medicine[100], AlloVir [100], Sarepta [100], Monopar [100], Cara [100], Absci Corp[100], Spruce Biosciences[100]
Best Healthcare Stocks Year-to-Date:
Regencell Bioscience[12636.6%], Kaleido BioSciences[9900%], Vor Biopharma[3175%], Nanobiotix ADR[581.379%], Eagle [542.857%], So-Young [395.711%], I-Mab ADR[357.506%], Monopar [337.489%], Nektar [319.84%], 908 Devices[299.543%], DBV Technologies[276.923%] Best Healthcare Stocks This Week:
Athersys [193287%], Nobilis Health[101349%], VBI Vaccines[86898.5%], ContraFect [47677.8%], Clovis Oncology[39610.5%], Endo [28369.6%], NanoString Technologies[17224.7%], Neptune Wellness[14100%], ViewRay [11470.2%], Mallkrodt [11382.1%], Achillion [10033.3%] Best Healthcare Stocks Daily:
Kaleido BioSciences[9900%], Neoleukin [332.665%], Syros [226.23%], Athenex [103.333%], Taysha Gene[53.4591%], DBV Technologies[21.6485%], Valneva SE[20.197%], ClearPoint Neuro[19.7991%], Prime Medicine[19.4097%], Accelerate Diagnostics[17.6471%], Aptose Biosciences[17.5439%]