
 Login Sign Up


| |||||
 |  | ||||

| 12Stocks.com Market Intelligence |
Best Healthcare Stocks
 | "Discover best trending healthcare stocks with 12Stocks.com." |
| - Subu Vdaygiri, Founder, 12Stocks.com |
| In a hurry? Healthcare Stocks Lists: Performance Trends Table, Stock Charts
Sort Healthcare stocks: Daily, Weekly, Year-to-Date, Market Cap & Trends. Filter Healthcare stocks list by size:All Healthcare Large Mid-Range Small |
| 12Stocks.com Healthcare Stocks Performances & Trends Daily | |||||||||
|
|  The overall Smart Investing & Trading Score is 100 (0-bearish to 100-bullish) which puts Healthcare sector in short term bullish trend. The Smart Investing & Trading Score from previous trading session is 70 and an improvement of trend continues.
| ||||||||
Here are the Smart Investing & Trading Scores of the most requested Healthcare stocks at 12Stocks.com (click stock name for detailed review):
|


| 12Stocks.com: Investing in Healthcare sector with Stocks | |
|
The following table helps investors and traders sort through current performance and trends (as measured by Smart Investing & Trading Score) of various
stocks in the Healthcare sector. Quick View: Move mouse or cursor over stock symbol (ticker) to view short-term Technical chart and over stock name to view long term chart. Click on  to add stock symbol to your watchlist and to add stock symbol to your watchlist and  to view watchlist. Click on any ticker or stock name for detailed market intelligence report for that stock. to view watchlist. Click on any ticker or stock name for detailed market intelligence report for that stock. |
12Stocks.com Performance of Stocks in Healthcare Sector
| Ticker | Stock Name | Watchlist | Category | Recent Price | Smart Investing & Trading Score | Change % | YTD Change% |
| CCXI | ChemoCentryx |   | Biotechnology | 37.78 | 30 | 2.58% | 0.00% |
| CERE | Cerevel | | Biotechnology | 44.96 | 50 | 0.00% | 0.00% |
| SGYP | Synergy | | Pharmaceutical | 26.31 | 20 | 2.02% | 0.00% |
| ICPT | Intercept | | Biotechnology | 21.31 | 70 | -0.33% | 0.00% |
| HZNP | Horizon | | Pharmaceutical | 84.44 | 30 | 1.22% | 0.00% |
| CEMI | Chembio Diagnostics | | Diagnostic | 53.90 | 80 | -2.25% | 0.00% |
| ZLTQ | ZELTIQ Aesthetics | | Equipment | 105.86 | 20 | -0.64% | 0.00% |
| OSH | Oak Street | | Medical Care Facilities | 39.00 | 30 | 0.00% | 0.00% |
| HIIQ | Health Insurance | | Insurance | 14.46 | 20 | 0.35% | 0.00% |
| MNK | Mallkrodt | | Pharmaceutical | 45.94 | 80 | -0.20% | 0.00% |
| SCAI | Surgical Care | | Home Care | 5.03 | 30 | 5.01% | 0.00% |
| XON | Intrexon | | Biotechnology | 73.48 | 10 | 0.52% | 0.00% |
| XLRN | Acceleron Pharma | | Biotechnology | 5.52 | 30 | 1.47% | 0.00% |
| PTLA | Portola | | Biotechnology | 172.95 | 100 | 0.65% | 0.00% |
| OPHT | Ophthotech | | Biotechnology | 4.76 | 10 | -1.04% | 0.00% |
| INSY | INSYS | | Biotechnology | 43.26 | 70 | 1.24% | 0.00% |
| EPZM | Epizyme | | Biotechnology | 85.84 | 100 | 1.63% | 0.00% |
| STML | Stemline | | Biotechnology | 23.88 | 50 | -0.04% | 0.00% |
| AERI | Aerie | | Pharmaceutical | 8.21 | 10 | 0.61% | 0.00% |
| OMED | OncoMed | | Biotechnology | 42.50 | 80 | 0.73% | 0.00% |
| PETX | Aratana | | Biotechnology | 16.30 | 60 | 7.38% | 0.00% |
| OXFD | Oxford Immunotec | | Diagnostic | 11.13 | 20 | 0.54% | 0.00% |
| FCSC | Fibrocell Science | | Pharmaceutical | 42.14 | 70 | 4.33% | 0.00% |
| FPRX | Five Prime | | Biotechnology | 73.96 | 50 | 4.57% | 0.00% |
| OVAS | OvaScience | | Biotechnology | 0.69 | 0 | 0.00% | 0.00% |
| For chart view version of above stock list: Chart View ➞ 0 - 25 , 25 - 50 , 50 - 75 , 75 - 100 , 100 - 125 , 125 - 150 , 150 - 175 , 175 - 200 , 200 - 225 , 225 - 250 , 250 - 275 , 275 - 300 , 300 - 325 , 325 - 350 , 350 - 375 , 375 - 400 , 400 - 425 , 425 - 450 , 450 - 475 , 475 - 500 , 500 - 525 , 525 - 550 , 550 - 575 , 575 - 600 , 600 - 625 , 625 - 650 , 650 - 675 , 675 - 700 , 700 - 725 , 725 - 750 , 750 - 775 , 775 - 800 , 800 - 825 , 825 - 850 , 850 - 875 , 875 - 900 , 900 - 925 , 925 - 950 , 950 - 975 , 975 - 1000 | ||
 | Click To Change The Sort Order: By Market Cap or Company Size Performance: Year-to-date, Week and Day |  |
|
Get the most comprehensive stock market coverage daily at 12Stocks.com ➞ Best Stocks Today ➞ Best Stocks Weekly ➞ Best Stocks Year-to-Date ➞ Best Stocks Trends ➞  Best Stocks Today 12Stocks.com Best Nasdaq Stocks ➞ Best S&P 500 Stocks ➞ Best Tech Stocks ➞ Best Biotech Stocks ➞ |
| Detailed Overview of Healthcare Stocks |
| Healthcare Technical Overview, Leaders & Laggards, Top Healthcare ETF Funds & Detailed Healthcare Stocks List, Charts, Trends & More |
| Healthcare Sector: Technical Analysis, Trends & YTD Performance | |
| Healthcare sector is composed of stocks
from pharmaceutical, biotech, diagnostics labs, insurance providers
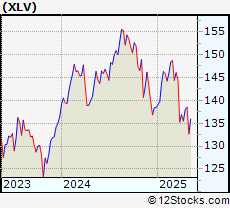
and healthcare services. Healthcare sector, as represented by XLV, an exchange-traded fund [ETF] that holds basket of Healthcare stocks (e.g, Merck, Amgen) is up by 4.95646% and is currently underperforming the overall market by -9.80144% year-to-date. Below is a quick view of Technical charts and trends: |
|
 XLV Weekly Chart |
|
| Long Term Trend: Very Good | |
| Medium Term Trend: Very Good | |
 XLV Daily Chart |
|
| Short Term Trend: Very Good | |
| Overall Trend Score: 100 | |
| YTD Performance: 4.95646% | |
| **Trend Scores & Views Are Only For Educational Purposes And Not For Investing | |
| 12Stocks.com: Top Performing Healthcare Sector Stocks | ||||||||||||||||||||||||||||||||||||||||||||||
 The top performing Healthcare sector stocks year to date are
Now, more recently, over last week, the top performing Healthcare sector stocks on the move are


|
||||||||||||||||||||||||||||||||||||||||||||||
| 12Stocks.com: Investing in Healthcare Sector using Exchange Traded Funds | |
|
The following table shows list of key exchange traded funds (ETF) that
help investors track Healthcare Index. For detailed view, check out our ETF Funds section of our website. Quick View: Move mouse or cursor over ETF symbol (ticker) to view short-term Technical chart and over ETF name to view long term chart. Click on ticker or stock name for detailed view. Click on to add stock symbol to your watchlist and to view watchlist. |
12Stocks.com List of ETFs that track Healthcare Index
| Ticker | ETF Name | Watchlist | Recent Price | Smart Investing & Trading Score | Change % | Week % | Year-to-date % |
| BTEC | Principal Healthcare Innovators | | 39.49 | 30 | 0 | 1.02328 | 0% |
| 12Stocks.com: Charts, Trends, Fundamental Data and Performances of Healthcare Stocks | |
|
We now take in-depth look at all Healthcare stocks including charts, multi-period performances and overall trends (as measured by Smart Investing & Trading Score). One can sort Healthcare stocks (click link to choose) by Daily, Weekly and by Year-to-Date performances. Also, one can sort by size of the company or by market capitalization. |
| Select Your Default Chart Type: | |||||
| |||||
| Click on stock symbol or name for detailed view. Click on to add stock symbol to your watchlist and to view watchlist. Quick View: Move mouse or cursor over "Daily" to quickly view daily Technical stock chart and over "Weekly" to view weekly Technical stock chart. | |||||

 | CCXI ChemoCentryx, Inc. |
| Sector: Health Care | |
| SubSector: Biotechnology | |
| MarketCap: 2412.75 Millions | |
| Recent Price: 37.78 Smart Investing & Trading Score: 30 | |
| Day Percent Change: 2.57942% Day Change: -9999 | |
| Week Change: -27.3322% Year-to-date Change: 0.0% | |
| CCXI Links: Profile News Message Board | |
| Charts:- Daily , Weekly | |
| Add CCXI to Watchlist: View: Get Complete CCXI Trend Analysis ➞ | |
 | CERE Cerevel Therapeutics Holdings, Inc. |
| Sector: Health Care | |
| SubSector: Biotechnology | |
| MarketCap: 21587 Millions | |
| Recent Price: 44.96 Smart Investing & Trading Score: 50 | |
| Day Percent Change: 0% Day Change: -9999 | |
| Week Change: 3.66613% Year-to-date Change: 0.0% | |
| CERE Links: Profile News Message Board | |
| Charts:- Daily , Weekly | |
| Add CERE to Watchlist: View: Get Complete CERE Trend Analysis ➞ | |
 | SGYP Synergy Pharmaceuticals Inc. |
| Sector: Health Care | |
| SubSector: Drug Manufacturers - Other | |
| MarketCap: 1191.54 Millions | |
| Recent Price: 26.31 Smart Investing & Trading Score: 20 | |
| Day Percent Change: 2.01629% Day Change: -9999 | |
| Week Change: -21.4158% Year-to-date Change: 0.0% | |
| SGYP Links: Profile News Message Board | |
| Charts:- Daily , Weekly | |
| Add SGYP to Watchlist: View: Get Complete SGYP Trend Analysis ➞ | |
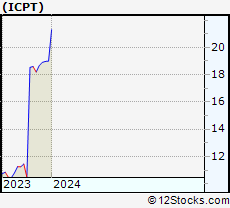 | ICPT Intercept Pharmaceuticals, Inc. |
| Sector: Health Care | |
| SubSector: Biotechnology | |
| MarketCap: 2035.35 Millions | |
| Recent Price: 21.31 Smart Investing & Trading Score: 70 | |
| Day Percent Change: -0.327409% Day Change: -9999 | |
| Week Change: 12.1579% Year-to-date Change: 0.0% | |
| ICPT Links: Profile News Message Board | |
| Charts:- Daily , Weekly | |
| Add ICPT to Watchlist: View: Get Complete ICPT Trend Analysis ➞ | |
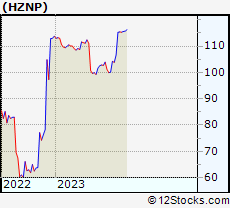 | HZNP Horizon Therapeutics Public Limited Company |
| Sector: Health Care | |
| SubSector: Drugs - Generic | |
| MarketCap: 5379.15 Millions | |
| Recent Price: 84.44 Smart Investing & Trading Score: 30 | |
| Day Percent Change: 1.22273% Day Change: -9999 | |
| Week Change: -27.3947% Year-to-date Change: 0.0% | |
| HZNP Links: Profile News Message Board | |
| Charts:- Daily , Weekly | |
| Add HZNP to Watchlist: View: Get Complete HZNP Trend Analysis ➞ | |
 | CEMI Chembio Diagnostics, Inc. |
| Sector: Health Care | |
| SubSector: Diagnostic Substances | |
| MarketCap: 70.6671 Millions | |
| Recent Price: 53.90 Smart Investing & Trading Score: 80 | |
| Day Percent Change: -2.24882% Day Change: -9999 | |
| Week Change: 11746.2% Year-to-date Change: 0.0% | |
| CEMI Links: Profile News Message Board | |
| Charts:- Daily , Weekly | |
| Add CEMI to Watchlist: View: Get Complete CEMI Trend Analysis ➞ | |
 | ZLTQ ZELTIQ Aesthetics, Inc. |
| Sector: Health Care | |
| SubSector: Medical Appliances & Equipment | |
| MarketCap: 2239.97 Millions | |
| Recent Price: 105.86 Smart Investing & Trading Score: 20 | |
| Day Percent Change: -0.638258% Day Change: -9999 | |
| Week Change: -6.78876% Year-to-date Change: 0.0% | |
| ZLTQ Links: Profile News Message Board | |
| Charts:- Daily , Weekly | |
| Add ZLTQ to Watchlist: View: Get Complete ZLTQ Trend Analysis ➞ | |
 | OSH Oak Street Health, Inc. |
| Sector: Health Care | |
| SubSector: Medical Care Facilities | |
| MarketCap: 13467 Millions | |
| Recent Price: 39.00 Smart Investing & Trading Score: 30 | |
| Day Percent Change: 0% Day Change: -9999 | |
| Week Change: 0% Year-to-date Change: 0.0% | |
| OSH Links: Profile News Message Board | |
| Charts:- Daily , Weekly | |
| Add OSH to Watchlist: View: Get Complete OSH Trend Analysis ➞ | |
 | HIIQ Health Insurance Innovations, Inc. |
| Sector: Health Care | |
| SubSector: Health Care Plans | |
| MarketCap: 264.71 Millions | |
| Recent Price: 14.46 Smart Investing & Trading Score: 20 | |
| Day Percent Change: 0.346981% Day Change: -9999 | |
| Week Change: -79.2361% Year-to-date Change: 0.0% | |
| HIIQ Links: Profile News Message Board | |
| Charts:- Daily , Weekly | |
| Add HIIQ to Watchlist: View: Get Complete HIIQ Trend Analysis ➞ | |
 | MNK Mallinckrodt plc |
| Sector: Health Care | |
| SubSector: Drugs - Generic | |
| MarketCap: 133.085 Millions | |
| Recent Price: 45.94 Smart Investing & Trading Score: 80 | |
| Day Percent Change: -0.195525% Day Change: -9999 | |
| Week Change: 11382.1% Year-to-date Change: 0.0% | |
| MNK Links: Profile News Message Board | |
| Charts:- Daily , Weekly | |
| Add MNK to Watchlist: View: Get Complete MNK Trend Analysis ➞ | |
 | SCAI Surgical Care Affiliates, Inc. |
| Sector: Health Care | |
| SubSector: Home Health Care | |
| MarketCap: 2300.27 Millions | |
| Recent Price: 5.03 Smart Investing & Trading Score: 30 | |
| Day Percent Change: 5.01044% Day Change: -9999 | |
| Week Change: -79.4021% Year-to-date Change: 0.0% | |
| SCAI Links: Profile News Message Board | |
| Charts:- Daily , Weekly | |
| Add SCAI to Watchlist: View: Get Complete SCAI Trend Analysis ➞ | |
 | XON Intrexon Corporation |
| Sector: Health Care | |
| SubSector: Biotechnology | |
| MarketCap: 2509.15 Millions | |
| Recent Price: 73.48 Smart Investing & Trading Score: 10 | |
| Day Percent Change: 0.519836% Day Change: -9999 | |
| Week Change: -57.9465% Year-to-date Change: 0.0% | |
| XON Links: Profile News Message Board | |
| Charts:- Daily , Weekly | |
| Add XON to Watchlist: View: Get Complete XON Trend Analysis ➞ | |
 | XLRN Acceleron Pharma Inc. |
| Sector: Health Care | |
| SubSector: Biotechnology | |
| MarketCap: 4338.75 Millions | |
| Recent Price: 5.52 Smart Investing & Trading Score: 30 | |
| Day Percent Change: 1.47059% Day Change: -9999 | |
| Week Change: -96.9119% Year-to-date Change: 0.0% | |
| XLRN Links: Profile News Message Board | |
| Charts:- Daily , Weekly | |
| Add XLRN to Watchlist: View: Get Complete XLRN Trend Analysis ➞ | |
 | PTLA Portola Pharmaceuticals, Inc. |
| Sector: Health Care | |
| SubSector: Biotechnology | |
| MarketCap: 660.185 Millions | |
| Recent Price: 172.95 Smart Investing & Trading Score: 100 | |
| Day Percent Change: 0.651807% Day Change: -9999 | |
| Week Change: 4717.55% Year-to-date Change: 0.0% | |
| PTLA Links: Profile News Message Board | |
| Charts:- Daily , Weekly | |
| Add PTLA to Watchlist: View: Get Complete PTLA Trend Analysis ➞ | |
 | OPHT Ophthotech Corporation |
| Sector: Health Care | |
| SubSector: Biotechnology | |
| MarketCap: 124.59 Millions | |
| Recent Price: 4.76 Smart Investing & Trading Score: 10 | |
| Day Percent Change: -1.0395% Day Change: -9999 | |
| Week Change: -76.5863% Year-to-date Change: 0.0% | |
| OPHT Links: Profile News Message Board | |
| Charts:- Daily , Weekly | |
| Add OPHT to Watchlist: View: Get Complete OPHT Trend Analysis ➞ | |
 | INSY INSYS Therapeutics, Inc. |
| Sector: Health Care | |
| SubSector: Biotechnology | |
| MarketCap: 743.56 Millions | |
| Recent Price: 43.26 Smart Investing & Trading Score: 70 | |
| Day Percent Change: 1.24035% Day Change: -9999 | |
| Week Change: 186.68% Year-to-date Change: 0.0% | |
| INSY Links: Profile News Message Board | |
| Charts:- Daily , Weekly | |
| Add INSY to Watchlist: View: Get Complete INSY Trend Analysis ➞ | |
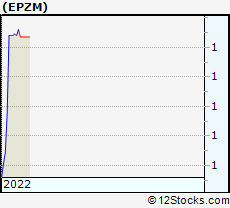 | EPZM Epizyme, Inc. |
| Sector: Health Care | |
| SubSector: Biotechnology | |
| MarketCap: 1739.35 Millions | |
| Recent Price: 85.84 Smart Investing & Trading Score: 100 | |
| Day Percent Change: 1.63391% Day Change: -9999 | |
| Week Change: 5739.46% Year-to-date Change: 0.0% | |
| EPZM Links: Profile News Message Board | |
| Charts:- Daily , Weekly | |
| Add EPZM to Watchlist: View: Get Complete EPZM Trend Analysis ➞ | |
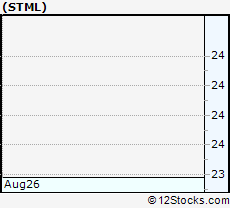 | STML Stemline Therapeutics, Inc. |
| Sector: Health Care | |
| SubSector: Biotechnology | |
| MarketCap: 235.685 Millions | |
| Recent Price: 23.88 Smart Investing & Trading Score: 50 | |
| Day Percent Change: -0.0418585% Day Change: -9999 | |
| Week Change: 121.933% Year-to-date Change: 0.0% | |
| STML Links: Profile News Message Board | |
| Charts:- Daily , Weekly | |
| Add STML to Watchlist: View: Get Complete STML Trend Analysis ➞ | |
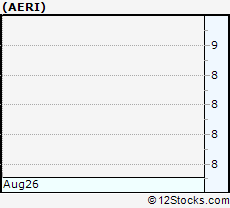 | AERI Aerie Pharmaceuticals, Inc. |
| Sector: Health Care | |
| SubSector: Drug Manufacturers - Major | |
| MarketCap: 596.343 Millions | |
| Recent Price: 8.21 Smart Investing & Trading Score: 10 | |
| Day Percent Change: 0.612745% Day Change: -9999 | |
| Week Change: -46.1639% Year-to-date Change: 0.0% | |
| AERI Links: Profile News Message Board | |
| Charts:- Daily , Weekly | |
| Add AERI to Watchlist: View: Get Complete AERI Trend Analysis ➞ | |
 | OMED OncoMed Pharmaceuticals, Inc. |
| Sector: Health Care | |
| SubSector: Biotechnology | |
| MarketCap: 374.81 Millions | |
| Recent Price: 42.50 Smart Investing & Trading Score: 80 | |
| Day Percent Change: 0.734771% Day Change: -9999 | |
| Week Change: 36.5243% Year-to-date Change: 0.0% | |
| OMED Links: Profile News Message Board | |
| Charts:- Daily , Weekly | |
| Add OMED to Watchlist: View: Get Complete OMED Trend Analysis ➞ | |
 | PETX Aratana Therapeutics, Inc. |
| Sector: Health Care | |
| SubSector: Biotechnology | |
| MarketCap: 199.25 Millions | |
| Recent Price: 16.30 Smart Investing & Trading Score: 60 | |
| Day Percent Change: 7.37813% Day Change: -9999 | |
| Week Change: 579.167% Year-to-date Change: 0.0% | |
| PETX Links: Profile News Message Board | |
| Charts:- Daily , Weekly | |
| Add PETX to Watchlist: View: Get Complete PETX Trend Analysis ➞ | |
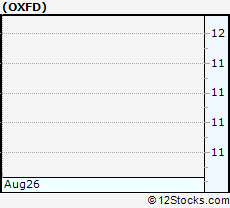 | OXFD Oxford Immunotec Global PLC |
| Sector: Health Care | |
| SubSector: Diagnostic Substances | |
| MarketCap: 283.671 Millions | |
| Recent Price: 11.13 Smart Investing & Trading Score: 20 | |
| Day Percent Change: 0.542005% Day Change: -9999 | |
| Week Change: -27.4919% Year-to-date Change: 0.0% | |
| OXFD Links: Profile News Message Board | |
| Charts:- Daily , Weekly | |
| Add OXFD to Watchlist: View: Get Complete OXFD Trend Analysis ➞ | |
 | FCSC Fibrocell Science, Inc. |
| Sector: Health Care | |
| SubSector: Drugs - Generic | |
| MarketCap: 96.72 Millions | |
| Recent Price: 42.14 Smart Investing & Trading Score: 70 | |
| Day Percent Change: 4.33276% Day Change: -9999 | |
| Week Change: 1169.28% Year-to-date Change: 0.0% | |
| FCSC Links: Profile News Message Board | |
| Charts:- Daily , Weekly | |
| Add FCSC to Watchlist: View: Get Complete FCSC Trend Analysis ➞ | |
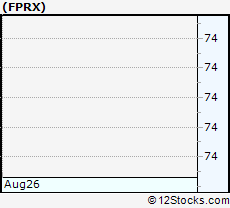 | FPRX Five Prime Therapeutics, Inc. |
| Sector: Health Care | |
| SubSector: Biotechnology | |
| MarketCap: 98.4785 Millions | |
| Recent Price: 73.96 Smart Investing & Trading Score: 50 | |
| Day Percent Change: 4.56666% Day Change: -9999 | |
| Week Change: -46.58% Year-to-date Change: 0.0% | |
| FPRX Links: Profile News Message Board | |
| Charts:- Daily , Weekly | |
| Add FPRX to Watchlist: View: Get Complete FPRX Trend Analysis ➞ | |
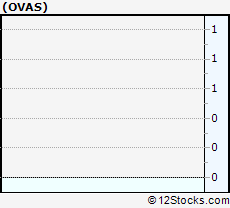 | OVAS OvaScience, Inc. |
| Sector: Health Care | |
| SubSector: Biotechnology | |
| MarketCap: 53.03 Millions | |
| Recent Price: 0.69 Smart Investing & Trading Score: 0 | |
| Day Percent Change: 0% Day Change: -9999 | |
| Week Change: 0% Year-to-date Change: 0.0% | |
| OVAS Links: Profile News Message Board | |
| Charts:- Daily , Weekly | |
| Add OVAS to Watchlist: View: Get Complete OVAS Trend Analysis ➞ | |
| For tabular summary view of above stock list: Summary View ➞ 0 - 25 , 25 - 50 , 50 - 75 , 75 - 100 , 100 - 125 , 125 - 150 , 150 - 175 , 175 - 200 , 200 - 225 , 225 - 250 , 250 - 275 , 275 - 300 , 300 - 325 , 325 - 350 , 350 - 375 , 375 - 400 , 400 - 425 , 425 - 450 , 450 - 475 , 475 - 500 , 500 - 525 , 525 - 550 , 550 - 575 , 575 - 600 , 600 - 625 , 625 - 650 , 650 - 675 , 675 - 700 , 700 - 725 , 725 - 750 , 750 - 775 , 775 - 800 , 800 - 825 , 825 - 850 , 850 - 875 , 875 - 900 , 900 - 925 , 925 - 950 , 950 - 975 , 975 - 1000 | ||
| Click To Change The Sort Order: By Market Cap or Company Size Performance: Year-to-date, Week and Day | |
| Select Chart Type: | ||
|
Best Stocks Today 12Stocks.com |
© 2025 12Stocks.com Terms & Conditions Privacy Contact Us
All Information Provided Only For Education And Not To Be Used For Investing or Trading. See Terms & Conditions


One More Thing ... Get Best Stocks Delivered Daily!
Never Ever Miss A Move With Our Top Ten Stocks Lists
Find Best Stocks In Any Market - Bull or Bear Market
Take A Peek At Our Top Ten Stocks Lists: Daily, Weekly, Year-to-Date & Top Trends
Find Best Stocks In Any Market - Bull or Bear Market
Take A Peek At Our Top Ten Stocks Lists: Daily, Weekly, Year-to-Date & Top Trends
Healthcare Stocks With Best Up Trends [0-bearish to 100-bullish]: Taysha Gene[100], DBV Technologies[100], Valneva SE[100], ClearPoint Neuro[100], Prime Medicine[100], AlloVir [100], Sarepta [100], Monopar [100], Cara [100], Absci Corp[100], Spruce Biosciences[100]
Best Healthcare Stocks Year-to-Date:
Regencell Bioscience[12636.6%], Kaleido BioSciences[9900%], Vor Biopharma[3175%], Nanobiotix ADR[581.379%], Eagle [542.857%], So-Young [395.711%], I-Mab ADR[357.506%], Monopar [337.489%], Nektar [319.84%], 908 Devices[299.543%], DBV Technologies[276.923%] Best Healthcare Stocks This Week:
Athersys [193287%], Nobilis Health[101349%], VBI Vaccines[86898.5%], ContraFect [47677.8%], Clovis Oncology[39610.5%], Endo [28369.6%], NanoString Technologies[17224.7%], Neptune Wellness[14100%], ViewRay [11470.2%], Mallkrodt [11382.1%], Achillion [10033.3%] Best Healthcare Stocks Daily:
Kaleido BioSciences[9900%], Neoleukin [332.665%], Syros [226.23%], Athenex [103.333%], Taysha Gene[53.4591%], DBV Technologies[21.6485%], Valneva SE[20.197%], ClearPoint Neuro[19.7991%], Prime Medicine[19.4097%], Accelerate Diagnostics[17.6471%], Aptose Biosciences[17.5439%]