
 Login Sign Up


| |||||
 |  | ||||

| 12Stocks.com Market Intelligence |
Best Financial Stocks
| In a hurry? Financial Stocks Lists: Performance Trends Table, Stock Charts
Sort Financial stocks: Daily, Weekly, Year-to-Date, Market Cap & Trends. Filter Financial stocks list by size:All Financial Large Mid-Range Small & MicroCap |
| 12Stocks.com Financial Stocks Performances & Trends Daily | |||||||||
|
|  The overall Smart Investing & Trading Score is 33 (0-bearish to 100-bullish) which puts Financial sector in short term bearish to neutral trend. The Smart Investing & Trading Score from previous trading session is 26 and hence an improvement of trend.
| ||||||||
Here are the Smart Investing & Trading Scores of the most requested Financial stocks at 12Stocks.com (click stock name for detailed review):
|


| 12Stocks.com: Investing in Financial sector with Stocks | |
|
The following table helps investors and traders sort through current performance and trends (as measured by Smart Investing & Trading Score) of various
stocks in the Financial sector. Quick View: Move mouse or cursor over stock symbol (ticker) to view short-term Technical chart and over stock name to view long term chart. Click on  to add stock symbol to your watchlist and to add stock symbol to your watchlist and  to view watchlist. Click on any ticker or stock name for detailed market intelligence report for that stock. to view watchlist. Click on any ticker or stock name for detailed market intelligence report for that stock. |
12Stocks.com Performance of Stocks in Financial Sector
| Ticker | Stock Name | Watchlist | Category | Recent Price | Trend Score | Change % | YTD Change% |
| MKL | Markel |   | Insurance | 1946.42 | 13 | 0.86% | 12.76% |
| ACGL | Arch Capital | | Insurance | 88.51 | 60 | 0.58% | -4.16% |
| VEL | Velocity | | Mortgage Finance | 16.64 | 23 | 1.77% | -14.93% |
| RYAN | Ryan Specialty | | Insurance - Specialty | 57.82 | 0 | -0.05% | -9.73% |
| MAA | Mid-America Apartment | | REIT | 140.10 | 0 | 0.07% | -7.56% |
| SUI | Sun Communities | | REIT | 125.84 | 88 | 1.24% | 3.08% |
| EXR | Extra Space | | REIT - Industrial | 138.06 | 0 | -0.89% | -6.67% |
| VTR | Ventas | | REIT | 68.28 | 90 | 1.16% | 16.76% |
| L | Loews | | Insurance | 92.82 | 83 | 2.80% | 9.68% |
| BRO | Brown & Brown | | Insurance | 92.70 | 25 | 0.50% | -9.01% |
| FITB | Fifth Third | | Regional Banks | 41.43 | 53 | 1.27% | -1.07% |
| UDR | UDR | | REIT | 37.97 | 0 | -1.81% | -10.66% |
| KEY | KeyCorp | | Regional Banks | 17.83 | 53 | 1.02% | 5.30% |
| WRB | W. R. | | Insurance | 70.48 | 69 | 1.78% | 20.59% |
| INVH | Invitation Homes | | Real Estatet | 30.19 | 0 | -0.49% | -4.76% |
| ELS | Equity LifeStyle | | REIT | 61.43 | 59 | 1.94% | -7.03% |
| WPC | W. P. | | REIT - | 66.08 | 100 | 1.69% | 23.04% |
| RJF | Raymond James | | Brokerage | 166.48 | 70 | 2.12% | 7.91% |
| BEN | Franklin Resources | | Asset Mgmt | 25.13 | 90 | 4.93% | 25.94% |
| SYF | Synchrony | | Credit Services | 69.25 | 53 | 2.55% | 6.93% |
| NLY | Annaly Capital | | Mortgage | 20.91 | 100 | 1.95% | 18.27% |
| CNA | CNA | | Insurance | 45.66 | 64 | 4.03% | -4.71% |
| RF | Regions | | Regional Banks | 25.18 | 43 | 1.17% | 8.20% |
| CBOE | Cboe Global | | Investments | 250.87 | 100 | 1.24% | 28.78% |
| ERIE | Erie Indemnity | | Insurance | 356.21 | 80 | 1.56% | -13.00% |
| For chart view version of above stock list: Chart View ➞ 0 - 25 , 25 - 50 , 50 - 75 , 75 - 100 , 100 - 125 , 125 - 150 , 150 - 175 , 175 - 200 , 200 - 225 , 225 - 250 , 250 - 275 , 275 - 300 , 300 - 325 , 325 - 350 , 350 - 375 , 375 - 400 , 400 - 425 , 425 - 450 , 450 - 475 , 475 - 500 , 500 - 525 , 525 - 550 , 550 - 575 | ||
 | Click To Change The Sort Order: By Market Cap or Company Size Performance: Year-to-date, Week and Day |  |
|
Get the most comprehensive stock market coverage daily at 12Stocks.com ➞ Best Stocks Today ➞ Best Stocks Weekly ➞ Best Stocks Year-to-Date ➞ Best Stocks Trends ➞  Best Stocks Today 12Stocks.com Best Nasdaq Stocks ➞ Best S&P 500 Stocks ➞ Best Tech Stocks ➞ Best Biotech Stocks ➞ |
| Detailed Overview of Financial Stocks |
| Financial Technical Overview, Leaders & Laggards, Top Financial ETF Funds & Detailed Financial Stocks List, Charts, Trends & More |
| Financial Sector: Technical Analysis, Trends & YTD Performance | |
| Financial sector is composed of stocks
from banks, brokers, insurance, REITs
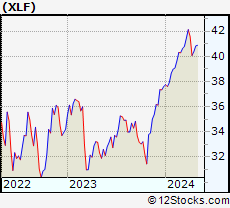
and services subsectors. Financial sector, as represented by XLF, an exchange-traded fund [ETF] that holds basket of Financial stocks (e.g, Bank of America, Goldman Sachs) is up by 7.8% and is currently outperforming the overall market by 0.27% year-to-date. Below is a quick view of Technical charts and trends: |
|
 XLF Weekly Chart |
|
| Long Term Trend: Good | |
| Medium Term Trend: Not Good | |
 XLF Daily Chart |
|
| Short Term Trend: Not Good | |
| Overall Trend Score: 33 | |
| YTD Performance: 7.8% | |
| **Trend Scores & Views Are Only For Educational Purposes And Not For Investing | |
| 12Stocks.com: Top Performing Financial Sector Stocks | ||||||||||||||||||||||||||||||||||||||||||||||||
 The top performing Financial sector stocks year to date are
Now, more recently, over last week, the top performing Financial sector stocks on the move are


|
||||||||||||||||||||||||||||||||||||||||||||||||
| 12Stocks.com: Investing in Financial Sector using Exchange Traded Funds | |
|
The following table shows list of key exchange traded funds (ETF) that
help investors track Financial Index. For detailed view, check out our ETF Funds section of our website. Quick View: Move mouse or cursor over ETF symbol (ticker) to view short-term Technical chart and over ETF name to view long term chart. Click on ticker or stock name for detailed view. Click on to add stock symbol to your watchlist and to view watchlist. |
12Stocks.com List of ETFs that track Financial Index
| Ticker | ETF Name | Watchlist | Recent Price | Smart Investing & Trading Score | Change % | Week % | Year-to-date % |
| XLF | Financial | | 51.91 | 33 | 0.99 | 0.99 | 7.8% |
| IAI | Broker-Dealers & Secs | | 174.97 | 63 | 2.34 | 2.34 | 21.82% |
| KBE | Bank | | 55.98 | 43 | 1.3 | 1.3 | 1.64% |
| FAS | Financial Bull 3X | | 161.82 | 33 | 2.91 | 2.91 | 7.48% |
| FAZ | Financial Bear 3X | | 4.54 | 62 | -2.78 | -2.78 | -27.4% |
| UYG | Financials | | 92.87 | 26 | 1.72 | 1.72 | 9% |
| KIE | Insurance | | 56.42 | 25 | 1.27 | 1.27 | 0.32% |
| 12Stocks.com: Charts, Trends, Fundamental Data and Performances of Financial Stocks | |
|
We now take in-depth look at all Financial stocks including charts, multi-period performances and overall trends (as measured by Smart Investing & Trading Score). One can sort Financial stocks (click link to choose) by Daily, Weekly and by Year-to-Date performances. Also, one can sort by size of the company or by market capitalization. |
| Select Your Default Chart Type: | |||||
| |||||
| Click on stock symbol or name for detailed view. Click on to add stock symbol to your watchlist and to view watchlist. Quick View: Move mouse or cursor over "Daily" to quickly view daily Technical stock chart and over "Weekly" to view weekly Technical stock chart. | |||||

 | MKL Markel Corporation |
| Sector: Financials | |
| SubSector: Property & Casualty Insurance | |
| MarketCap: 12405.9 Millions | |
| Recent Price: 1946.42 Smart Investing & Trading Score: 13 | |
| Day Percent Change: 0.86% Day Change: 16.55 | |
| Week Change: 0.86% Year-to-date Change: 12.8% | |
| MKL Links: Profile News Message Board | |
| Charts:- Daily , Weekly | |
| Add MKL to Watchlist: View: Get Complete MKL Trend Analysis ➞ | |
 | ACGL Arch Capital Group Ltd. |
| Sector: Financials | |
| SubSector: Property & Casualty Insurance | |
| MarketCap: 12350.9 Millions | |
| Recent Price: 88.51 Smart Investing & Trading Score: 60 | |
| Day Percent Change: 0.58% Day Change: 0.51 | |
| Week Change: 0.58% Year-to-date Change: -4.2% | |
| ACGL Links: Profile News Message Board | |
| Charts:- Daily , Weekly | |
| Add ACGL to Watchlist: View: Get Complete ACGL Trend Analysis ➞ | |
 | VEL Velocity Financial, Inc. |
| Sector: Financials | |
| SubSector: Mortgage Finance | |
| MarketCap: 12157 Millions | |
| Recent Price: 16.64 Smart Investing & Trading Score: 23 | |
| Day Percent Change: 1.77% Day Change: 0.29 | |
| Week Change: 1.77% Year-to-date Change: -14.9% | |
| VEL Links: Profile News Message Board | |
| Charts:- Daily , Weekly | |
| Add VEL to Watchlist: View: Get Complete VEL Trend Analysis ➞ | |
 | RYAN Ryan Specialty Holdings, Inc. |
| Sector: Financials | |
| SubSector: Insurance - Specialty | |
| MarketCap: 11630 Millions | |
| Recent Price: 57.82 Smart Investing & Trading Score: 0 | |
| Day Percent Change: -0.05% Day Change: -0.03 | |
| Week Change: -0.05% Year-to-date Change: -9.7% | |
| RYAN Links: Profile News Message Board | |
| Charts:- Daily , Weekly | |
| Add RYAN to Watchlist: View: Get Complete RYAN Trend Analysis ➞ | |
 | MAA Mid-America Apartment Communities, Inc. |
| Sector: Financials | |
| SubSector: REIT - Residential | |
| MarketCap: 11385.5 Millions | |
| Recent Price: 140.10 Smart Investing & Trading Score: 0 | |
| Day Percent Change: 0.07% Day Change: 0.1 | |
| Week Change: 0.07% Year-to-date Change: -7.6% | |
| MAA Links: Profile News Message Board | |
| Charts:- Daily , Weekly | |
| Add MAA to Watchlist: View: Get Complete MAA Trend Analysis ➞ | |
 | SUI Sun Communities, Inc. |
| Sector: Financials | |
| SubSector: REIT - Residential | |
| MarketCap: 11280.5 Millions | |
| Recent Price: 125.84 Smart Investing & Trading Score: 88 | |
| Day Percent Change: 1.24% Day Change: 1.54 | |
| Week Change: 1.24% Year-to-date Change: 3.1% | |
| SUI Links: Profile News Message Board | |
| Charts:- Daily , Weekly | |
| Add SUI to Watchlist: View: Get Complete SUI Trend Analysis ➞ | |
 | EXR Extra Space Storage Inc. |
| Sector: Financials | |
| SubSector: REIT - Industrial | |
| MarketCap: 11203.9 Millions | |
| Recent Price: 138.06 Smart Investing & Trading Score: 0 | |
| Day Percent Change: -0.89% Day Change: -1.24 | |
| Week Change: -0.89% Year-to-date Change: -6.7% | |
| EXR Links: Profile News Message Board | |
| Charts:- Daily , Weekly | |
| Add EXR to Watchlist: View: Get Complete EXR Trend Analysis ➞ | |
 | VTR Ventas, Inc. |
| Sector: Financials | |
| SubSector: REIT - Healthcare Facilities | |
| MarketCap: 11180.4 Millions | |
| Recent Price: 68.28 Smart Investing & Trading Score: 90 | |
| Day Percent Change: 1.16% Day Change: 0.78 | |
| Week Change: 1.16% Year-to-date Change: 16.8% | |
| VTR Links: Profile News Message Board | |
| Charts:- Daily , Weekly | |
| Add VTR to Watchlist: View: Get Complete VTR Trend Analysis ➞ | |
 | L Loews Corporation |
| Sector: Financials | |
| SubSector: Property & Casualty Insurance | |
| MarketCap: 10768.2 Millions | |
| Recent Price: 92.82 Smart Investing & Trading Score: 83 | |
| Day Percent Change: 2.8% Day Change: 2.53 | |
| Week Change: 2.8% Year-to-date Change: 9.7% | |
| L Links: Profile News Message Board | |
| Charts:- Daily , Weekly | |
| Add L to Watchlist: View: Get Complete L Trend Analysis ➞ | |
 | BRO Brown & Brown, Inc. |
| Sector: Financials | |
| SubSector: Insurance Brokers | |
| MarketCap: 10475.7 Millions | |
| Recent Price: 92.70 Smart Investing & Trading Score: 25 | |
| Day Percent Change: 0.5% Day Change: 0.46 | |
| Week Change: 0.5% Year-to-date Change: -9.0% | |
| BRO Links: Profile News Message Board | |
| Charts:- Daily , Weekly | |
| Add BRO to Watchlist: View: Get Complete BRO Trend Analysis ➞ | |
 | FITB Fifth Third Bancorp |
| Sector: Financials | |
| SubSector: Regional - Midwest Banks | |
| MarketCap: 10197 Millions | |
| Recent Price: 41.43 Smart Investing & Trading Score: 53 | |
| Day Percent Change: 1.27% Day Change: 0.52 | |
| Week Change: 1.27% Year-to-date Change: -1.1% | |
| FITB Links: Profile News Message Board | |
| Charts:- Daily , Weekly | |
| Add FITB to Watchlist: View: Get Complete FITB Trend Analysis ➞ | |
 | UDR UDR, Inc. |
| Sector: Financials | |
| SubSector: REIT - Residential | |
| MarketCap: 10180.1 Millions | |
| Recent Price: 37.97 Smart Investing & Trading Score: 0 | |
| Day Percent Change: -1.81% Day Change: -0.7 | |
| Week Change: -1.81% Year-to-date Change: -10.7% | |
| UDR Links: Profile News Message Board | |
| Charts:- Daily , Weekly | |
| Add UDR to Watchlist: View: Get Complete UDR Trend Analysis ➞ | |
 | KEY KeyCorp |
| Sector: Financials | |
| SubSector: Regional - Midwest Banks | |
| MarketCap: 10045 Millions | |
| Recent Price: 17.83 Smart Investing & Trading Score: 53 | |
| Day Percent Change: 1.02% Day Change: 0.18 | |
| Week Change: 1.02% Year-to-date Change: 5.3% | |
| KEY Links: Profile News Message Board | |
| Charts:- Daily , Weekly | |
| Add KEY to Watchlist: View: Get Complete KEY Trend Analysis ➞ | |
 | WRB W. R. Berkley Corporation |
| Sector: Financials | |
| SubSector: Property & Casualty Insurance | |
| MarketCap: 9863.82 Millions | |
| Recent Price: 70.48 Smart Investing & Trading Score: 69 | |
| Day Percent Change: 1.78% Day Change: 1.23 | |
| Week Change: 1.78% Year-to-date Change: 20.6% | |
| WRB Links: Profile News Message Board | |
| Charts:- Daily , Weekly | |
| Add WRB to Watchlist: View: Get Complete WRB Trend Analysis ➞ | |
 | INVH Invitation Homes Inc. |
| Sector: Financials | |
| SubSector: Real Estate Development | |
| MarketCap: 9782.89 Millions | |
| Recent Price: 30.19 Smart Investing & Trading Score: 0 | |
| Day Percent Change: -0.49% Day Change: -0.15 | |
| Week Change: -0.49% Year-to-date Change: -4.8% | |
| INVH Links: Profile News Message Board | |
| Charts:- Daily , Weekly | |
| Add INVH to Watchlist: View: Get Complete INVH Trend Analysis ➞ | |
 | ELS Equity LifeStyle Properties, Inc. |
| Sector: Financials | |
| SubSector: REIT - Residential | |
| MarketCap: 9570.61 Millions | |
| Recent Price: 61.43 Smart Investing & Trading Score: 59 | |
| Day Percent Change: 1.94% Day Change: 1.17 | |
| Week Change: 1.94% Year-to-date Change: -7.0% | |
| ELS Links: Profile News Message Board | |
| Charts:- Daily , Weekly | |
| Add ELS to Watchlist: View: Get Complete ELS Trend Analysis ➞ | |
 | WPC W. P. Carey Inc. |
| Sector: Financials | |
| SubSector: REIT - Diversified | |
| MarketCap: 9560.03 Millions | |
| Recent Price: 66.08 Smart Investing & Trading Score: 100 | |
| Day Percent Change: 1.69% Day Change: 1.1 | |
| Week Change: 1.69% Year-to-date Change: 23.0% | |
| WPC Links: Profile News Message Board | |
| Charts:- Daily , Weekly | |
| Add WPC to Watchlist: View: Get Complete WPC Trend Analysis ➞ | |
 | RJF Raymond James Financial, Inc. |
| Sector: Financials | |
| SubSector: Investment Brokerage - Regional | |
| MarketCap: 9490.65 Millions | |
| Recent Price: 166.48 Smart Investing & Trading Score: 70 | |
| Day Percent Change: 2.12% Day Change: 3.45 | |
| Week Change: 2.12% Year-to-date Change: 7.9% | |
| RJF Links: Profile News Message Board | |
| Charts:- Daily , Weekly | |
| Add RJF to Watchlist: View: Get Complete RJF Trend Analysis ➞ | |
 | BEN Franklin Resources, Inc. |
| Sector: Financials | |
| SubSector: Asset Management | |
| MarketCap: 9419.73 Millions | |
| Recent Price: 25.13 Smart Investing & Trading Score: 90 | |
| Day Percent Change: 4.93% Day Change: 1.18 | |
| Week Change: 4.93% Year-to-date Change: 25.9% | |
| BEN Links: Profile News Message Board | |
| Charts:- Daily , Weekly | |
| Add BEN to Watchlist: View: Get Complete BEN Trend Analysis ➞ | |
 | SYF Synchrony Financial |
| Sector: Financials | |
| SubSector: Credit Services | |
| MarketCap: 9297.28 Millions | |
| Recent Price: 69.25 Smart Investing & Trading Score: 53 | |
| Day Percent Change: 2.55% Day Change: 1.72 | |
| Week Change: 2.55% Year-to-date Change: 6.9% | |
| SYF Links: Profile News Message Board | |
| Charts:- Daily , Weekly | |
| Add SYF to Watchlist: View: Get Complete SYF Trend Analysis ➞ | |
 | NLY Annaly Capital Management, Inc. |
| Sector: Financials | |
| SubSector: Mortgage Investment | |
| MarketCap: 9127.79 Millions | |
| Recent Price: 20.91 Smart Investing & Trading Score: 100 | |
| Day Percent Change: 1.95% Day Change: 0.4 | |
| Week Change: 1.95% Year-to-date Change: 18.3% | |
| NLY Links: Profile News Message Board | |
| Charts:- Daily , Weekly | |
| Add NLY to Watchlist: View: Get Complete NLY Trend Analysis ➞ | |
 | CNA CNA Financial Corporation |
| Sector: Financials | |
| SubSector: Property & Casualty Insurance | |
| MarketCap: 9123.32 Millions | |
| Recent Price: 45.66 Smart Investing & Trading Score: 64 | |
| Day Percent Change: 4.03% Day Change: 1.77 | |
| Week Change: 4.03% Year-to-date Change: -4.7% | |
| CNA Links: Profile News Message Board | |
| Charts:- Daily , Weekly | |
| Add CNA to Watchlist: View: Get Complete CNA Trend Analysis ➞ | |
 | RF Regions Financial Corporation |
| Sector: Financials | |
| SubSector: Regional - Southeast Banks | |
| MarketCap: 8936.25 Millions | |
| Recent Price: 25.18 Smart Investing & Trading Score: 43 | |
| Day Percent Change: 1.17% Day Change: 0.29 | |
| Week Change: 1.17% Year-to-date Change: 8.2% | |
| RF Links: Profile News Message Board | |
| Charts:- Daily , Weekly | |
| Add RF to Watchlist: View: Get Complete RF Trend Analysis ➞ | |
 | CBOE Cboe Global Markets, Inc. |
| Sector: Financials | |
| SubSector: Diversified Investments | |
| MarketCap: 8834.5 Millions | |
| Recent Price: 250.87 Smart Investing & Trading Score: 100 | |
| Day Percent Change: 1.24% Day Change: 3.08 | |
| Week Change: 1.24% Year-to-date Change: 28.8% | |
| CBOE Links: Profile News Message Board | |
| Charts:- Daily , Weekly | |
| Add CBOE to Watchlist: View: Get Complete CBOE Trend Analysis ➞ | |
 | ERIE Erie Indemnity Company |
| Sector: Financials | |
| SubSector: Insurance Brokers | |
| MarketCap: 8822 Millions | |
| Recent Price: 356.21 Smart Investing & Trading Score: 80 | |
| Day Percent Change: 1.56% Day Change: 5.46 | |
| Week Change: 1.56% Year-to-date Change: -13.0% | |
| ERIE Links: Profile News Message Board | |
| Charts:- Daily , Weekly | |
| Add ERIE to Watchlist: View: Get Complete ERIE Trend Analysis ➞ | |
| For tabular summary view of above stock list: Summary View ➞ 0 - 25 , 25 - 50 , 50 - 75 , 75 - 100 , 100 - 125 , 125 - 150 , 150 - 175 , 175 - 200 , 200 - 225 , 225 - 250 , 250 - 275 , 275 - 300 , 300 - 325 , 325 - 350 , 350 - 375 , 375 - 400 , 400 - 425 , 425 - 450 , 450 - 475 , 475 - 500 , 500 - 525 , 525 - 550 , 550 - 575 | ||
| Click To Change The Sort Order: By Market Cap or Company Size Performance: Year-to-date, Week and Day | |
| Select Chart Type: | ||
|
Best Stocks Today 12Stocks.com |
© 2025 12Stocks.com Terms & Conditions Privacy Contact Us
All Information Provided Only For Education And Not To Be Used For Investing or Trading. See Terms & Conditions


One More Thing ... Get Best Stocks Delivered Daily!
Never Ever Miss A Move With Our Top Ten Stocks Lists
Find Best Stocks In Any Market - Bull or Bear Market
Take A Peek At Our Top Ten Stocks Lists: Daily, Weekly, Year-to-Date & Top Trends
Find Best Stocks In Any Market - Bull or Bear Market
Take A Peek At Our Top Ten Stocks Lists: Daily, Weekly, Year-to-Date & Top Trends
Financial Stocks With Best Up Trends [0-bearish to 100-bullish]: Uniti [100], LendingTree [100], Mercury General[100], Perella Weinberg[100], Broadstone Net[100], LendingClub [100], TPG RE[100], CareTrust REIT[100], Stewart Information[100], Healthcare Realty[100], VICI Properties[100]
Best Financial Stocks Year-to-Date:
ESSA Bancorp[3207.77%], Easterly Government[108.45%], Mr. Cooper[86.58%], Heritage Insurance[75.29%], Root [65.29%], Industrial Logistics[64.89%], Rocket [58.42%], Diversified Healthcare[49.61%], ProAssurance [49.59%], Uniti [47.09%], SoFi Technologies[41.62%] Best Financial Stocks This Week:
Uniti [64.77%], Industrial Logistics[11.36%], LendingTree [7.32%], eXp World[7.27%], EverQuote [6.89%], Camping World[6.84%], First Foundation[6.69%], Diamond Hill[5.46%], Mercury General[5.36%], Cipher Mining[5.27%], AlTi Global[5.13%] Best Financial Stocks Daily:
Uniti [64.77%], Industrial Logistics[11.36%], LendingTree [7.32%], eXp World[7.27%], EverQuote [6.89%], Camping World[6.84%], First Foundation[6.69%], Diamond Hill[5.46%], Mercury General[5.36%], Cipher Mining[5.27%], AlTi Global[5.13%]