
 Login Sign Up


| |||||
 |  | ||||

| 12Stocks.com Market Intelligence |
Best Financial Stocks
| In a hurry? Financial Stocks Lists: Performance Trends Table, Stock Charts
Sort Financial stocks: Daily, Weekly, Year-to-Date, Market Cap & Trends. Filter Financial stocks list by size:All Financial Large Mid-Range Small & MicroCap |
| 12Stocks.com Financial Stocks Performances & Trends Daily | |||||||||
|
|  The overall Smart Investing & Trading Score is 33 (0-bearish to 100-bullish) which puts Financial sector in short term bearish to neutral trend. The Smart Investing & Trading Score from previous trading session is 26 and hence an improvement of trend.
| ||||||||
Here are the Smart Investing & Trading Scores of the most requested Financial stocks at 12Stocks.com (click stock name for detailed review):
|


| 12Stocks.com: Investing in Financial sector with Stocks | |
|
The following table helps investors and traders sort through current performance and trends (as measured by Smart Investing & Trading Score) of various
stocks in the Financial sector. Quick View: Move mouse or cursor over stock symbol (ticker) to view short-term Technical chart and over stock name to view long term chart. Click on  to add stock symbol to your watchlist and to add stock symbol to your watchlist and  to view watchlist. Click on any ticker or stock name for detailed market intelligence report for that stock. to view watchlist. Click on any ticker or stock name for detailed market intelligence report for that stock. |
12Stocks.com Performance of Stocks in Financial Sector
| Ticker | Stock Name | Watchlist | Category | Recent Price | Smart Investing & Trading Score | Change % | YTD Change% |
| NXRT | NexPoint Residential |   | REIT | 30.55 | 0 | -0.75% | -25.85% |
| BDN | Brandywine Realty | | REIT - | 3.85 | 0 | 1.05% | -26.84% |
| PEB | Pebblebrook Hotel | | REIT | 9.90 | 46 | 2.06% | -26.87% |
| SITC | SITE Centers | | REIT - Retail | 11.13 | 60 | 4.70% | -27.21% |
| AAT | American Assets | | REIT - Retail | 18.80 | 20 | 0.53% | -27.29% |
| JEF | Jefferies | | Brokerage | 56.57 | 63 | 1.18% | -27.44% |
| RLJ | RLJ Lodging | | REIT | 7.27 | 23 | 0.69% | -27.44% |
| SUNS | Solar Senior | | Asset Mgmt | 9.93 | 27 | 0.61% | -27.54% |
| CWH | Camping World | | REIT - Office | 14.84 | 35 | 6.84% | -29.05% |
| BCBP | BCB Bancorp | | Regional Banks | 8.24 | 46 | 1.73% | -29.38% |
| RMAX | RE/MAX | | Property Mgmt | 7.51 | 12 | -0.27% | -29.62% |
| ESRT | Empire State | | REIT - | 7.22 | 27 | 0.98% | -29.73% |
| MSBI | Midland States | | Regional Banks | 16.73 | 20 | 1.21% | -30.34% |
| ONL | Orion Office | | REIT - Office | 2.56 | 63 | -1.16% | -30.35% |
| AHH | Armada Hoffler | | REIT - | 6.77 | 10 | 1.20% | -32.60% |
| AI | C3.ai | | REIT Mortgage | 23.19 | 17 | 3.39% | -32.65% |
| AMBC | Ambac | | Insurance | 8.27 | 48 | -0.84% | -34.62% |
| CMTG | Claros Mortgage | | REIT - Mortgage | 2.90 | 53 | 3.94% | -35.84% |
| EGBN | Eagle Bancorp | | Regional Banks | 16.49 | 25 | 3.32% | -36.26% |
| RC | Ready Capital | | Mortgage | 4.18 | 18 | 0.48% | -37.13% |
| LGIH | LGI Homes | | Real Estatet | 54.64 | 85 | 0.29% | -38.88% |
| INBK | First Internet | | Regional Banks | 21.85 | 17 | 1.82% | -39.15% |
| AFCG | AFC Gamma | | REIT - Specialty | 4.54 | 60 | 4.37% | -43.36% |
| IBTA | iShares iBonds | | Exchange Traded Fund | 35.97 | 10 | 3.57% | -44.73% |
| SLQT | SelectQuote | | Insurance | 1.76 | 27 | 1.15% | -52.69% |
| For chart view version of above stock list: Chart View ➞ 0 - 25 , 25 - 50 , 50 - 75 , 75 - 100 , 100 - 125 , 125 - 150 , 150 - 175 , 175 - 200 , 200 - 225 , 225 - 250 , 250 - 275 , 275 - 300 , 300 - 325 , 325 - 350 , 350 - 375 , 375 - 400 , 400 - 425 , 425 - 450 , 450 - 475 , 475 - 500 , 500 - 525 , 525 - 550 , 550 - 575 | ||
 | Click To Change The Sort Order: By Market Cap or Company Size Performance: Year-to-date, Week and Day |  |
|
Get the most comprehensive stock market coverage daily at 12Stocks.com ➞ Best Stocks Today ➞ Best Stocks Weekly ➞ Best Stocks Year-to-Date ➞ Best Stocks Trends ➞  Best Stocks Today 12Stocks.com Best Nasdaq Stocks ➞ Best S&P 500 Stocks ➞ Best Tech Stocks ➞ Best Biotech Stocks ➞ |
| Detailed Overview of Financial Stocks |
| Financial Technical Overview, Leaders & Laggards, Top Financial ETF Funds & Detailed Financial Stocks List, Charts, Trends & More |
| Financial Sector: Technical Analysis, Trends & YTD Performance | |
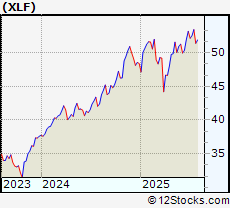
| Financial sector is composed of stocks
from banks, brokers, insurance, REITs
and services subsectors. Financial sector, as represented by XLF, an exchange-traded fund [ETF] that holds basket of Financial stocks (e.g, Bank of America, Goldman Sachs) is up by 7.8% and is currently outperforming the overall market by 0.27% year-to-date. Below is a quick view of Technical charts and trends: |
|
 XLF Weekly Chart |
|
| Long Term Trend: Good | |
| Medium Term Trend: Not Good | |
 XLF Daily Chart |
|
| Short Term Trend: Not Good | |
| Overall Trend Score: 33 | |
| YTD Performance: 7.8% | |
| **Trend Scores & Views Are Only For Educational Purposes And Not For Investing | |
| 12Stocks.com: Top Performing Financial Sector Stocks | ||||||||||||||||||||||||||||||||||||||||||||||||
 The top performing Financial sector stocks year to date are
Now, more recently, over last week, the top performing Financial sector stocks on the move are


|
||||||||||||||||||||||||||||||||||||||||||||||||
| 12Stocks.com: Investing in Financial Sector using Exchange Traded Funds | |
|
The following table shows list of key exchange traded funds (ETF) that
help investors track Financial Index. For detailed view, check out our ETF Funds section of our website. Quick View: Move mouse or cursor over ETF symbol (ticker) to view short-term Technical chart and over ETF name to view long term chart. Click on ticker or stock name for detailed view. Click on to add stock symbol to your watchlist and to view watchlist. |
12Stocks.com List of ETFs that track Financial Index
| Ticker | ETF Name | Watchlist | Recent Price | Smart Investing & Trading Score | Change % | Week % | Year-to-date % |
| XLF | Financial | | 51.91 | 33 | 0.99 | 0.99 | 7.8% |
| IAI | Broker-Dealers & Secs | | 174.97 | 63 | 2.34 | 2.34 | 21.82% |
| KBE | Bank | | 55.98 | 43 | 1.3 | 1.3 | 1.64% |
| FAS | Financial Bull 3X | | 161.82 | 33 | 2.91 | 2.91 | 7.48% |
| FAZ | Financial Bear 3X | | 4.54 | 62 | -2.78 | -2.78 | -27.4% |
| UYG | Financials | | 92.87 | 26 | 1.72 | 1.72 | 9% |
| KIE | Insurance | | 56.42 | 25 | 1.27 | 1.27 | 0.32% |
| 12Stocks.com: Charts, Trends, Fundamental Data and Performances of Financial Stocks | |
|
We now take in-depth look at all Financial stocks including charts, multi-period performances and overall trends (as measured by Smart Investing & Trading Score). One can sort Financial stocks (click link to choose) by Daily, Weekly and by Year-to-Date performances. Also, one can sort by size of the company or by market capitalization. |
| Select Your Default Chart Type: | |||||
| |||||
| Click on stock symbol or name for detailed view. Click on to add stock symbol to your watchlist and to view watchlist. Quick View: Move mouse or cursor over "Daily" to quickly view daily Technical stock chart and over "Weekly" to view weekly Technical stock chart. | |||||

 | NXRT NexPoint Residential Trust, Inc. |
| Sector: Financials | |
| SubSector: REIT - Residential | |
| MarketCap: 839.161 Millions | |
| Recent Price: 30.55 Smart Investing & Trading Score: 0 | |
| Day Percent Change: -0.75% Day Change: -0.23 | |
| Week Change: -0.75% Year-to-date Change: -25.9% | |
| NXRT Links: Profile News Message Board | |
| Charts:- Daily , Weekly | |
| Add NXRT to Watchlist: View: Get Complete NXRT Trend Analysis ➞ | |
 | BDN Brandywine Realty Trust |
| Sector: Financials | |
| SubSector: REIT - Diversified | |
| MarketCap: 1688.13 Millions | |
| Recent Price: 3.85 Smart Investing & Trading Score: 0 | |
| Day Percent Change: 1.05% Day Change: 0.04 | |
| Week Change: 1.05% Year-to-date Change: -26.8% | |
| BDN Links: Profile News Message Board | |
| Charts:- Daily , Weekly | |
| Add BDN to Watchlist: View: Get Complete BDN Trend Analysis ➞ | |
 | PEB Pebblebrook Hotel Trust |
| Sector: Financials | |
| SubSector: REIT - Hotel/Motel | |
| MarketCap: 1472.84 Millions | |
| Recent Price: 9.90 Smart Investing & Trading Score: 46 | |
| Day Percent Change: 2.06% Day Change: 0.2 | |
| Week Change: 2.06% Year-to-date Change: -26.9% | |
| PEB Links: Profile News Message Board | |
| Charts:- Daily , Weekly | |
| Add PEB to Watchlist: View: Get Complete PEB Trend Analysis ➞ | |
 | SITC SITE Centers Corp. |
| Sector: Financials | |
| SubSector: REIT - Retail | |
| MarketCap: 1449.54 Millions | |
| Recent Price: 11.13 Smart Investing & Trading Score: 60 | |
| Day Percent Change: 4.7% Day Change: 0.5 | |
| Week Change: 4.7% Year-to-date Change: -27.2% | |
| SITC Links: Profile News Message Board | |
| Charts:- Daily , Weekly | |
| Add SITC to Watchlist: View: Get Complete SITC Trend Analysis ➞ | |
 | AAT American Assets Trust, Inc. |
| Sector: Financials | |
| SubSector: REIT - Retail | |
| MarketCap: 1580.54 Millions | |
| Recent Price: 18.80 Smart Investing & Trading Score: 20 | |
| Day Percent Change: 0.53% Day Change: 0.1 | |
| Week Change: 0.53% Year-to-date Change: -27.3% | |
| AAT Links: Profile News Message Board | |
| Charts:- Daily , Weekly | |
| Add AAT to Watchlist: View: Get Complete AAT Trend Analysis ➞ | |
 | JEF Jefferies Financial Group Inc. |
| Sector: Financials | |
| SubSector: Investment Brokerage - Regional | |
| MarketCap: 3987.15 Millions | |
| Recent Price: 56.57 Smart Investing & Trading Score: 63 | |
| Day Percent Change: 1.18% Day Change: 0.66 | |
| Week Change: 1.18% Year-to-date Change: -27.4% | |
| JEF Links: Profile News Message Board | |
| Charts:- Daily , Weekly | |
| Add JEF to Watchlist: View: Get Complete JEF Trend Analysis ➞ | |
 | RLJ RLJ Lodging Trust |
| Sector: Financials | |
| SubSector: REIT - Hotel/Motel | |
| MarketCap: 1019.34 Millions | |
| Recent Price: 7.27 Smart Investing & Trading Score: 23 | |
| Day Percent Change: 0.69% Day Change: 0.05 | |
| Week Change: 0.69% Year-to-date Change: -27.4% | |
| RLJ Links: Profile News Message Board | |
| Charts:- Daily , Weekly | |
| Add RLJ to Watchlist: View: Get Complete RLJ Trend Analysis ➞ | |
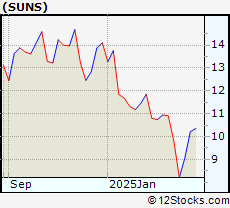 | SUNS Solar Senior Capital Ltd. |
| Sector: Financials | |
| SubSector: Asset Management | |
| MarketCap: 147.203 Millions | |
| Recent Price: 9.93 Smart Investing & Trading Score: 27 | |
| Day Percent Change: 0.61% Day Change: 0.06 | |
| Week Change: 0.61% Year-to-date Change: -27.5% | |
| SUNS Links: Profile News Message Board | |
| Charts:- Daily , Weekly | |
| Add SUNS to Watchlist: View: Get Complete SUNS Trend Analysis ➞ | |
 | CWH Camping World Holdings, Inc. |
| Sector: Financials | |
| SubSector: REIT - Office | |
| MarketCap: 473.566 Millions | |
| Recent Price: 14.84 Smart Investing & Trading Score: 35 | |
| Day Percent Change: 6.84% Day Change: 0.95 | |
| Week Change: 6.84% Year-to-date Change: -29.1% | |
| CWH Links: Profile News Message Board | |
| Charts:- Daily , Weekly | |
| Add CWH to Watchlist: View: Get Complete CWH Trend Analysis ➞ | |
 | BCBP BCB Bancorp, Inc. |
| Sector: Financials | |
| SubSector: Regional - Northeast Banks | |
| MarketCap: 196.799 Millions | |
| Recent Price: 8.24 Smart Investing & Trading Score: 46 | |
| Day Percent Change: 1.73% Day Change: 0.14 | |
| Week Change: 1.73% Year-to-date Change: -29.4% | |
| BCBP Links: Profile News Message Board | |
| Charts:- Daily , Weekly | |
| Add BCBP to Watchlist: View: Get Complete BCBP Trend Analysis ➞ | |
 | RMAX RE/MAX Holdings, Inc. |
| Sector: Financials | |
| SubSector: Property Management | |
| MarketCap: 334.742 Millions | |
| Recent Price: 7.51 Smart Investing & Trading Score: 12 | |
| Day Percent Change: -0.27% Day Change: -0.02 | |
| Week Change: -0.27% Year-to-date Change: -29.6% | |
| RMAX Links: Profile News Message Board | |
| Charts:- Daily , Weekly | |
| Add RMAX to Watchlist: View: Get Complete RMAX Trend Analysis ➞ | |
 | ESRT Empire State Realty Trust, Inc. |
| Sector: Financials | |
| SubSector: REIT - Diversified | |
| MarketCap: 1632.13 Millions | |
| Recent Price: 7.22 Smart Investing & Trading Score: 27 | |
| Day Percent Change: 0.98% Day Change: 0.07 | |
| Week Change: 0.98% Year-to-date Change: -29.7% | |
| ESRT Links: Profile News Message Board | |
| Charts:- Daily , Weekly | |
| Add ESRT to Watchlist: View: Get Complete ESRT Trend Analysis ➞ | |
 | MSBI Midland States Bancorp, Inc. |
| Sector: Financials | |
| SubSector: Regional - Midwest Banks | |
| MarketCap: 400.27 Millions | |
| Recent Price: 16.73 Smart Investing & Trading Score: 20 | |
| Day Percent Change: 1.21% Day Change: 0.2 | |
| Week Change: 1.21% Year-to-date Change: -30.3% | |
| MSBI Links: Profile News Message Board | |
| Charts:- Daily , Weekly | |
| Add MSBI to Watchlist: View: Get Complete MSBI Trend Analysis ➞ | |
 | ONL Orion Office REIT Inc. |
| Sector: Financials | |
| SubSector: REIT - Office | |
| MarketCap: 375 Millions | |
| Recent Price: 2.56 Smart Investing & Trading Score: 63 | |
| Day Percent Change: -1.16% Day Change: -0.03 | |
| Week Change: -1.16% Year-to-date Change: -30.4% | |
| ONL Links: Profile News Message Board | |
| Charts:- Daily , Weekly | |
| Add ONL to Watchlist: View: Get Complete ONL Trend Analysis ➞ | |
 | AHH Armada Hoffler Properties, Inc. |
| Sector: Financials | |
| SubSector: REIT - Diversified | |
| MarketCap: 550.653 Millions | |
| Recent Price: 6.77 Smart Investing & Trading Score: 10 | |
| Day Percent Change: 1.2% Day Change: 0.08 | |
| Week Change: 1.2% Year-to-date Change: -32.6% | |
| AHH Links: Profile News Message Board | |
| Charts:- Daily , Weekly | |
| Add AHH to Watchlist: View: Get Complete AHH Trend Analysis ➞ | |
 | AI C3.ai, Inc. |
| Sector: Financials | |
| SubSector: REIT Mortgage | |
| MarketCap: 12467 Millions | |
| Recent Price: 23.19 Smart Investing & Trading Score: 17 | |
| Day Percent Change: 3.39% Day Change: 0.76 | |
| Week Change: 3.39% Year-to-date Change: -32.7% | |
| AI Links: Profile News Message Board | |
| Charts:- Daily , Weekly | |
| Add AI to Watchlist: View: Get Complete AI Trend Analysis ➞ | |
 | AMBC Ambac Financial Group, Inc. |
| Sector: Financials | |
| SubSector: Surety & Title Insurance | |
| MarketCap: 587.818 Millions | |
| Recent Price: 8.27 Smart Investing & Trading Score: 48 | |
| Day Percent Change: -0.84% Day Change: -0.07 | |
| Week Change: -0.84% Year-to-date Change: -34.6% | |
| AMBC Links: Profile News Message Board | |
| Charts:- Daily , Weekly | |
| Add AMBC to Watchlist: View: Get Complete AMBC Trend Analysis ➞ | |
 | CMTG Claros Mortgage Trust, Inc. |
| Sector: Financials | |
| SubSector: REIT - Mortgage | |
| MarketCap: 1610 Millions | |
| Recent Price: 2.90 Smart Investing & Trading Score: 53 | |
| Day Percent Change: 3.94% Day Change: 0.11 | |
| Week Change: 3.94% Year-to-date Change: -35.8% | |
| CMTG Links: Profile News Message Board | |
| Charts:- Daily , Weekly | |
| Add CMTG to Watchlist: View: Get Complete CMTG Trend Analysis ➞ | |
 | EGBN Eagle Bancorp, Inc. |
| Sector: Financials | |
| SubSector: Regional - Mid-Atlantic Banks | |
| MarketCap: 906.559 Millions | |
| Recent Price: 16.49 Smart Investing & Trading Score: 25 | |
| Day Percent Change: 3.32% Day Change: 0.53 | |
| Week Change: 3.32% Year-to-date Change: -36.3% | |
| EGBN Links: Profile News Message Board | |
| Charts:- Daily , Weekly | |
| Add EGBN to Watchlist: View: Get Complete EGBN Trend Analysis ➞ | |
 | RC Ready Capital Corporation |
| Sector: Financials | |
| SubSector: Mortgage Investment | |
| MarketCap: 358.039 Millions | |
| Recent Price: 4.18 Smart Investing & Trading Score: 18 | |
| Day Percent Change: 0.48% Day Change: 0.02 | |
| Week Change: 0.48% Year-to-date Change: -37.1% | |
| RC Links: Profile News Message Board | |
| Charts:- Daily , Weekly | |
| Add RC to Watchlist: View: Get Complete RC Trend Analysis ➞ | |
 | LGIH LGI Homes, Inc. |
| Sector: Financials | |
| SubSector: Real Estate Development | |
| MarketCap: 1316.49 Millions | |
| Recent Price: 54.64 Smart Investing & Trading Score: 85 | |
| Day Percent Change: 0.29% Day Change: 0.16 | |
| Week Change: 0.29% Year-to-date Change: -38.9% | |
| LGIH Links: Profile News Message Board | |
| Charts:- Daily , Weekly | |
| Add LGIH to Watchlist: View: Get Complete LGIH Trend Analysis ➞ | |
 | INBK First Internet Bancorp |
| Sector: Financials | |
| SubSector: Regional - Midwest Banks | |
| MarketCap: 149.07 Millions | |
| Recent Price: 21.85 Smart Investing & Trading Score: 17 | |
| Day Percent Change: 1.82% Day Change: 0.39 | |
| Week Change: 1.82% Year-to-date Change: -39.2% | |
| INBK Links: Profile News Message Board | |
| Charts:- Daily , Weekly | |
| Add INBK to Watchlist: View: Get Complete INBK Trend Analysis ➞ | |
 | AFCG AFC Gamma, Inc. |
| Sector: Financials | |
| SubSector: REIT - Specialty | |
| MarketCap: 269 Millions | |
| Recent Price: 4.54 Smart Investing & Trading Score: 60 | |
| Day Percent Change: 4.37% Day Change: 0.19 | |
| Week Change: 4.37% Year-to-date Change: -43.4% | |
| AFCG Links: Profile News Message Board | |
| Charts:- Daily , Weekly | |
| Add AFCG to Watchlist: View: Get Complete AFCG Trend Analysis ➞ | |
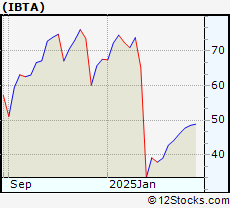 | IBTA iShares iBonds Dec 2021 Term Treasury ETF |
| Sector: Financials | |
| SubSector: Exchange Traded Fund | |
| MarketCap: 60157 Millions | |
| Recent Price: 35.97 Smart Investing & Trading Score: 10 | |
| Day Percent Change: 3.57% Day Change: 1.24 | |
| Week Change: 3.57% Year-to-date Change: -44.7% | |
| IBTA Links: Profile News Message Board | |
| Charts:- Daily , Weekly | |
| Add IBTA to Watchlist: View: Get Complete IBTA Trend Analysis ➞ | |
 | SLQT SelectQuote, Inc. |
| Sector: Financials | |
| SubSector: Insurance Brokers | |
| MarketCap: 38257 Millions | |
| Recent Price: 1.76 Smart Investing & Trading Score: 27 | |
| Day Percent Change: 1.15% Day Change: 0.02 | |
| Week Change: 1.15% Year-to-date Change: -52.7% | |
| SLQT Links: Profile News Message Board | |
| Charts:- Daily , Weekly | |
| Add SLQT to Watchlist: View: Get Complete SLQT Trend Analysis ➞ | |
| For tabular summary view of above stock list: Summary View ➞ 0 - 25 , 25 - 50 , 50 - 75 , 75 - 100 , 100 - 125 , 125 - 150 , 150 - 175 , 175 - 200 , 200 - 225 , 225 - 250 , 250 - 275 , 275 - 300 , 300 - 325 , 325 - 350 , 350 - 375 , 375 - 400 , 400 - 425 , 425 - 450 , 450 - 475 , 475 - 500 , 500 - 525 , 525 - 550 , 550 - 575 | ||
| Click To Change The Sort Order: By Market Cap or Company Size Performance: Year-to-date, Week and Day | |
| Select Chart Type: | ||
|
Best Stocks Today 12Stocks.com |
© 2025 12Stocks.com Terms & Conditions Privacy Contact Us
All Information Provided Only For Education And Not To Be Used For Investing or Trading. See Terms & Conditions


One More Thing ... Get Best Stocks Delivered Daily!
Never Ever Miss A Move With Our Top Ten Stocks Lists
Find Best Stocks In Any Market - Bull or Bear Market
Take A Peek At Our Top Ten Stocks Lists: Daily, Weekly, Year-to-Date & Top Trends
Find Best Stocks In Any Market - Bull or Bear Market
Take A Peek At Our Top Ten Stocks Lists: Daily, Weekly, Year-to-Date & Top Trends
Financial Stocks With Best Up Trends [0-bearish to 100-bullish]: Uniti [100], LendingTree [100], Mercury General[100], Perella Weinberg[100], Broadstone Net[100], LendingClub [100], TPG RE[100], CareTrust REIT[100], Stewart Information[100], Healthcare Realty[100], VICI Properties[100]
Best Financial Stocks Year-to-Date:
ESSA Bancorp[3207.77%], Easterly Government[108.45%], Mr. Cooper[86.58%], Heritage Insurance[75.29%], Root [65.29%], Industrial Logistics[64.89%], Rocket [58.42%], Diversified Healthcare[49.61%], ProAssurance [49.59%], Uniti [47.09%], SoFi Technologies[41.62%] Best Financial Stocks This Week:
Uniti [64.77%], Industrial Logistics[11.36%], LendingTree [7.32%], eXp World[7.27%], EverQuote [6.89%], Camping World[6.84%], First Foundation[6.69%], Diamond Hill[5.46%], Mercury General[5.36%], Cipher Mining[5.27%], AlTi Global[5.13%] Best Financial Stocks Daily:
Uniti [64.77%], Industrial Logistics[11.36%], LendingTree [7.32%], eXp World[7.27%], EverQuote [6.89%], Camping World[6.84%], First Foundation[6.69%], Diamond Hill[5.46%], Mercury General[5.36%], Cipher Mining[5.27%], AlTi Global[5.13%]