
 Login Sign Up


| |||||
 |  | ||||

| 12Stocks.com Market Intelligence |
Best Financial Stocks
| In a hurry? Financial Stocks Lists: Performance Trends Table, Stock Charts
Sort Financial stocks: Daily, Weekly, Year-to-Date, Market Cap & Trends. Filter Financial stocks list by size:All Financial Large Mid-Range Small & MicroCap |
| 12Stocks.com Financial Stocks Performances & Trends Daily | |||||||||
|
|  The overall Smart Investing & Trading Score is 33 (0-bearish to 100-bullish) which puts Financial sector in short term bearish to neutral trend. The Smart Investing & Trading Score from previous trading session is 26 and hence an improvement of trend.
| ||||||||
Here are the Smart Investing & Trading Scores of the most requested Financial stocks at 12Stocks.com (click stock name for detailed review):
|


| 12Stocks.com: Investing in Financial sector with Stocks | |
|
The following table helps investors and traders sort through current performance and trends (as measured by Smart Investing & Trading Score) of various
stocks in the Financial sector. Quick View: Move mouse or cursor over stock symbol (ticker) to view short-term Technical chart and over stock name to view long term chart. Click on  to add stock symbol to your watchlist and to add stock symbol to your watchlist and  to view watchlist. Click on any ticker or stock name for detailed market intelligence report for that stock. to view watchlist. Click on any ticker or stock name for detailed market intelligence report for that stock. |
12Stocks.com Performance of Stocks in Financial Sector
| Ticker | Stock Name | Watchlist | Category | Recent Price | Smart Investing & Trading Score | Change % | YTD Change% |
| EXR | Extra Space |   | REIT - Industrial | 138.06 | 0 | -0.89% | -6.67% |
| CIVB | Civista Bancshares | | Regional Banks | 19.47 | 17 | 0.62% | -6.70% |
| FHB | First Hawaiian | | Regional Banks | 23.95 | 23 | 0.93% | -6.82% |
| KREF | KKR Real | | Mortgage | 9.19 | 93 | 1.32% | -6.88% |
| FISI | Institutions | | Regional Banks | 25.11 | 10 | 0.76% | -6.88% |
| SFBS | ServisFirst Bancshares | | Foreign Banks | 78.28 | 43 | 1.25% | -6.88% |
| WAL | Western Alliance | | Regional Banks | 77.40 | 43 | 1.40% | -6.94% |
| FULT | Fulton | | Regional Banks | 17.76 | 43 | 0.79% | -6.96% |
| MKTX | MarketAxess | | Brokerage | 209.43 | 32 | 0.81% | -6.98% |
| ALTI | AlTi Global | | Asset Mgmt | 4.10 | 61 | 5.13% | -7.03% |
| ELS | Equity LifeStyle | | REIT | 61.43 | 59 | 1.94% | -7.03% |
| USCB | USCB | | Banks - Regional | 16.40 | 13 | 1.42% | -7.12% |
| AFG | American | | Insurance | 123.60 | 31 | 0.96% | -7.15% |
| SMBC | Southern Missouri | | S&L | 53.01 | 13 | 1.03% | -7.25% |
| HFWA | Heritage | | Regional Banks | 22.50 | 17 | 1.67% | -7.30% |
| WSBC | WesBanco | | Regional Banks | 29.82 | 17 | 1.05% | -7.31% |
| CPF | Central Pacific | | Regional Banks | 26.62 | 38 | 1.80% | -7.50% |
| MAA | Mid-America Apartment | | REIT | 140.10 | 0 | 0.07% | -7.56% |
| FPI | Farmland Partners | | REIT - | 10.75 | 39 | 1.32% | -7.62% |
| SNV | Synovus | | Regional Banks | 46.94 | 17 | 0.84% | -7.62% |
| SBSI | Southside Bancshares | | Regional Banks | 28.98 | 36 | 1.01% | -7.69% |
| KMPR | Kemper | | Insurance | 60.91 | 28 | 1.42% | -7.89% |
| WAFD | Washington Federal | | S&L | 29.41 | 68 | 1.87% | -7.95% |
| MET | MetLife | | Life Insurance | 74.83 | 18 | 1.11% | -8.02% |
| PEBK | Peoples Bancorp | | Regional Banks | 28.36 | 46 | 1.79% | -8.04% |
| For chart view version of above stock list: Chart View ➞ 0 - 25 , 25 - 50 , 50 - 75 , 75 - 100 , 100 - 125 , 125 - 150 , 150 - 175 , 175 - 200 , 200 - 225 , 225 - 250 , 250 - 275 , 275 - 300 , 300 - 325 , 325 - 350 , 350 - 375 , 375 - 400 , 400 - 425 , 425 - 450 , 450 - 475 , 475 - 500 , 500 - 525 , 525 - 550 , 550 - 575 | ||
 | Click To Change The Sort Order: By Market Cap or Company Size Performance: Year-to-date, Week and Day |  |
|
Get the most comprehensive stock market coverage daily at 12Stocks.com ➞ Best Stocks Today ➞ Best Stocks Weekly ➞ Best Stocks Year-to-Date ➞ Best Stocks Trends ➞  Best Stocks Today 12Stocks.com Best Nasdaq Stocks ➞ Best S&P 500 Stocks ➞ Best Tech Stocks ➞ Best Biotech Stocks ➞ |
| Detailed Overview of Financial Stocks |
| Financial Technical Overview, Leaders & Laggards, Top Financial ETF Funds & Detailed Financial Stocks List, Charts, Trends & More |
| Financial Sector: Technical Analysis, Trends & YTD Performance | |
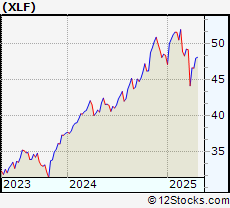
| Financial sector is composed of stocks
from banks, brokers, insurance, REITs
and services subsectors. Financial sector, as represented by XLF, an exchange-traded fund [ETF] that holds basket of Financial stocks (e.g, Bank of America, Goldman Sachs) is up by 7.8% and is currently outperforming the overall market by 0.27% year-to-date. Below is a quick view of Technical charts and trends: |
|
 XLF Weekly Chart |
|
| Long Term Trend: Good | |
| Medium Term Trend: Not Good | |
 XLF Daily Chart |
|
| Short Term Trend: Not Good | |
| Overall Trend Score: 33 | |
| YTD Performance: 7.8% | |
| **Trend Scores & Views Are Only For Educational Purposes And Not For Investing | |
| 12Stocks.com: Top Performing Financial Sector Stocks | ||||||||||||||||||||||||||||||||||||||||||||||||
 The top performing Financial sector stocks year to date are
Now, more recently, over last week, the top performing Financial sector stocks on the move are


|
||||||||||||||||||||||||||||||||||||||||||||||||
| 12Stocks.com: Investing in Financial Sector using Exchange Traded Funds | |
|
The following table shows list of key exchange traded funds (ETF) that
help investors track Financial Index. For detailed view, check out our ETF Funds section of our website. Quick View: Move mouse or cursor over ETF symbol (ticker) to view short-term Technical chart and over ETF name to view long term chart. Click on ticker or stock name for detailed view. Click on to add stock symbol to your watchlist and to view watchlist. |
12Stocks.com List of ETFs that track Financial Index
| Ticker | ETF Name | Watchlist | Recent Price | Smart Investing & Trading Score | Change % | Week % | Year-to-date % |
| XLF | Financial | | 51.91 | 33 | 0.99 | 0.99 | 7.8% |
| IAI | Broker-Dealers & Secs | | 174.97 | 63 | 2.34 | 2.34 | 21.82% |
| KBE | Bank | | 55.98 | 43 | 1.3 | 1.3 | 1.64% |
| FAS | Financial Bull 3X | | 161.82 | 33 | 2.91 | 2.91 | 7.48% |
| FAZ | Financial Bear 3X | | 4.54 | 62 | -2.78 | -2.78 | -27.4% |
| UYG | Financials | | 92.87 | 26 | 1.72 | 1.72 | 9% |
| KIE | Insurance | | 56.42 | 25 | 1.27 | 1.27 | 0.32% |
| 12Stocks.com: Charts, Trends, Fundamental Data and Performances of Financial Stocks | |
|
We now take in-depth look at all Financial stocks including charts, multi-period performances and overall trends (as measured by Smart Investing & Trading Score). One can sort Financial stocks (click link to choose) by Daily, Weekly and by Year-to-Date performances. Also, one can sort by size of the company or by market capitalization. |
| Select Your Default Chart Type: | |||||
| |||||
| Click on stock symbol or name for detailed view. Click on to add stock symbol to your watchlist and to view watchlist. Quick View: Move mouse or cursor over "Daily" to quickly view daily Technical stock chart and over "Weekly" to view weekly Technical stock chart. | |||||

 | EXR Extra Space Storage Inc. |
| Sector: Financials | |
| SubSector: REIT - Industrial | |
| MarketCap: 11203.9 Millions | |
| Recent Price: 138.06 Smart Investing & Trading Score: 0 | |
| Day Percent Change: -0.89% Day Change: -1.24 | |
| Week Change: -0.89% Year-to-date Change: -6.7% | |
| EXR Links: Profile News Message Board | |
| Charts:- Daily , Weekly | |
| Add EXR to Watchlist: View: Get Complete EXR Trend Analysis ➞ | |
 | CIVB Civista Bancshares, Inc. |
| Sector: Financials | |
| SubSector: Regional - Pacific Banks | |
| MarketCap: 255.929 Millions | |
| Recent Price: 19.47 Smart Investing & Trading Score: 17 | |
| Day Percent Change: 0.62% Day Change: 0.12 | |
| Week Change: 0.62% Year-to-date Change: -6.7% | |
| CIVB Links: Profile News Message Board | |
| Charts:- Daily , Weekly | |
| Add CIVB to Watchlist: View: Get Complete CIVB Trend Analysis ➞ | |
 | FHB First Hawaiian, Inc. |
| Sector: Financials | |
| SubSector: Regional - Pacific Banks | |
| MarketCap: 2398.99 Millions | |
| Recent Price: 23.95 Smart Investing & Trading Score: 23 | |
| Day Percent Change: 0.93% Day Change: 0.22 | |
| Week Change: 0.93% Year-to-date Change: -6.8% | |
| FHB Links: Profile News Message Board | |
| Charts:- Daily , Weekly | |
| Add FHB to Watchlist: View: Get Complete FHB Trend Analysis ➞ | |
 | KREF KKR Real Estate Finance Trust Inc. |
| Sector: Financials | |
| SubSector: Mortgage Investment | |
| MarketCap: 645.939 Millions | |
| Recent Price: 9.19 Smart Investing & Trading Score: 93 | |
| Day Percent Change: 1.32% Day Change: 0.12 | |
| Week Change: 1.32% Year-to-date Change: -6.9% | |
| KREF Links: Profile News Message Board | |
| Charts:- Daily , Weekly | |
| Add KREF to Watchlist: View: Get Complete KREF Trend Analysis ➞ | |
 | FISI Financial Institutions, Inc. |
| Sector: Financials | |
| SubSector: Regional - Mid-Atlantic Banks | |
| MarketCap: 253.459 Millions | |
| Recent Price: 25.11 Smart Investing & Trading Score: 10 | |
| Day Percent Change: 0.76% Day Change: 0.19 | |
| Week Change: 0.76% Year-to-date Change: -6.9% | |
| FISI Links: Profile News Message Board | |
| Charts:- Daily , Weekly | |
| Add FISI to Watchlist: View: Get Complete FISI Trend Analysis ➞ | |
 | SFBS ServisFirst Bancshares, Inc. |
| Sector: Financials | |
| SubSector: Foreign Money Center Banks | |
| MarketCap: 1596.71 Millions | |
| Recent Price: 78.28 Smart Investing & Trading Score: 43 | |
| Day Percent Change: 1.25% Day Change: 0.97 | |
| Week Change: 1.25% Year-to-date Change: -6.9% | |
| SFBS Links: Profile News Message Board | |
| Charts:- Daily , Weekly | |
| Add SFBS to Watchlist: View: Get Complete SFBS Trend Analysis ➞ | |
 | WAL Western Alliance Bancorporation |
| Sector: Financials | |
| SubSector: Regional - Pacific Banks | |
| MarketCap: 2980.09 Millions | |
| Recent Price: 77.40 Smart Investing & Trading Score: 43 | |
| Day Percent Change: 1.4% Day Change: 1.07 | |
| Week Change: 1.4% Year-to-date Change: -6.9% | |
| WAL Links: Profile News Message Board | |
| Charts:- Daily , Weekly | |
| Add WAL to Watchlist: View: Get Complete WAL Trend Analysis ➞ | |
 | FULT Fulton Financial Corporation |
| Sector: Financials | |
| SubSector: Regional - Northeast Banks | |
| MarketCap: 2030.89 Millions | |
| Recent Price: 17.76 Smart Investing & Trading Score: 43 | |
| Day Percent Change: 0.79% Day Change: 0.14 | |
| Week Change: 0.79% Year-to-date Change: -7.0% | |
| FULT Links: Profile News Message Board | |
| Charts:- Daily , Weekly | |
| Add FULT to Watchlist: View: Get Complete FULT Trend Analysis ➞ | |
 | MKTX MarketAxess Holdings Inc. |
| Sector: Financials | |
| SubSector: Investment Brokerage - National | |
| MarketCap: 12431.5 Millions | |
| Recent Price: 209.43 Smart Investing & Trading Score: 32 | |
| Day Percent Change: 0.81% Day Change: 1.68 | |
| Week Change: 0.81% Year-to-date Change: -7.0% | |
| MKTX Links: Profile News Message Board | |
| Charts:- Daily , Weekly | |
| Add MKTX to Watchlist: View: Get Complete MKTX Trend Analysis ➞ | |
 | ALTI AlTi Global, Inc. |
| Sector: Financials | |
| SubSector: Asset Management | |
| MarketCap: 917 Millions | |
| Recent Price: 4.10 Smart Investing & Trading Score: 61 | |
| Day Percent Change: 5.13% Day Change: 0.2 | |
| Week Change: 5.13% Year-to-date Change: -7.0% | |
| ALTI Links: Profile News Message Board | |
| Charts:- Daily , Weekly | |
| Add ALTI to Watchlist: View: Get Complete ALTI Trend Analysis ➞ | |
 | ELS Equity LifeStyle Properties, Inc. |
| Sector: Financials | |
| SubSector: REIT - Residential | |
| MarketCap: 9570.61 Millions | |
| Recent Price: 61.43 Smart Investing & Trading Score: 59 | |
| Day Percent Change: 1.94% Day Change: 1.17 | |
| Week Change: 1.94% Year-to-date Change: -7.0% | |
| ELS Links: Profile News Message Board | |
| Charts:- Daily , Weekly | |
| Add ELS to Watchlist: View: Get Complete ELS Trend Analysis ➞ | |
 | USCB USCB Financial Holdings, Inc. |
| Sector: Financials | |
| SubSector: Banks - Regional | |
| MarketCap: 198 Millions | |
| Recent Price: 16.40 Smart Investing & Trading Score: 13 | |
| Day Percent Change: 1.42% Day Change: 0.23 | |
| Week Change: 1.42% Year-to-date Change: -7.1% | |
| USCB Links: Profile News Message Board | |
| Charts:- Daily , Weekly | |
| Add USCB to Watchlist: View: Get Complete USCB Trend Analysis ➞ | |
 | AFG American Financial Group, Inc. |
| Sector: Financials | |
| SubSector: Property & Casualty Insurance | |
| MarketCap: 5353.82 Millions | |
| Recent Price: 123.60 Smart Investing & Trading Score: 31 | |
| Day Percent Change: 0.96% Day Change: 1.18 | |
| Week Change: 0.96% Year-to-date Change: -7.2% | |
| AFG Links: Profile News Message Board | |
| Charts:- Daily , Weekly | |
| Add AFG to Watchlist: View: Get Complete AFG Trend Analysis ➞ | |
 | SMBC Southern Missouri Bancorp, Inc. |
| Sector: Financials | |
| SubSector: Savings & Loans | |
| MarketCap: 272.53 Millions | |
| Recent Price: 53.01 Smart Investing & Trading Score: 13 | |
| Day Percent Change: 1.03% Day Change: 0.54 | |
| Week Change: 1.03% Year-to-date Change: -7.3% | |
| SMBC Links: Profile News Message Board | |
| Charts:- Daily , Weekly | |
| Add SMBC to Watchlist: View: Get Complete SMBC Trend Analysis ➞ | |
 | HFWA Heritage Financial Corporation |
| Sector: Financials | |
| SubSector: Regional - Pacific Banks | |
| MarketCap: 752.829 Millions | |
| Recent Price: 22.50 Smart Investing & Trading Score: 17 | |
| Day Percent Change: 1.67% Day Change: 0.37 | |
| Week Change: 1.67% Year-to-date Change: -7.3% | |
| HFWA Links: Profile News Message Board | |
| Charts:- Daily , Weekly | |
| Add HFWA to Watchlist: View: Get Complete HFWA Trend Analysis ➞ | |
 | WSBC WesBanco, Inc. |
| Sector: Financials | |
| SubSector: Regional - Mid-Atlantic Banks | |
| MarketCap: 1575.79 Millions | |
| Recent Price: 29.82 Smart Investing & Trading Score: 17 | |
| Day Percent Change: 1.05% Day Change: 0.31 | |
| Week Change: 1.05% Year-to-date Change: -7.3% | |
| WSBC Links: Profile News Message Board | |
| Charts:- Daily , Weekly | |
| Add WSBC to Watchlist: View: Get Complete WSBC Trend Analysis ➞ | |
 | CPF Central Pacific Financial Corp. |
| Sector: Financials | |
| SubSector: Regional - Pacific Banks | |
| MarketCap: 407.429 Millions | |
| Recent Price: 26.62 Smart Investing & Trading Score: 38 | |
| Day Percent Change: 1.8% Day Change: 0.47 | |
| Week Change: 1.8% Year-to-date Change: -7.5% | |
| CPF Links: Profile News Message Board | |
| Charts:- Daily , Weekly | |
| Add CPF to Watchlist: View: Get Complete CPF Trend Analysis ➞ | |
 | MAA Mid-America Apartment Communities, Inc. |
| Sector: Financials | |
| SubSector: REIT - Residential | |
| MarketCap: 11385.5 Millions | |
| Recent Price: 140.10 Smart Investing & Trading Score: 0 | |
| Day Percent Change: 0.07% Day Change: 0.1 | |
| Week Change: 0.07% Year-to-date Change: -7.6% | |
| MAA Links: Profile News Message Board | |
| Charts:- Daily , Weekly | |
| Add MAA to Watchlist: View: Get Complete MAA Trend Analysis ➞ | |
 | FPI Farmland Partners Inc. |
| Sector: Financials | |
| SubSector: REIT - Diversified | |
| MarketCap: 182.653 Millions | |
| Recent Price: 10.75 Smart Investing & Trading Score: 39 | |
| Day Percent Change: 1.32% Day Change: 0.14 | |
| Week Change: 1.32% Year-to-date Change: -7.6% | |
| FPI Links: Profile News Message Board | |
| Charts:- Daily , Weekly | |
| Add FPI to Watchlist: View: Get Complete FPI Trend Analysis ➞ | |
 | SNV Synovus Financial Corp. |
| Sector: Financials | |
| SubSector: Regional - Mid-Atlantic Banks | |
| MarketCap: 2697.29 Millions | |
| Recent Price: 46.94 Smart Investing & Trading Score: 17 | |
| Day Percent Change: 0.84% Day Change: 0.39 | |
| Week Change: 0.84% Year-to-date Change: -7.6% | |
| SNV Links: Profile News Message Board | |
| Charts:- Daily , Weekly | |
| Add SNV to Watchlist: View: Get Complete SNV Trend Analysis ➞ | |
 | SBSI Southside Bancshares, Inc. |
| Sector: Financials | |
| SubSector: Regional - Mid-Atlantic Banks | |
| MarketCap: 971.259 Millions | |
| Recent Price: 28.98 Smart Investing & Trading Score: 36 | |
| Day Percent Change: 1.01% Day Change: 0.29 | |
| Week Change: 1.01% Year-to-date Change: -7.7% | |
| SBSI Links: Profile News Message Board | |
| Charts:- Daily , Weekly | |
| Add SBSI to Watchlist: View: Get Complete SBSI Trend Analysis ➞ | |
 | KMPR Kemper Corporation |
| Sector: Financials | |
| SubSector: Property & Casualty Insurance | |
| MarketCap: 4035.12 Millions | |
| Recent Price: 60.91 Smart Investing & Trading Score: 28 | |
| Day Percent Change: 1.42% Day Change: 0.85 | |
| Week Change: 1.42% Year-to-date Change: -7.9% | |
| KMPR Links: Profile News Message Board | |
| Charts:- Daily , Weekly | |
| Add KMPR to Watchlist: View: Get Complete KMPR Trend Analysis ➞ | |
 | WAFD Washington Federal, Inc. |
| Sector: Financials | |
| SubSector: Savings & Loans | |
| MarketCap: 2219.2 Millions | |
| Recent Price: 29.41 Smart Investing & Trading Score: 68 | |
| Day Percent Change: 1.87% Day Change: 0.54 | |
| Week Change: 1.87% Year-to-date Change: -8.0% | |
| WAFD Links: Profile News Message Board | |
| Charts:- Daily , Weekly | |
| Add WAFD to Watchlist: View: Get Complete WAFD Trend Analysis ➞ | |
 | MET MetLife, Inc. |
| Sector: Financials | |
| SubSector: Life Insurance | |
| MarketCap: 26272.9 Millions | |
| Recent Price: 74.83 Smart Investing & Trading Score: 18 | |
| Day Percent Change: 1.11% Day Change: 0.82 | |
| Week Change: 1.11% Year-to-date Change: -8.0% | |
| MET Links: Profile News Message Board | |
| Charts:- Daily , Weekly | |
| Add MET to Watchlist: View: Get Complete MET Trend Analysis ➞ | |
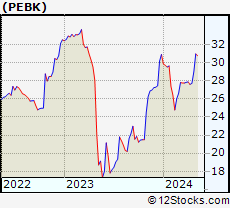 | PEBK Peoples Bancorp of North Carolina, Inc. |
| Sector: Financials | |
| SubSector: Regional - Mid-Atlantic Banks | |
| MarketCap: 180.759 Millions | |
| Recent Price: 28.36 Smart Investing & Trading Score: 46 | |
| Day Percent Change: 1.79% Day Change: 0.5 | |
| Week Change: 1.79% Year-to-date Change: -8.0% | |
| PEBK Links: Profile News Message Board | |
| Charts:- Daily , Weekly | |
| Add PEBK to Watchlist: View: Get Complete PEBK Trend Analysis ➞ | |
| For tabular summary view of above stock list: Summary View ➞ 0 - 25 , 25 - 50 , 50 - 75 , 75 - 100 , 100 - 125 , 125 - 150 , 150 - 175 , 175 - 200 , 200 - 225 , 225 - 250 , 250 - 275 , 275 - 300 , 300 - 325 , 325 - 350 , 350 - 375 , 375 - 400 , 400 - 425 , 425 - 450 , 450 - 475 , 475 - 500 , 500 - 525 , 525 - 550 , 550 - 575 | ||
| Click To Change The Sort Order: By Market Cap or Company Size Performance: Year-to-date, Week and Day | |
| Select Chart Type: | ||
|
Best Stocks Today 12Stocks.com |
© 2025 12Stocks.com Terms & Conditions Privacy Contact Us
All Information Provided Only For Education And Not To Be Used For Investing or Trading. See Terms & Conditions


One More Thing ... Get Best Stocks Delivered Daily!
Never Ever Miss A Move With Our Top Ten Stocks Lists
Find Best Stocks In Any Market - Bull or Bear Market
Take A Peek At Our Top Ten Stocks Lists: Daily, Weekly, Year-to-Date & Top Trends
Find Best Stocks In Any Market - Bull or Bear Market
Take A Peek At Our Top Ten Stocks Lists: Daily, Weekly, Year-to-Date & Top Trends
Financial Stocks With Best Up Trends [0-bearish to 100-bullish]: Uniti [100], LendingTree [100], Mercury General[100], Perella Weinberg[100], Broadstone Net[100], LendingClub [100], TPG RE[100], CareTrust REIT[100], Stewart Information[100], Healthcare Realty[100], VICI Properties[100]
Best Financial Stocks Year-to-Date:
ESSA Bancorp[3207.77%], Easterly Government[108.45%], Mr. Cooper[86.58%], Heritage Insurance[75.29%], Root [65.29%], Industrial Logistics[64.89%], Rocket [58.42%], Diversified Healthcare[49.61%], ProAssurance [49.59%], Uniti [47.09%], SoFi Technologies[41.62%] Best Financial Stocks This Week:
Uniti [64.77%], Industrial Logistics[11.36%], LendingTree [7.32%], eXp World[7.27%], EverQuote [6.89%], Camping World[6.84%], First Foundation[6.69%], Diamond Hill[5.46%], Mercury General[5.36%], Cipher Mining[5.27%], AlTi Global[5.13%] Best Financial Stocks Daily:
Uniti [64.77%], Industrial Logistics[11.36%], LendingTree [7.32%], eXp World[7.27%], EverQuote [6.89%], Camping World[6.84%], First Foundation[6.69%], Diamond Hill[5.46%], Mercury General[5.36%], Cipher Mining[5.27%], AlTi Global[5.13%]