
 Login Sign Up


| |||||
 |  | ||||

| 12Stocks.com Market Intelligence |
Best Financial Stocks
| In a hurry? Financial Stocks Lists: Performance Trends Table, Stock Charts
Sort Financial stocks: Daily, Weekly, Year-to-Date, Market Cap & Trends. Filter Financial stocks list by size:All Financial Large Mid-Range Small & MicroCap |
| 12Stocks.com Financial Stocks Performances & Trends Daily | |||||||||
|
|  The overall Smart Investing & Trading Score is 33 (0-bearish to 100-bullish) which puts Financial sector in short term bearish to neutral trend. The Smart Investing & Trading Score from previous trading session is 26 and hence an improvement of trend.
| ||||||||
Here are the Smart Investing & Trading Scores of the most requested Financial stocks at 12Stocks.com (click stock name for detailed review):
|


| 12Stocks.com: Investing in Financial sector with Stocks | |
|
The following table helps investors and traders sort through current performance and trends (as measured by Smart Investing & Trading Score) of various
stocks in the Financial sector. Quick View: Move mouse or cursor over stock symbol (ticker) to view short-term Technical chart and over stock name to view long term chart. Click on  to add stock symbol to your watchlist and to add stock symbol to your watchlist and  to view watchlist. Click on any ticker or stock name for detailed market intelligence report for that stock. to view watchlist. Click on any ticker or stock name for detailed market intelligence report for that stock. |
12Stocks.com Performance of Stocks in Financial Sector
| Ticker | Stock Name | Watchlist | Category | Recent Price | Smart Investing & Trading Score | Change % | YTD Change% |
| JLL | Jones Lang |   | Property Mgmt | 270.43 | 78 | 1.91% | 6.83% |
| ABCB | Ameris Bancorp | | Regional Banks | 66.60 | 33 | 1.05% | 6.81% |
| AXS | AXIS Capital | | Insurance | 94.09 | 25 | 0.81% | 6.64% |
| HTH | Hilltop | | Mortgage | 30.35 | 68 | 2.64% | 6.61% |
| SF | Stifel | | Brokerage | 112.27 | 65 | 0.99% | 6.30% |
| NRIM | Northrim BanCorp | | Regional Banks | 82.11 | 10 | 0.53% | 6.23% |
| CNNE | Cannae | | Asset Mgmt | 20.93 | 36 | 1.06% | 6.17% |
| ACNB | ACNB | | Regional - Southwest Banks | 41.95 | 43 | 1.50% | 6.16% |
| VCTR | Victory Capital | | Asset Mgmt | 68.93 | 63 | 3.19% | 6.02% |
| ALL | Allstate | | Insurance | 203.03 | 64 | 1.63% | 5.84% |
| NHI | National Health | | REIT | 72.41 | 77 | 1.51% | 5.76% |
| DX | Dynex Capital | | Mortgage | 12.57 | 70 | 0.96% | 5.63% |
| STWD | Starwood Property | | Mortgage | 19.51 | 25 | 0.72% | 5.51% |
| BANF | BancFirst | | Regional - Southwest Banks | 122.87 | 23 | 0.47% | 5.30% |
| KEY | KeyCorp | | Regional Banks | 17.83 | 53 | 1.02% | 5.30% |
| ESNT | Essent | | Mortgage | 56.93 | 64 | 0.73% | 5.18% |
| EWBC | East West | | Foreign Banks | 100.03 | 43 | 1.24% | 5.07% |
| TRMK | Trustmark | | Regional Banks | 36.89 | 43 | 0.90% | 4.99% |
| BAC | Bank of America | | Banks | 45.85 | 26 | 0.42% | 4.98% |
| AOMR | Angel Oak | | REIT - Mortgage | 9.43 | 73 | 2.61% | 4.93% |
| CINF | Cinnati | | Insurance | 149.74 | 55 | 2.43% | 4.83% |
| ALLY | Ally | | Mortgage | 37.44 | 53 | 1.11% | 4.76% |
| VLY | Valley National | | Regional Banks | 9.35 | 56 | 1.85% | 4.54% |
| RDN | Radian | | Insurance | 32.90 | 10 | -0.06% | 4.54% |
| SVC | Service Properties | | REIT | 2.63 | 58 | 1.54% | 4.49% |
| For chart view version of above stock list: Chart View ➞ 0 - 25 , 25 - 50 , 50 - 75 , 75 - 100 , 100 - 125 , 125 - 150 , 150 - 175 , 175 - 200 , 200 - 225 , 225 - 250 , 250 - 275 , 275 - 300 , 300 - 325 , 325 - 350 , 350 - 375 , 375 - 400 , 400 - 425 , 425 - 450 , 450 - 475 , 475 - 500 , 500 - 525 , 525 - 550 , 550 - 575 | ||
 | Click To Change The Sort Order: By Market Cap or Company Size Performance: Year-to-date, Week and Day |  |
|
Get the most comprehensive stock market coverage daily at 12Stocks.com ➞ Best Stocks Today ➞ Best Stocks Weekly ➞ Best Stocks Year-to-Date ➞ Best Stocks Trends ➞  Best Stocks Today 12Stocks.com Best Nasdaq Stocks ➞ Best S&P 500 Stocks ➞ Best Tech Stocks ➞ Best Biotech Stocks ➞ |
| Detailed Overview of Financial Stocks |
| Financial Technical Overview, Leaders & Laggards, Top Financial ETF Funds & Detailed Financial Stocks List, Charts, Trends & More |
| Financial Sector: Technical Analysis, Trends & YTD Performance | |
| Financial sector is composed of stocks
from banks, brokers, insurance, REITs
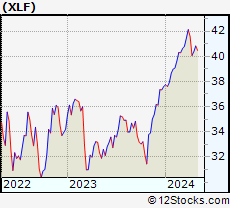
and services subsectors. Financial sector, as represented by XLF, an exchange-traded fund [ETF] that holds basket of Financial stocks (e.g, Bank of America, Goldman Sachs) is up by 7.8% and is currently outperforming the overall market by 0.27% year-to-date. Below is a quick view of Technical charts and trends: |
|
 XLF Weekly Chart |
|
| Long Term Trend: Good | |
| Medium Term Trend: Not Good | |
 XLF Daily Chart |
|
| Short Term Trend: Not Good | |
| Overall Trend Score: 33 | |
| YTD Performance: 7.8% | |
| **Trend Scores & Views Are Only For Educational Purposes And Not For Investing | |
| 12Stocks.com: Top Performing Financial Sector Stocks | ||||||||||||||||||||||||||||||||||||||||||||||||
 The top performing Financial sector stocks year to date are
Now, more recently, over last week, the top performing Financial sector stocks on the move are


|
||||||||||||||||||||||||||||||||||||||||||||||||
| 12Stocks.com: Investing in Financial Sector using Exchange Traded Funds | |
|
The following table shows list of key exchange traded funds (ETF) that
help investors track Financial Index. For detailed view, check out our ETF Funds section of our website. Quick View: Move mouse or cursor over ETF symbol (ticker) to view short-term Technical chart and over ETF name to view long term chart. Click on ticker or stock name for detailed view. Click on to add stock symbol to your watchlist and to view watchlist. |
12Stocks.com List of ETFs that track Financial Index
| Ticker | ETF Name | Watchlist | Recent Price | Smart Investing & Trading Score | Change % | Week % | Year-to-date % |
| XLF | Financial | | 51.91 | 33 | 0.99 | 0.99 | 7.8% |
| IAI | Broker-Dealers & Secs | | 174.97 | 63 | 2.34 | 2.34 | 21.82% |
| KBE | Bank | | 55.98 | 43 | 1.3 | 1.3 | 1.64% |
| FAS | Financial Bull 3X | | 161.82 | 33 | 2.91 | 2.91 | 7.48% |
| FAZ | Financial Bear 3X | | 4.54 | 62 | -2.78 | -2.78 | -27.4% |
| UYG | Financials | | 92.87 | 26 | 1.72 | 1.72 | 9% |
| KIE | Insurance | | 56.42 | 25 | 1.27 | 1.27 | 0.32% |
| 12Stocks.com: Charts, Trends, Fundamental Data and Performances of Financial Stocks | |
|
We now take in-depth look at all Financial stocks including charts, multi-period performances and overall trends (as measured by Smart Investing & Trading Score). One can sort Financial stocks (click link to choose) by Daily, Weekly and by Year-to-Date performances. Also, one can sort by size of the company or by market capitalization. |
| Select Your Default Chart Type: | |||||
| |||||
| Click on stock symbol or name for detailed view. Click on to add stock symbol to your watchlist and to view watchlist. Quick View: Move mouse or cursor over "Daily" to quickly view daily Technical stock chart and over "Weekly" to view weekly Technical stock chart. | |||||

 | JLL Jones Lang LaSalle Incorporated |
| Sector: Financials | |
| SubSector: Property Management | |
| MarketCap: 5259.32 Millions | |
| Recent Price: 270.43 Smart Investing & Trading Score: 78 | |
| Day Percent Change: 1.91% Day Change: 5.08 | |
| Week Change: 1.91% Year-to-date Change: 6.8% | |
| JLL Links: Profile News Message Board | |
| Charts:- Daily , Weekly | |
| Add JLL to Watchlist: View: Get Complete JLL Trend Analysis ➞ | |
 | ABCB Ameris Bancorp |
| Sector: Financials | |
| SubSector: Regional - Mid-Atlantic Banks | |
| MarketCap: 1537.79 Millions | |
| Recent Price: 66.60 Smart Investing & Trading Score: 33 | |
| Day Percent Change: 1.05% Day Change: 0.69 | |
| Week Change: 1.05% Year-to-date Change: 6.8% | |
| ABCB Links: Profile News Message Board | |
| Charts:- Daily , Weekly | |
| Add ABCB to Watchlist: View: Get Complete ABCB Trend Analysis ➞ | |
 | AXS AXIS Capital Holdings Limited |
| Sector: Financials | |
| SubSector: Property & Casualty Insurance | |
| MarketCap: 3709.12 Millions | |
| Recent Price: 94.09 Smart Investing & Trading Score: 25 | |
| Day Percent Change: 0.81% Day Change: 0.76 | |
| Week Change: 0.81% Year-to-date Change: 6.6% | |
| AXS Links: Profile News Message Board | |
| Charts:- Daily , Weekly | |
| Add AXS to Watchlist: View: Get Complete AXS Trend Analysis ➞ | |
 | HTH Hilltop Holdings Inc. |
| Sector: Financials | |
| SubSector: Mortgage Investment | |
| MarketCap: 1317.89 Millions | |
| Recent Price: 30.35 Smart Investing & Trading Score: 68 | |
| Day Percent Change: 2.64% Day Change: 0.78 | |
| Week Change: 2.64% Year-to-date Change: 6.6% | |
| HTH Links: Profile News Message Board | |
| Charts:- Daily , Weekly | |
| Add HTH to Watchlist: View: Get Complete HTH Trend Analysis ➞ | |
 | SF Stifel Financial Corp. |
| Sector: Financials | |
| SubSector: Investment Brokerage - Regional | |
| MarketCap: 2783.65 Millions | |
| Recent Price: 112.27 Smart Investing & Trading Score: 65 | |
| Day Percent Change: 0.99% Day Change: 1.1 | |
| Week Change: 0.99% Year-to-date Change: 6.3% | |
| SF Links: Profile News Message Board | |
| Charts:- Daily , Weekly | |
| Add SF to Watchlist: View: Get Complete SF Trend Analysis ➞ | |
 | NRIM Northrim BanCorp, Inc. |
| Sector: Financials | |
| SubSector: Regional - Pacific Banks | |
| MarketCap: 147.629 Millions | |
| Recent Price: 82.11 Smart Investing & Trading Score: 10 | |
| Day Percent Change: 0.53% Day Change: 0.43 | |
| Week Change: 0.53% Year-to-date Change: 6.2% | |
| NRIM Links: Profile News Message Board | |
| Charts:- Daily , Weekly | |
| Add NRIM to Watchlist: View: Get Complete NRIM Trend Analysis ➞ | |
 | CNNE Cannae Holdings, Inc. |
| Sector: Financials | |
| SubSector: Asset Management | |
| MarketCap: 2625.53 Millions | |
| Recent Price: 20.93 Smart Investing & Trading Score: 36 | |
| Day Percent Change: 1.06% Day Change: 0.22 | |
| Week Change: 1.06% Year-to-date Change: 6.2% | |
| CNNE Links: Profile News Message Board | |
| Charts:- Daily , Weekly | |
| Add CNNE to Watchlist: View: Get Complete CNNE Trend Analysis ➞ | |
 | ACNB ACNB Corporation |
| Sector: Financials | |
| SubSector: Regional - Southwest Banks | |
| MarketCap: 231.065 Millions | |
| Recent Price: 41.95 Smart Investing & Trading Score: 43 | |
| Day Percent Change: 1.5% Day Change: 0.62 | |
| Week Change: 1.5% Year-to-date Change: 6.2% | |
| ACNB Links: Profile News Message Board | |
| Charts:- Daily , Weekly | |
| Add ACNB to Watchlist: View: Get Complete ACNB Trend Analysis ➞ | |
 | VCTR Victory Capital Holdings, Inc. |
| Sector: Financials | |
| SubSector: Asset Management | |
| MarketCap: 1148.33 Millions | |
| Recent Price: 68.93 Smart Investing & Trading Score: 63 | |
| Day Percent Change: 3.19% Day Change: 2.13 | |
| Week Change: 3.19% Year-to-date Change: 6.0% | |
| VCTR Links: Profile News Message Board | |
| Charts:- Daily , Weekly | |
| Add VCTR to Watchlist: View: Get Complete VCTR Trend Analysis ➞ | |
 | ALL The Allstate Corporation |
| Sector: Financials | |
| SubSector: Property & Casualty Insurance | |
| MarketCap: 25916.6 Millions | |
| Recent Price: 203.03 Smart Investing & Trading Score: 64 | |
| Day Percent Change: 1.63% Day Change: 3.26 | |
| Week Change: 1.63% Year-to-date Change: 5.8% | |
| ALL Links: Profile News Message Board | |
| Charts:- Daily , Weekly | |
| Add ALL to Watchlist: View: Get Complete ALL Trend Analysis ➞ | |
 | NHI National Health Investors, Inc. |
| Sector: Financials | |
| SubSector: REIT - Healthcare Facilities | |
| MarketCap: 2156.54 Millions | |
| Recent Price: 72.41 Smart Investing & Trading Score: 77 | |
| Day Percent Change: 1.51% Day Change: 1.08 | |
| Week Change: 1.51% Year-to-date Change: 5.8% | |
| NHI Links: Profile News Message Board | |
| Charts:- Daily , Weekly | |
| Add NHI to Watchlist: View: Get Complete NHI Trend Analysis ➞ | |
 | DX Dynex Capital, Inc. |
| Sector: Financials | |
| SubSector: Mortgage Investment | |
| MarketCap: 327.839 Millions | |
| Recent Price: 12.57 Smart Investing & Trading Score: 70 | |
| Day Percent Change: 0.96% Day Change: 0.12 | |
| Week Change: 0.96% Year-to-date Change: 5.6% | |
| DX Links: Profile News Message Board | |
| Charts:- Daily , Weekly | |
| Add DX to Watchlist: View: Get Complete DX Trend Analysis ➞ | |
 | STWD Starwood Property Trust, Inc. |
| Sector: Financials | |
| SubSector: Mortgage Investment | |
| MarketCap: 3447.09 Millions | |
| Recent Price: 19.51 Smart Investing & Trading Score: 25 | |
| Day Percent Change: 0.72% Day Change: 0.14 | |
| Week Change: 0.72% Year-to-date Change: 5.5% | |
| STWD Links: Profile News Message Board | |
| Charts:- Daily , Weekly | |
| Add STWD to Watchlist: View: Get Complete STWD Trend Analysis ➞ | |
 | BANF BancFirst Corporation |
| Sector: Financials | |
| SubSector: Regional - Southwest Banks | |
| MarketCap: 1068.65 Millions | |
| Recent Price: 122.87 Smart Investing & Trading Score: 23 | |
| Day Percent Change: 0.47% Day Change: 0.57 | |
| Week Change: 0.47% Year-to-date Change: 5.3% | |
| BANF Links: Profile News Message Board | |
| Charts:- Daily , Weekly | |
| Add BANF to Watchlist: View: Get Complete BANF Trend Analysis ➞ | |
 | KEY KeyCorp |
| Sector: Financials | |
| SubSector: Regional - Midwest Banks | |
| MarketCap: 10045 Millions | |
| Recent Price: 17.83 Smart Investing & Trading Score: 53 | |
| Day Percent Change: 1.02% Day Change: 0.18 | |
| Week Change: 1.02% Year-to-date Change: 5.3% | |
| KEY Links: Profile News Message Board | |
| Charts:- Daily , Weekly | |
| Add KEY to Watchlist: View: Get Complete KEY Trend Analysis ➞ | |
 | ESNT Essent Group Ltd. |
| Sector: Financials | |
| SubSector: Mortgage Investment | |
| MarketCap: 2806.19 Millions | |
| Recent Price: 56.93 Smart Investing & Trading Score: 64 | |
| Day Percent Change: 0.73% Day Change: 0.41 | |
| Week Change: 0.73% Year-to-date Change: 5.2% | |
| ESNT Links: Profile News Message Board | |
| Charts:- Daily , Weekly | |
| Add ESNT to Watchlist: View: Get Complete ESNT Trend Analysis ➞ | |
 | EWBC East West Bancorp, Inc. |
| Sector: Financials | |
| SubSector: Foreign Money Center Banks | |
| MarketCap: 4618.31 Millions | |
| Recent Price: 100.03 Smart Investing & Trading Score: 43 | |
| Day Percent Change: 1.24% Day Change: 1.23 | |
| Week Change: 1.24% Year-to-date Change: 5.1% | |
| EWBC Links: Profile News Message Board | |
| Charts:- Daily , Weekly | |
| Add EWBC to Watchlist: View: Get Complete EWBC Trend Analysis ➞ | |
 | TRMK Trustmark Corporation |
| Sector: Financials | |
| SubSector: Regional - Southeast Banks | |
| MarketCap: 1630.15 Millions | |
| Recent Price: 36.89 Smart Investing & Trading Score: 43 | |
| Day Percent Change: 0.9% Day Change: 0.33 | |
| Week Change: 0.9% Year-to-date Change: 5.0% | |
| TRMK Links: Profile News Message Board | |
| Charts:- Daily , Weekly | |
| Add TRMK to Watchlist: View: Get Complete TRMK Trend Analysis ➞ | |
 | BAC Bank of America Corporation |
| Sector: Financials | |
| SubSector: Money Center Banks | |
| MarketCap: 189690 Millions | |
| Recent Price: 45.85 Smart Investing & Trading Score: 26 | |
| Day Percent Change: 0.42% Day Change: 0.19 | |
| Week Change: 0.42% Year-to-date Change: 5.0% | |
| BAC Links: Profile News Message Board | |
| Charts:- Daily , Weekly | |
| Add BAC to Watchlist: View: Get Complete BAC Trend Analysis ➞ | |
 | AOMR Angel Oak Mortgage REIT, Inc. |
| Sector: Financials | |
| SubSector: REIT - Mortgage | |
| MarketCap: 202 Millions | |
| Recent Price: 9.43 Smart Investing & Trading Score: 73 | |
| Day Percent Change: 2.61% Day Change: 0.24 | |
| Week Change: 2.61% Year-to-date Change: 4.9% | |
| AOMR Links: Profile News Message Board | |
| Charts:- Daily , Weekly | |
| Add AOMR to Watchlist: View: Get Complete AOMR Trend Analysis ➞ | |
 | CINF Cincinnati Financial Corporation |
| Sector: Financials | |
| SubSector: Property & Casualty Insurance | |
| MarketCap: 13637 Millions | |
| Recent Price: 149.74 Smart Investing & Trading Score: 55 | |
| Day Percent Change: 2.43% Day Change: 3.55 | |
| Week Change: 2.43% Year-to-date Change: 4.8% | |
| CINF Links: Profile News Message Board | |
| Charts:- Daily , Weekly | |
| Add CINF to Watchlist: View: Get Complete CINF Trend Analysis ➞ | |
 | ALLY Ally Financial Inc. |
| Sector: Financials | |
| SubSector: Mortgage Investment | |
| MarketCap: 4643.99 Millions | |
| Recent Price: 37.44 Smart Investing & Trading Score: 53 | |
| Day Percent Change: 1.11% Day Change: 0.41 | |
| Week Change: 1.11% Year-to-date Change: 4.8% | |
| ALLY Links: Profile News Message Board | |
| Charts:- Daily , Weekly | |
| Add ALLY to Watchlist: View: Get Complete ALLY Trend Analysis ➞ | |
 | VLY Valley National Bancorp |
| Sector: Financials | |
| SubSector: Regional - Northeast Banks | |
| MarketCap: 2843.09 Millions | |
| Recent Price: 9.35 Smart Investing & Trading Score: 56 | |
| Day Percent Change: 1.85% Day Change: 0.17 | |
| Week Change: 1.85% Year-to-date Change: 4.5% | |
| VLY Links: Profile News Message Board | |
| Charts:- Daily , Weekly | |
| Add VLY to Watchlist: View: Get Complete VLY Trend Analysis ➞ | |
 | RDN Radian Group Inc. |
| Sector: Financials | |
| SubSector: Property & Casualty Insurance | |
| MarketCap: 2950.12 Millions | |
| Recent Price: 32.90 Smart Investing & Trading Score: 10 | |
| Day Percent Change: -0.06% Day Change: -0.02 | |
| Week Change: -0.06% Year-to-date Change: 4.5% | |
| RDN Links: Profile News Message Board | |
| Charts:- Daily , Weekly | |
| Add RDN to Watchlist: View: Get Complete RDN Trend Analysis ➞ | |
 | SVC Service Properties Trust |
| Sector: Financials | |
| SubSector: REIT - Hotel/Motel | |
| MarketCap: 1067.74 Millions | |
| Recent Price: 2.63 Smart Investing & Trading Score: 58 | |
| Day Percent Change: 1.54% Day Change: 0.04 | |
| Week Change: 1.54% Year-to-date Change: 4.5% | |
| SVC Links: Profile News Message Board | |
| Charts:- Daily , Weekly | |
| Add SVC to Watchlist: View: Get Complete SVC Trend Analysis ➞ | |
| For tabular summary view of above stock list: Summary View ➞ 0 - 25 , 25 - 50 , 50 - 75 , 75 - 100 , 100 - 125 , 125 - 150 , 150 - 175 , 175 - 200 , 200 - 225 , 225 - 250 , 250 - 275 , 275 - 300 , 300 - 325 , 325 - 350 , 350 - 375 , 375 - 400 , 400 - 425 , 425 - 450 , 450 - 475 , 475 - 500 , 500 - 525 , 525 - 550 , 550 - 575 | ||
| Click To Change The Sort Order: By Market Cap or Company Size Performance: Year-to-date, Week and Day | |
| Select Chart Type: | ||
|
Best Stocks Today 12Stocks.com |
© 2025 12Stocks.com Terms & Conditions Privacy Contact Us
All Information Provided Only For Education And Not To Be Used For Investing or Trading. See Terms & Conditions


One More Thing ... Get Best Stocks Delivered Daily!
Never Ever Miss A Move With Our Top Ten Stocks Lists
Find Best Stocks In Any Market - Bull or Bear Market
Take A Peek At Our Top Ten Stocks Lists: Daily, Weekly, Year-to-Date & Top Trends
Find Best Stocks In Any Market - Bull or Bear Market
Take A Peek At Our Top Ten Stocks Lists: Daily, Weekly, Year-to-Date & Top Trends
Financial Stocks With Best Up Trends [0-bearish to 100-bullish]: Uniti [100], LendingTree [100], Mercury General[100], Perella Weinberg[100], Broadstone Net[100], LendingClub [100], TPG RE[100], CareTrust REIT[100], Stewart Information[100], Healthcare Realty[100], VICI Properties[100]
Best Financial Stocks Year-to-Date:
ESSA Bancorp[3207.77%], Easterly Government[108.45%], Mr. Cooper[86.58%], Heritage Insurance[75.29%], Root [65.29%], Industrial Logistics[64.89%], Rocket [58.42%], Diversified Healthcare[49.61%], ProAssurance [49.59%], Uniti [47.09%], SoFi Technologies[41.62%] Best Financial Stocks This Week:
Uniti [64.77%], Industrial Logistics[11.36%], LendingTree [7.32%], eXp World[7.27%], EverQuote [6.89%], Camping World[6.84%], First Foundation[6.69%], Diamond Hill[5.46%], Mercury General[5.36%], Cipher Mining[5.27%], AlTi Global[5.13%] Best Financial Stocks Daily:
Uniti [64.77%], Industrial Logistics[11.36%], LendingTree [7.32%], eXp World[7.27%], EverQuote [6.89%], Camping World[6.84%], First Foundation[6.69%], Diamond Hill[5.46%], Mercury General[5.36%], Cipher Mining[5.27%], AlTi Global[5.13%]